Figure 1From “What is social desirability bias?”
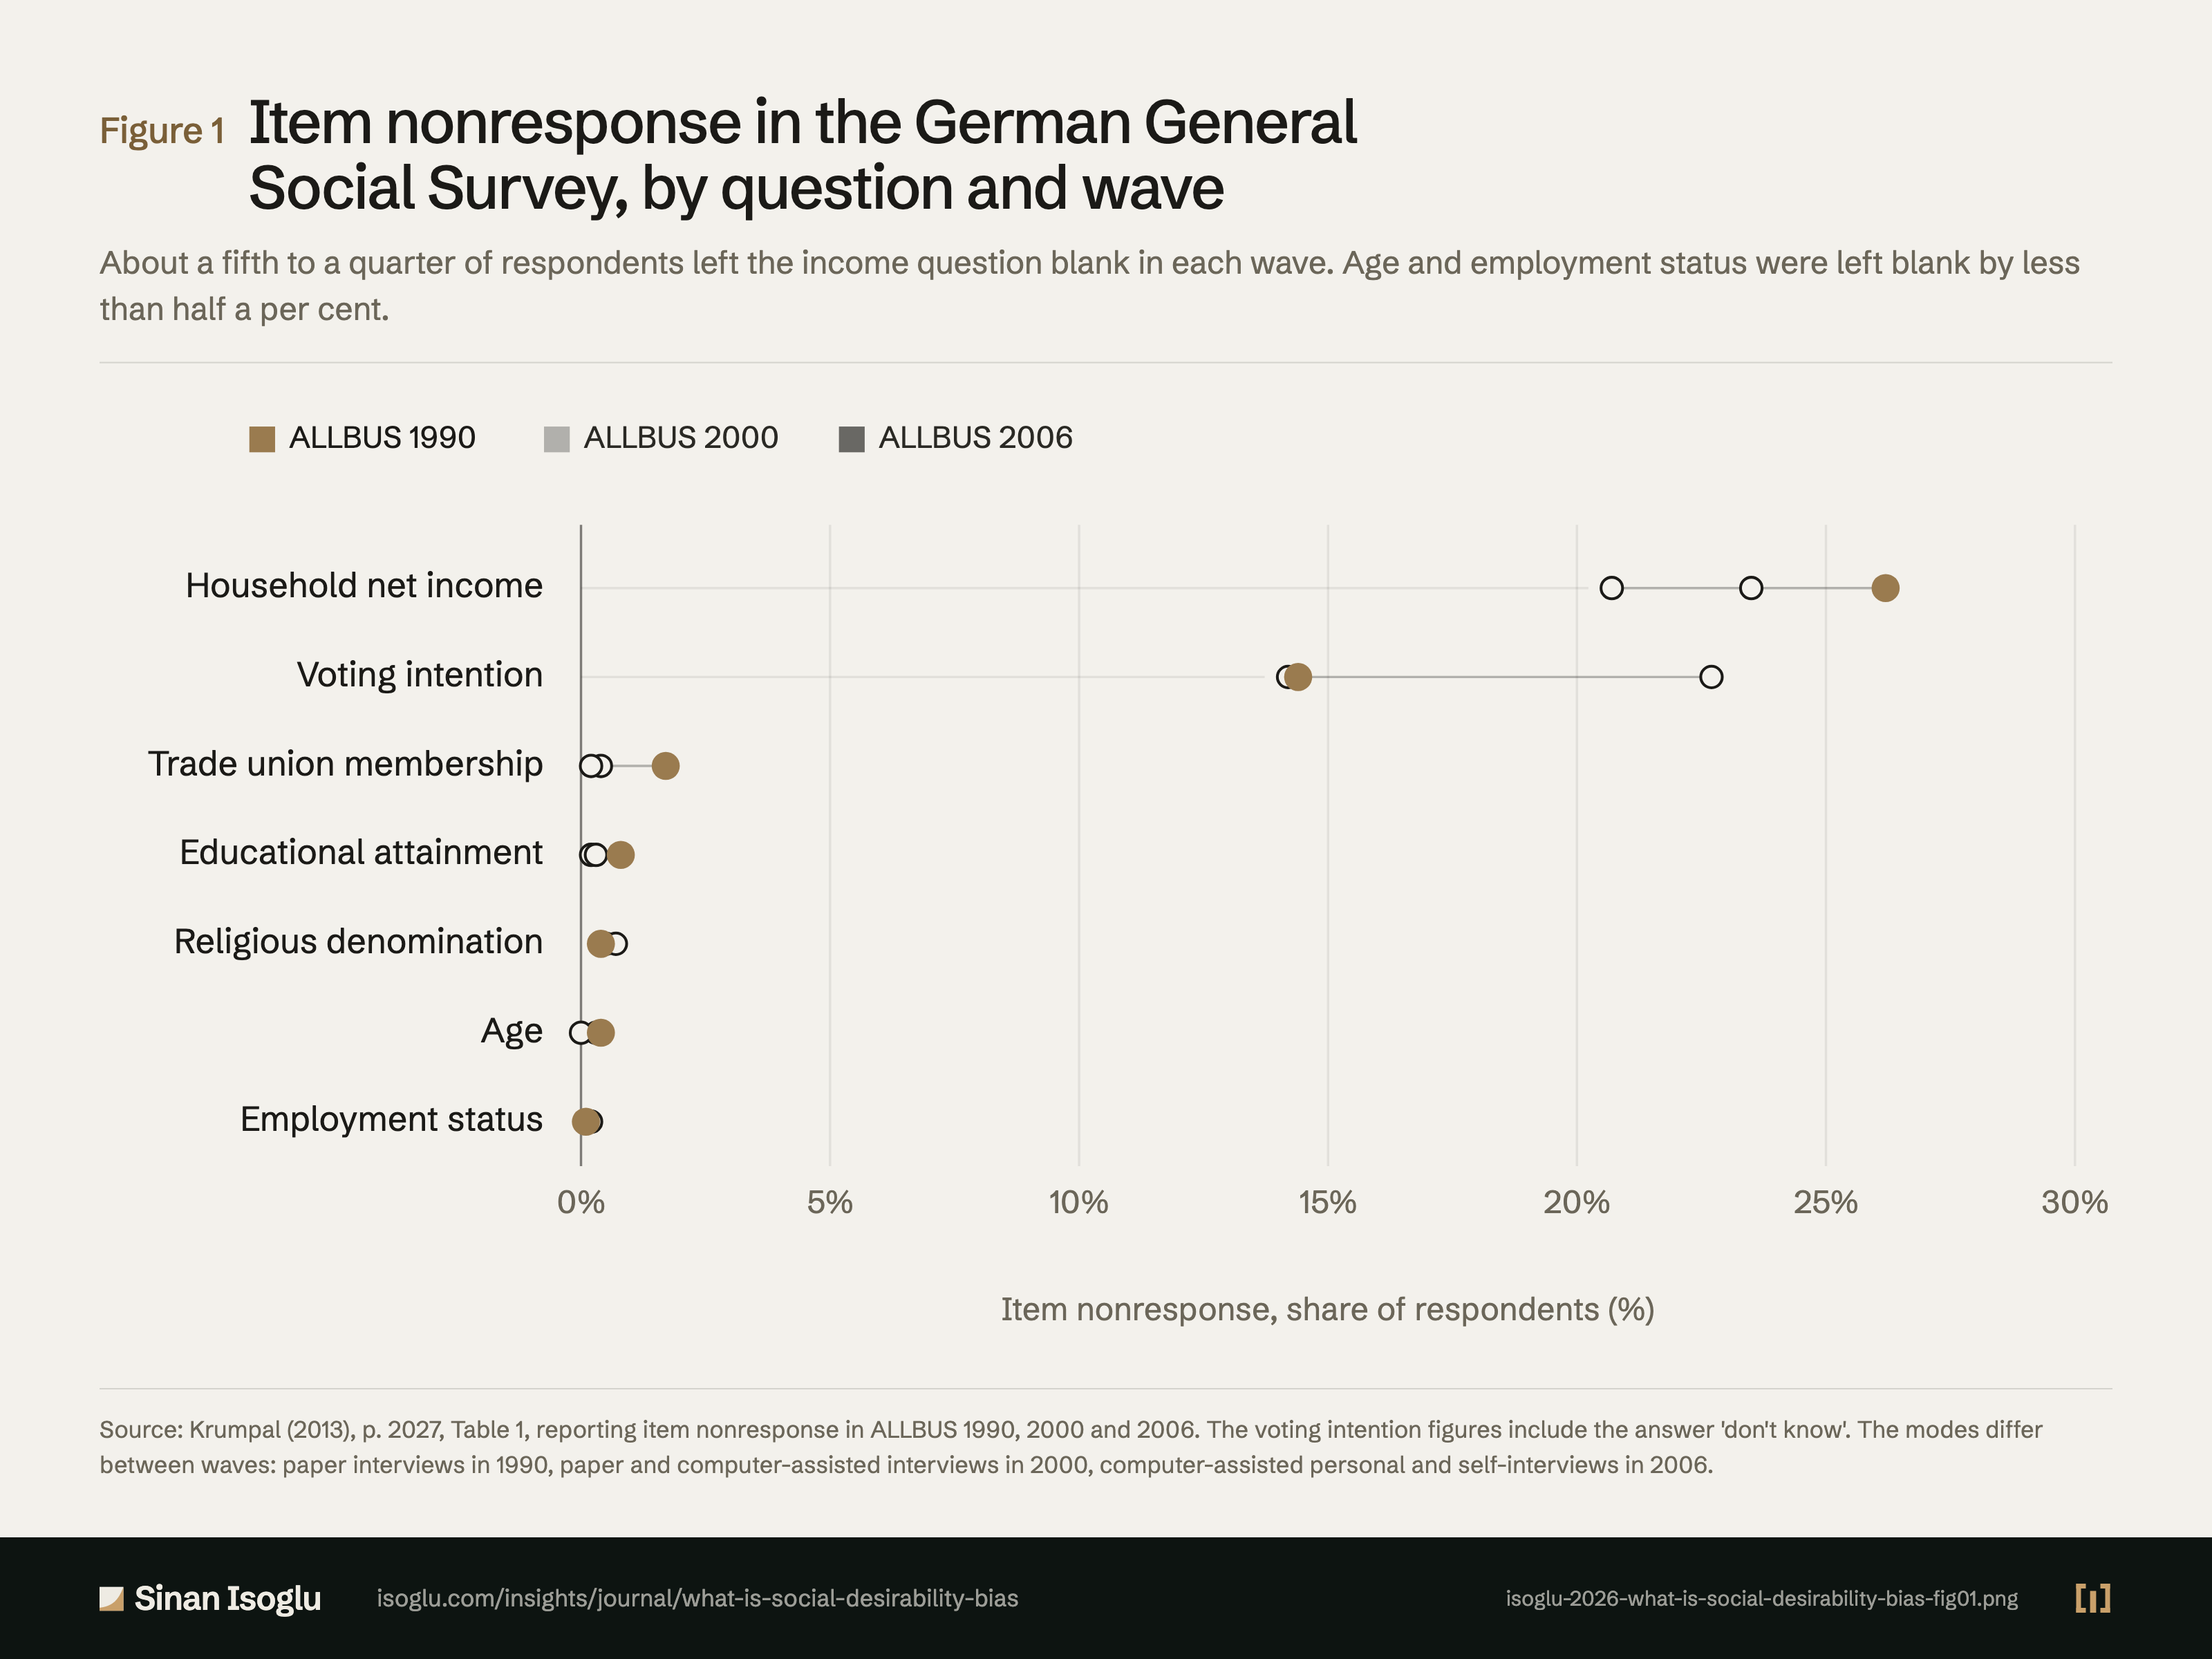
Item nonresponse in the German General Social Survey, by question and wave
About a fifth to a quarter of respondents left the income question blank in each wave. Age and employment status were left blank by less than half a per cent.
Figure 1Item nonresponse in the German General Social Survey, by question and wave
Source: Krumpal (2013), p. 2027, Table 1, reporting item nonresponse in ALLBUS 1990, 2000 and 2006. The voting intention figures include the answer 'don't know'. The modes differ between waves: paper interviews in 1990, paper and computer-assisted interviews in 2000, computer-assisted personal and self-interviews in 2006.
Source and evidence
Each line names a claim related to this exhibit, its source, and how it was checked.
- A KRU13-C3 ALLBUS 1990, 2000 and 2006 item nonresponse (Table 1): household net income 26.2, 23.5, 20.7%; voting intention 14.4, 22.7, 14.2% including don't know; trade union 1.7, 0.2, 0.4; education 0.8, 0.3, 0.2; religion 0.4, 0.7, 0.5; age 0.4, 0.0, 0.3; employment 0.1, 0.2, 0.1; modes PAPI, CAPI, CASI differ by wave; Coutts and Jann's online survey of 2,075 German access-panel members gave sensitivity scores, each the sum of two shares, of 79 for shoplifting, 73 for infidelity, 22 for freeriding and 20 for keeping too much change (pp. 2026, 2027): "some items (household net income and voting intention) have consistently more missing data than other items"; "the income question has the highest sensitivity of all items with nonresponse rates ranging from 20.7 to 26.2%"; "Statistic includes answer category ‘don’t know’"; "The most sensitive topics turned out to be shoplifting (79%) and infidelity (73%)."; "For each item, a total sensitivity score was calculated by adding the proportions of interviewees who stated"; "asked 2,075 respondents from a German access panel"Krumpal (2013) · Krumpal. (2013)
Grades: A, verified against the printed page of the primary source · B, primary source, text layer only · C, authoritative secondary · D, reported.
From the essay
From the research bench
What is social desirability bias?
Social desirability bias pushes survey answers toward what looks good. It is systematic, so a larger sample keeps it rather than removing it.
Read the essayThis exhibit belongs to an essay: the numbers live here, the argument lives there.
Cite or embed
Contact
Bring the question you're working on.
Research, a guest lecture, or a commercial question.