Figure 1From “What is CUPED?”
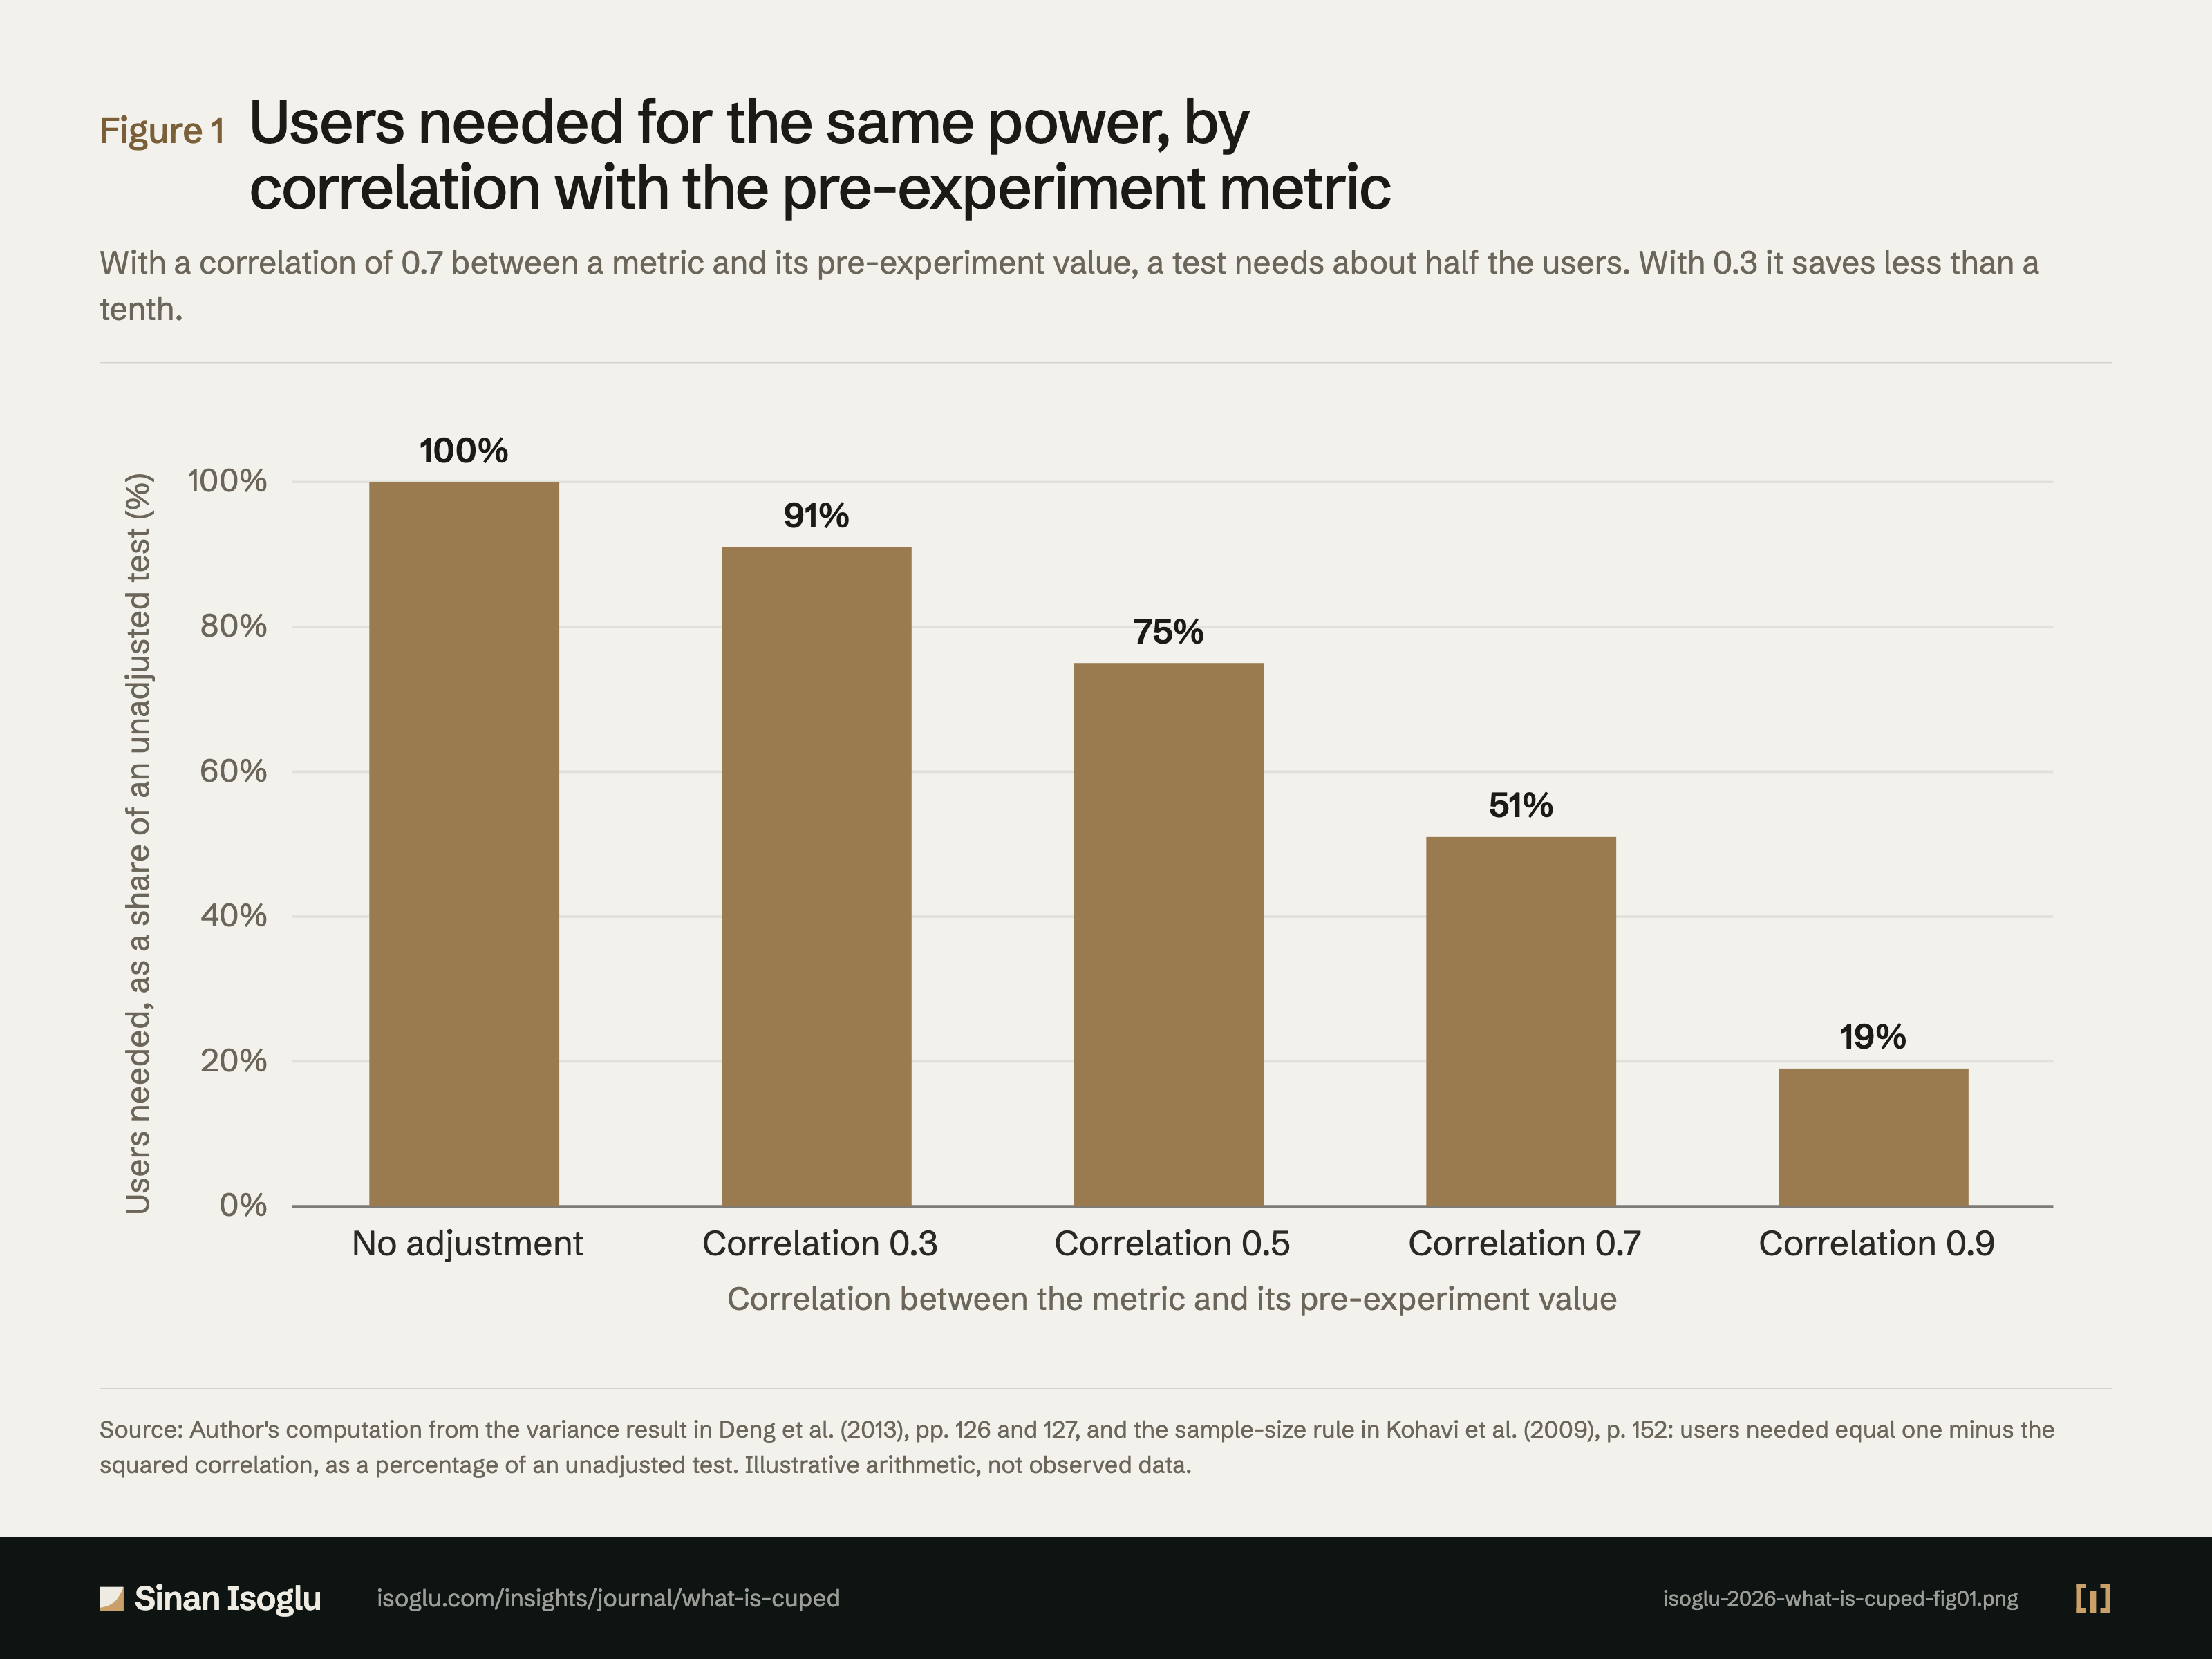
Users needed for the same power, by correlation with the pre-experiment metric
With a correlation of 0.7 between a metric and its pre-experiment value, a test needs about half the users. With 0.3 it saves less than a tenth.
Figure 1Users needed for the same power, by correlation with the pre-experiment metric
Source: Author's computation from the variance result in Deng et al. (2013), pp. 126 and 127, and the sample-size rule in Kohavi et al. (2009), p. 152: users needed equal one minus the squared correlation, as a percentage of an unadjusted test. Illustrative arithmetic, not observed data.
Source and evidence
Each line names a claim related to this exhibit, its source, and how it was checked.
- A DXKW13-C3 With control variates the variance of the delta falls by the squared correlation between metric and covariate; the optimal coefficient is the OLS slope; a covariate built only from pre-experiment information has equal expectation in both groups by randomization; the same metric in the pre-period is the natural covariate; one coefficient serves both groups; stratification is the categorical special case; unlike a linear model the argument needs no model of the outcome (pp. 125 to 127): "The larger ρ, the better the variance reduction"; "turns out to be the ordinary least square (OLS) solution of regressing (centered) Y on (centered) X"; "By using only information from before the launch of the experiment to construct the control variate, the randomization between treatment and control ensures"; "an obvious approach is to choose X to be the same as Y, which naturally leads to using the same variable during pre-experiment observation window as the control variate"; "the same θ has to be used for both control and treatment"; "when the covariate X is categorical (say, with discrete values 1, . . . , K) the two approaches produce identical estimates"; "To achieve a large correlation and hence better variance reduction, an obvious approach is to choose X to be the same as Y"; "makes strong assumptions that are usually not satisfied in practice"Deng, Xu, Kohavi & Walker (2013) · Deng, Xu, Kohavi & Walker. (2013)
- A KLSH09-C5 The standard error of a mean falls with the square root of the sample size; the minimum sample size for 95% confidence and 80% power grows with the variance and falls with the square of the detectable change; in a shop with 5% buyers a 5% revenue change needs over 409,000 users and a 5% conversion change under 122,000; lower-variability metrics and filtering unexposed users raise sensitivity; an A/A test checks variability and the system (pp. 151 to 153): "the Std-Err of a mean is inversely proportional to the square root of the sample size"; "A second formula is a calculation for the minimum sample size, assuming the desired confidence level is 95% and the desired power is 80%"; "you will need over 409,000 users to achieve the desired 80% power"; "you will need less than 122,000 users to achieve the desired power"; "Use OEC components that have inherently lower variability"; "Lower the variability of the OEC by filtering out users who were not exposed to the variants"Kohavi, Longbotham, Sommerfield & Henne (2009)
- B CUPED-OWN-C2 Figure 1: users needed for the same power equal one minus the squared correlation as a share of an unadjusted test (100, 91, 75, 51 and 19 per cent for correlations 0, 0.3, 0.5, 0.7 and 0.9); illustrative arithmetic, not data.Author computation from DXKW13-C3 and KLSH09-C5
Grades: A, verified against the printed page of the primary source · B, primary source, text layer only · C, authoritative secondary · D, reported.
From the essay
From the research bench
What is CUPED?
CUPED adjusts an A/B test metric with the same metric measured before the test. It cuts noise, not bias, and needs a covariate the test cannot move.
Read the essayThis exhibit belongs to an essay: the numbers live here, the argument lives there.
Cite or embed
Related exhibits
Contact
Bring the question you're working on.
Research, a guest lecture, or a commercial question.