Growth that compounds, not just accumulates.
Focusing on the decisions that make B2B growth compound: where to play, how to price, how to run the revenue system, and what survives a cross-border deal.

- Research
- Fieldwork open at EM Normandie
Thesis
Addition has a ceiling. Leverage doesn’t.
Most growth levers eventually flatten. More spend, headcount or activity can move a quarter without improving the next one.
Leverage is different: it makes the next decision easier as well as the current one. Better pricing sharpens positioning. A clearer go-to-market motion can improve retention. AI can turn revenue operations into capacity rather than overhead.
The question is where leverage sits, and whether it survives the quarter that created it. That question connects the work, the research and the teaching here.
Evidence
The latest exhibit
From the essay
What drives salesperson performance?
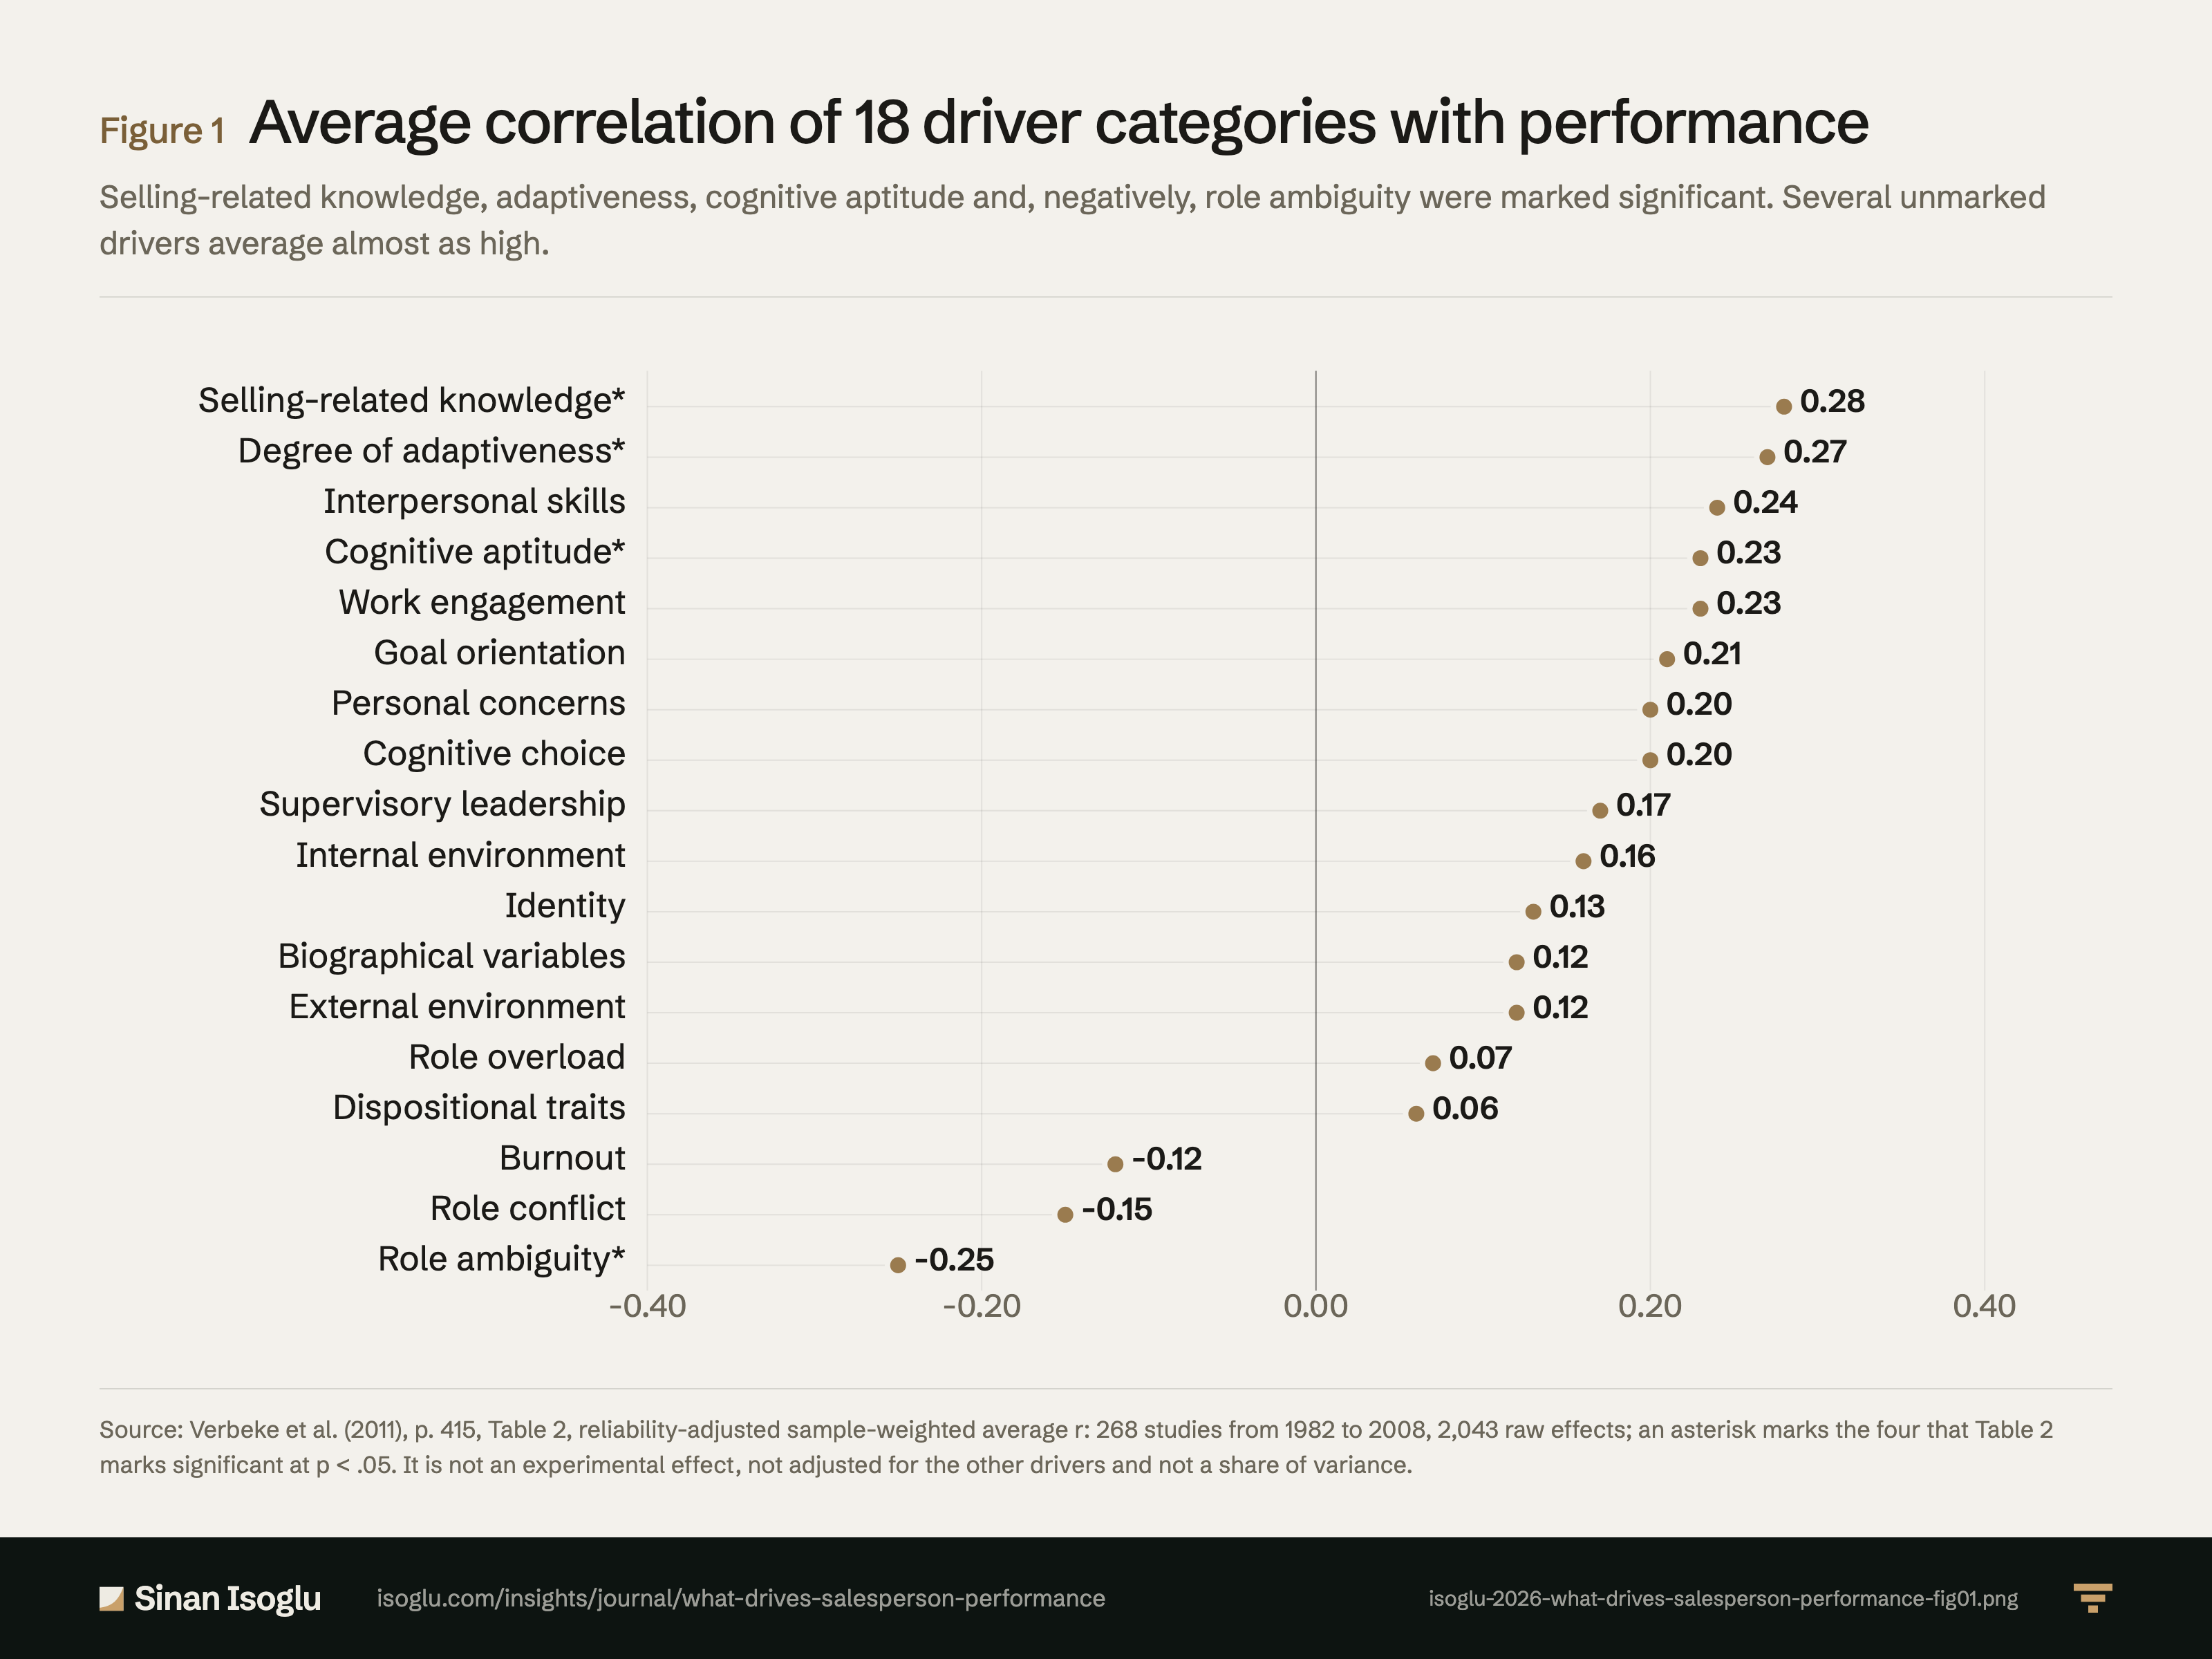
A meta-analysis of 268 studies marked four of 18 driver categories as significant correlates of salesperson performance. A ranking, not a proven cause.
18 Oct 2026
Read the essay →Figure 1Average correlation of 18 driver categories with performance
Swipe sideways to see the whole chart.
Verbeke et al. (2011), p. 415, Table 2, reliability-adjusted sample-weighted average r: 268 studies from 1982 to 2008, 2,043 raw effects; an asterisk marks the four that Table 2 marks significant at p < .05. It is not an experimental effect, not adjusted for the other drivers and not a share of variance.
PNGExhibit pagePractice
One operator, three lenses.
Commercial growth from the operator's seat. Cross-border integration from the research bench. The same decisions tested in the lecture hall.

Research
Fieldwork open
A DBA at EM Normandie on the first year after a cross-border acquisition: what happens to sales, marketing and the revenue case. Fieldwork is under way.
Take part in the study →
Lecturing
Teaching marketing, pricing and growth at IU, where an idea has to survive questions before it earns a place on the syllabus.
More on the lecturing →
Work
The commercial systems behind growth: go-to-market, pricing, revenue operations and cross-border expansion. This site is the working publishing and research system that holds the work.
More on the work →Published
Latest essays.
All essays →- 18 Oct 2026 Revenue operations & AI What drives salesperson performance? 14 min
- 18 Oct 2026 Growth that compounds What is a default option? 18 min
- 18 Oct 2026 Go-to-market strategy What is a market entry strategy? 9 min
- 18 Oct 2026 From the research bench What is a nudge? 18 min
- 18 Oct 2026 Pricing & revenue architecture What is a price promotion? 10 min
- 18 Oct 2026 Go-to-market strategy What is a route to market? 10 min
Contact
Bring the question you're working on.
Research, a guest lecture, or a commercial question.