← Every exhibit

Figure 1From “What is sales forecasting?”

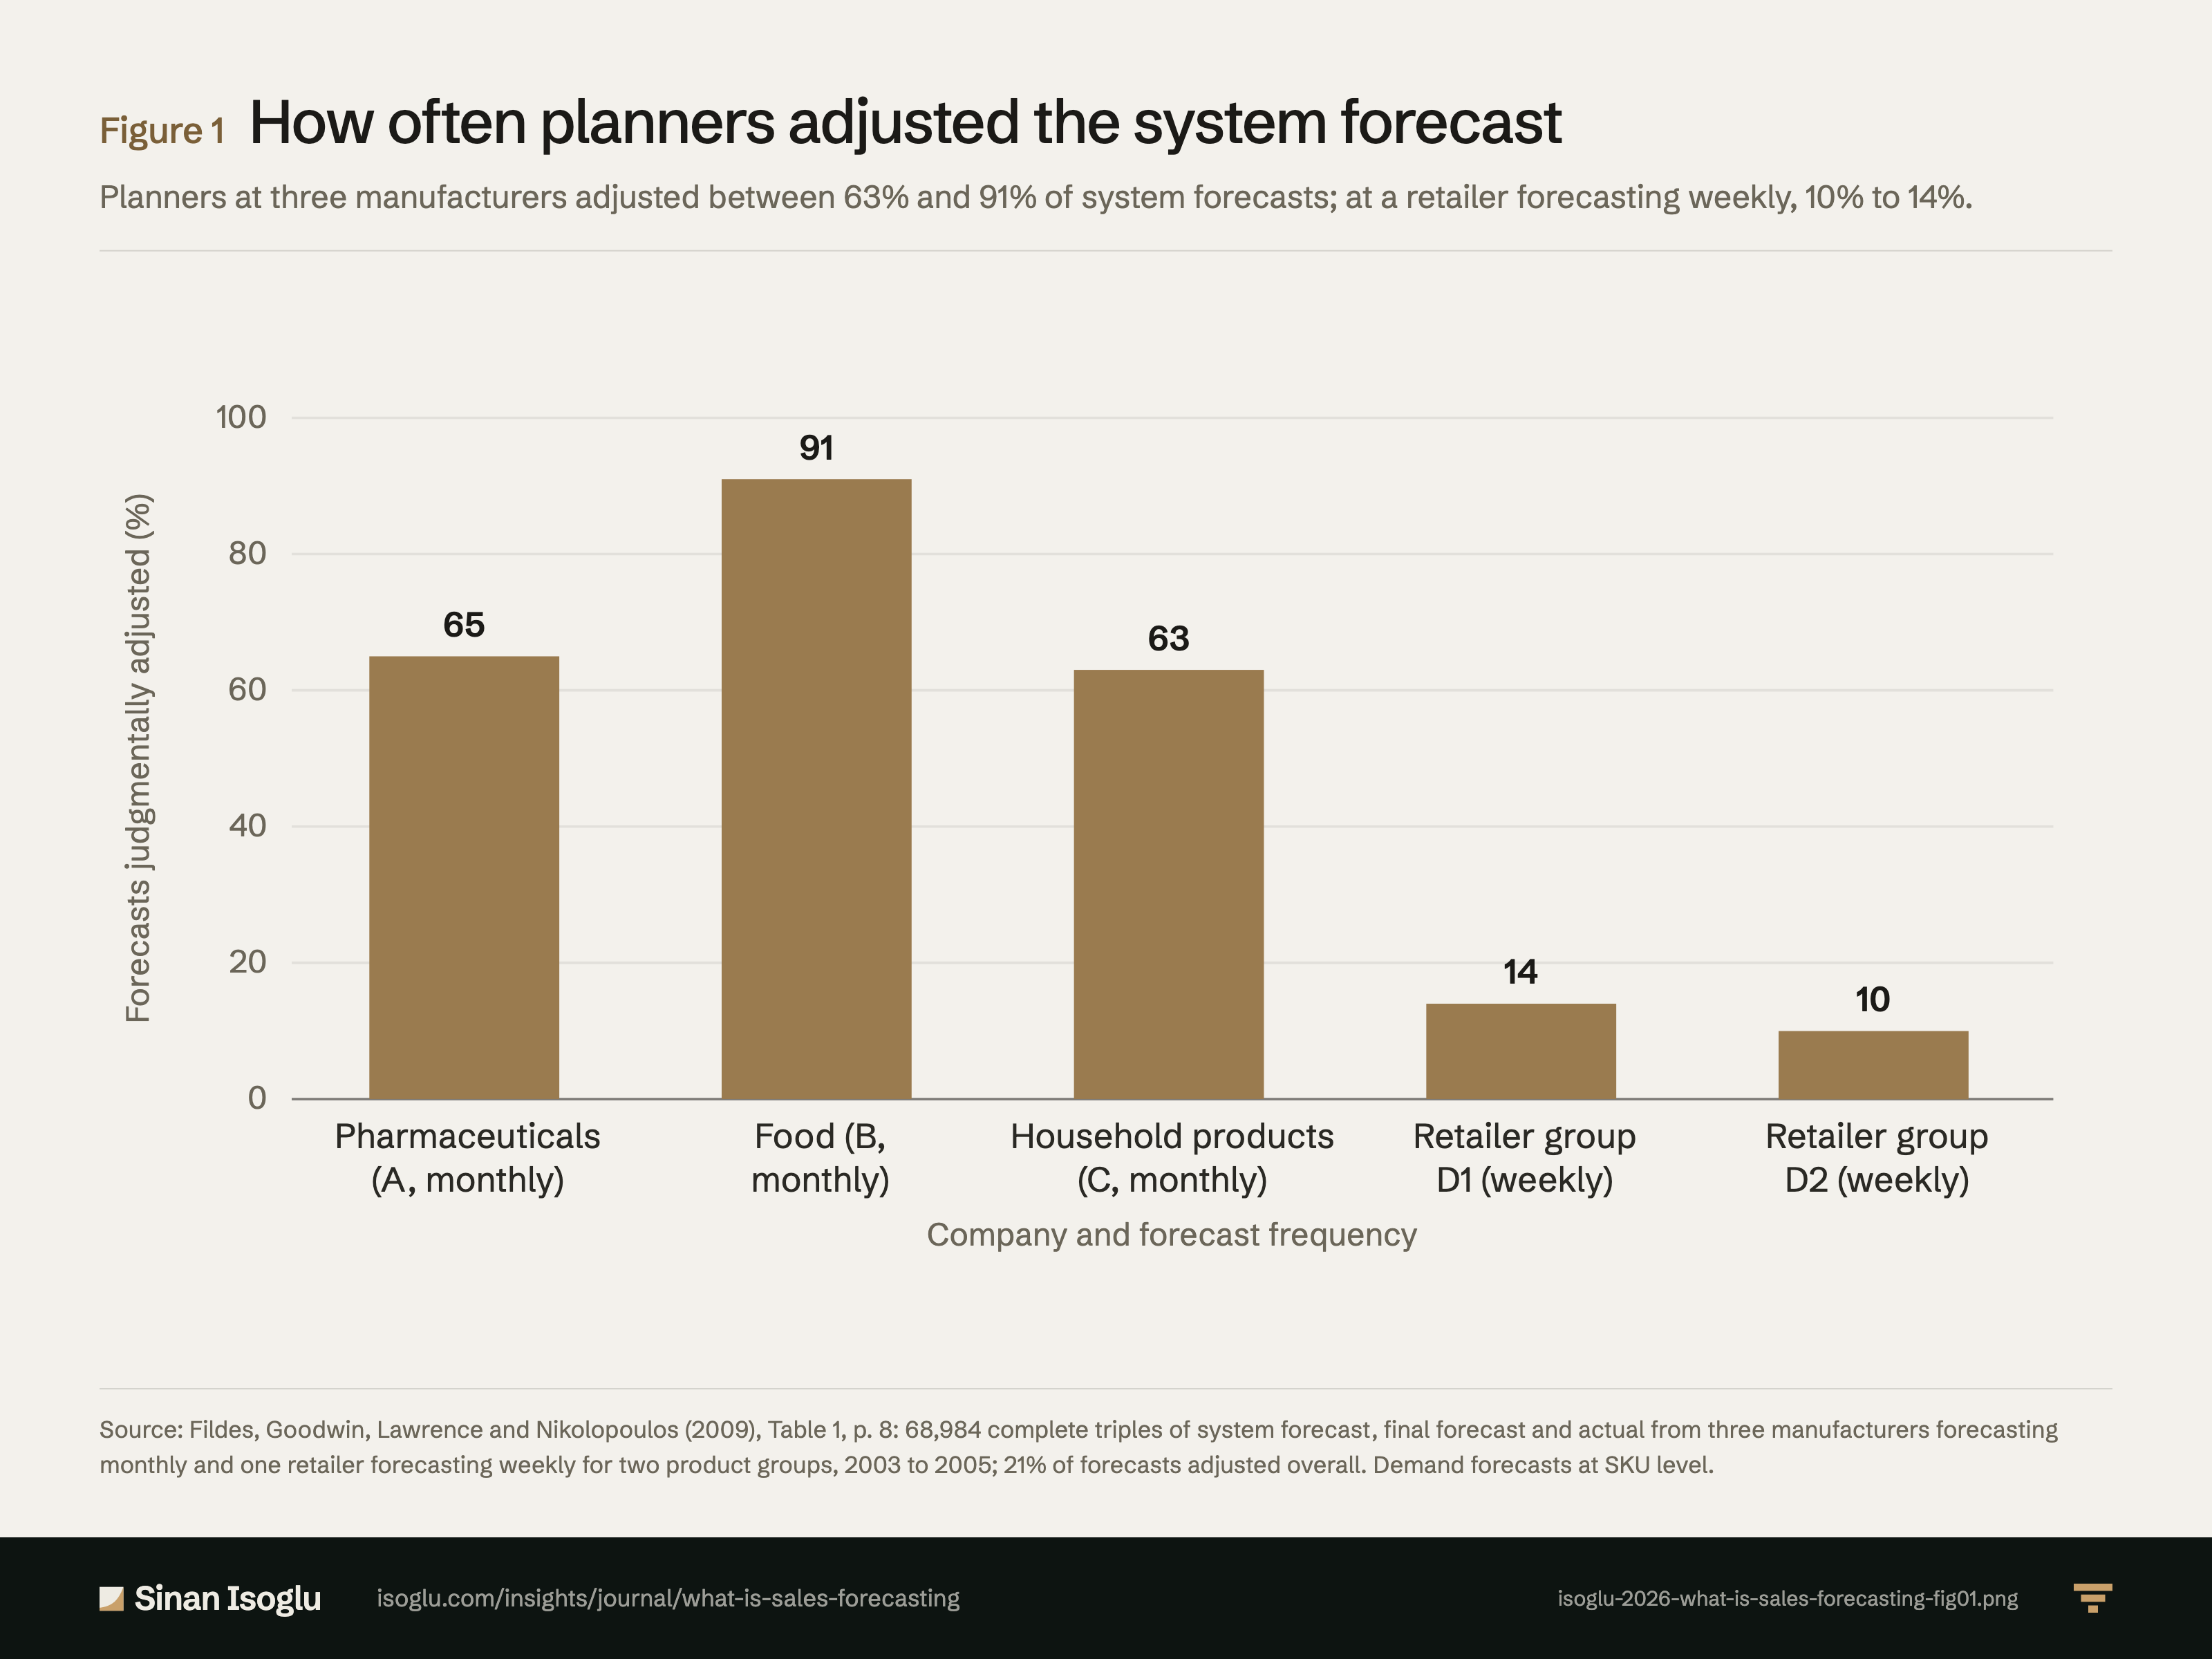
How often planners adjusted the system forecast

Planners at three manufacturers adjusted between 63% and 91% of system forecasts; at a retailer forecasting weekly, 10% to 14%.

Cite Embed

Figure 1How often planners adjusted the system forecast

Bar chart of the share of system forecasts that planners adjusted, from Fildes and colleagues 2009. Pharmaceuticals manufacturer A, monthly: 65 percent. Food manufacturer B, monthly: 91 percent. Household products manufacturer C, monthly: 63 percent. Retailer product group D1, weekly: 14 percent. Retailer product group D2, weekly: 10 percent.02040608010065Pharmaceuticals(A, monthly)91Food (B,monthly)63Household products(C, monthly)14Retailer groupD1 (weekly)10Retailer groupD2 (weekly)Company and forecast frequencyForecasts judgmentally adjusted (%)

Source: Fildes, Goodwin, Lawrence and Nikolopoulos (2009), Table 1, p. 8: 68,984 complete triples of system forecast, final forecast and actual from three manufacturers forecasting monthly and one retailer forecasting weekly for two product groups, 2003 to 2005; 21% of forecasts adjusted overall. Demand forecasts at SKU level.
PNG4:3, 1600 × 1200, with the title, the source line and the attribution set in the image isoglu-2026-what-is-sales-forecasting-fig01.png

Cite or embed

APA 7

Isoglu, S. (2026). How often planners adjusted the system forecast [Figure]. isoglu.com. https://isoglu.com/insights/exhibits/isoglu-2026-what-is-sales-forecasting-fig01/

BibTeX
@misc{isoglu-2026-what-is-sales-forecasting-fig01,
  author = {Isoglu, Sinan},
  title = {{How often planners adjusted the system forecast}},
  year = {2026},
  howpublished = {Figure 1, isoglu.com},
  url = {https://isoglu.com/insights/exhibits/isoglu-2026-what-is-sales-forecasting-fig01/},
  note = {From the essay {What is sales forecasting?}}
}
Embed this exhibit

Copy this HTML to use the PNG exhibit on your site with its source line and a link back to the exhibit page.

<figure>
  <a href="https://isoglu.com/insights/exhibits/isoglu-2026-what-is-sales-forecasting-fig01/">
    <img src="https://isoglu.com/social/isoglu-2026-what-is-sales-forecasting-fig01.png" alt="Figure 1: How often planners adjusted the system forecast" width="3200" height="2400">
  </a>
  <figcaption>Figure 1: How often planners adjusted the system forecast. Source: Fildes, Goodwin, Lawrence and Nikolopoulos (2009), Table 1, p. 8: 68,984 complete triples of system forecast, final forecast and actual from three manufacturers forecasting monthly and one retailer forecasting weekly for two product groups, 2003 to 2005; 21% of forecasts adjusted overall. Demand forecasts at SKU level. <a href="https://isoglu.com/insights/exhibits/isoglu-2026-what-is-sales-forecasting-fig01/">View exhibit</a>.</figcaption>
</figure>