← Every exhibit

Figure 3From “What is sales forecasting?”

A sales forecast record

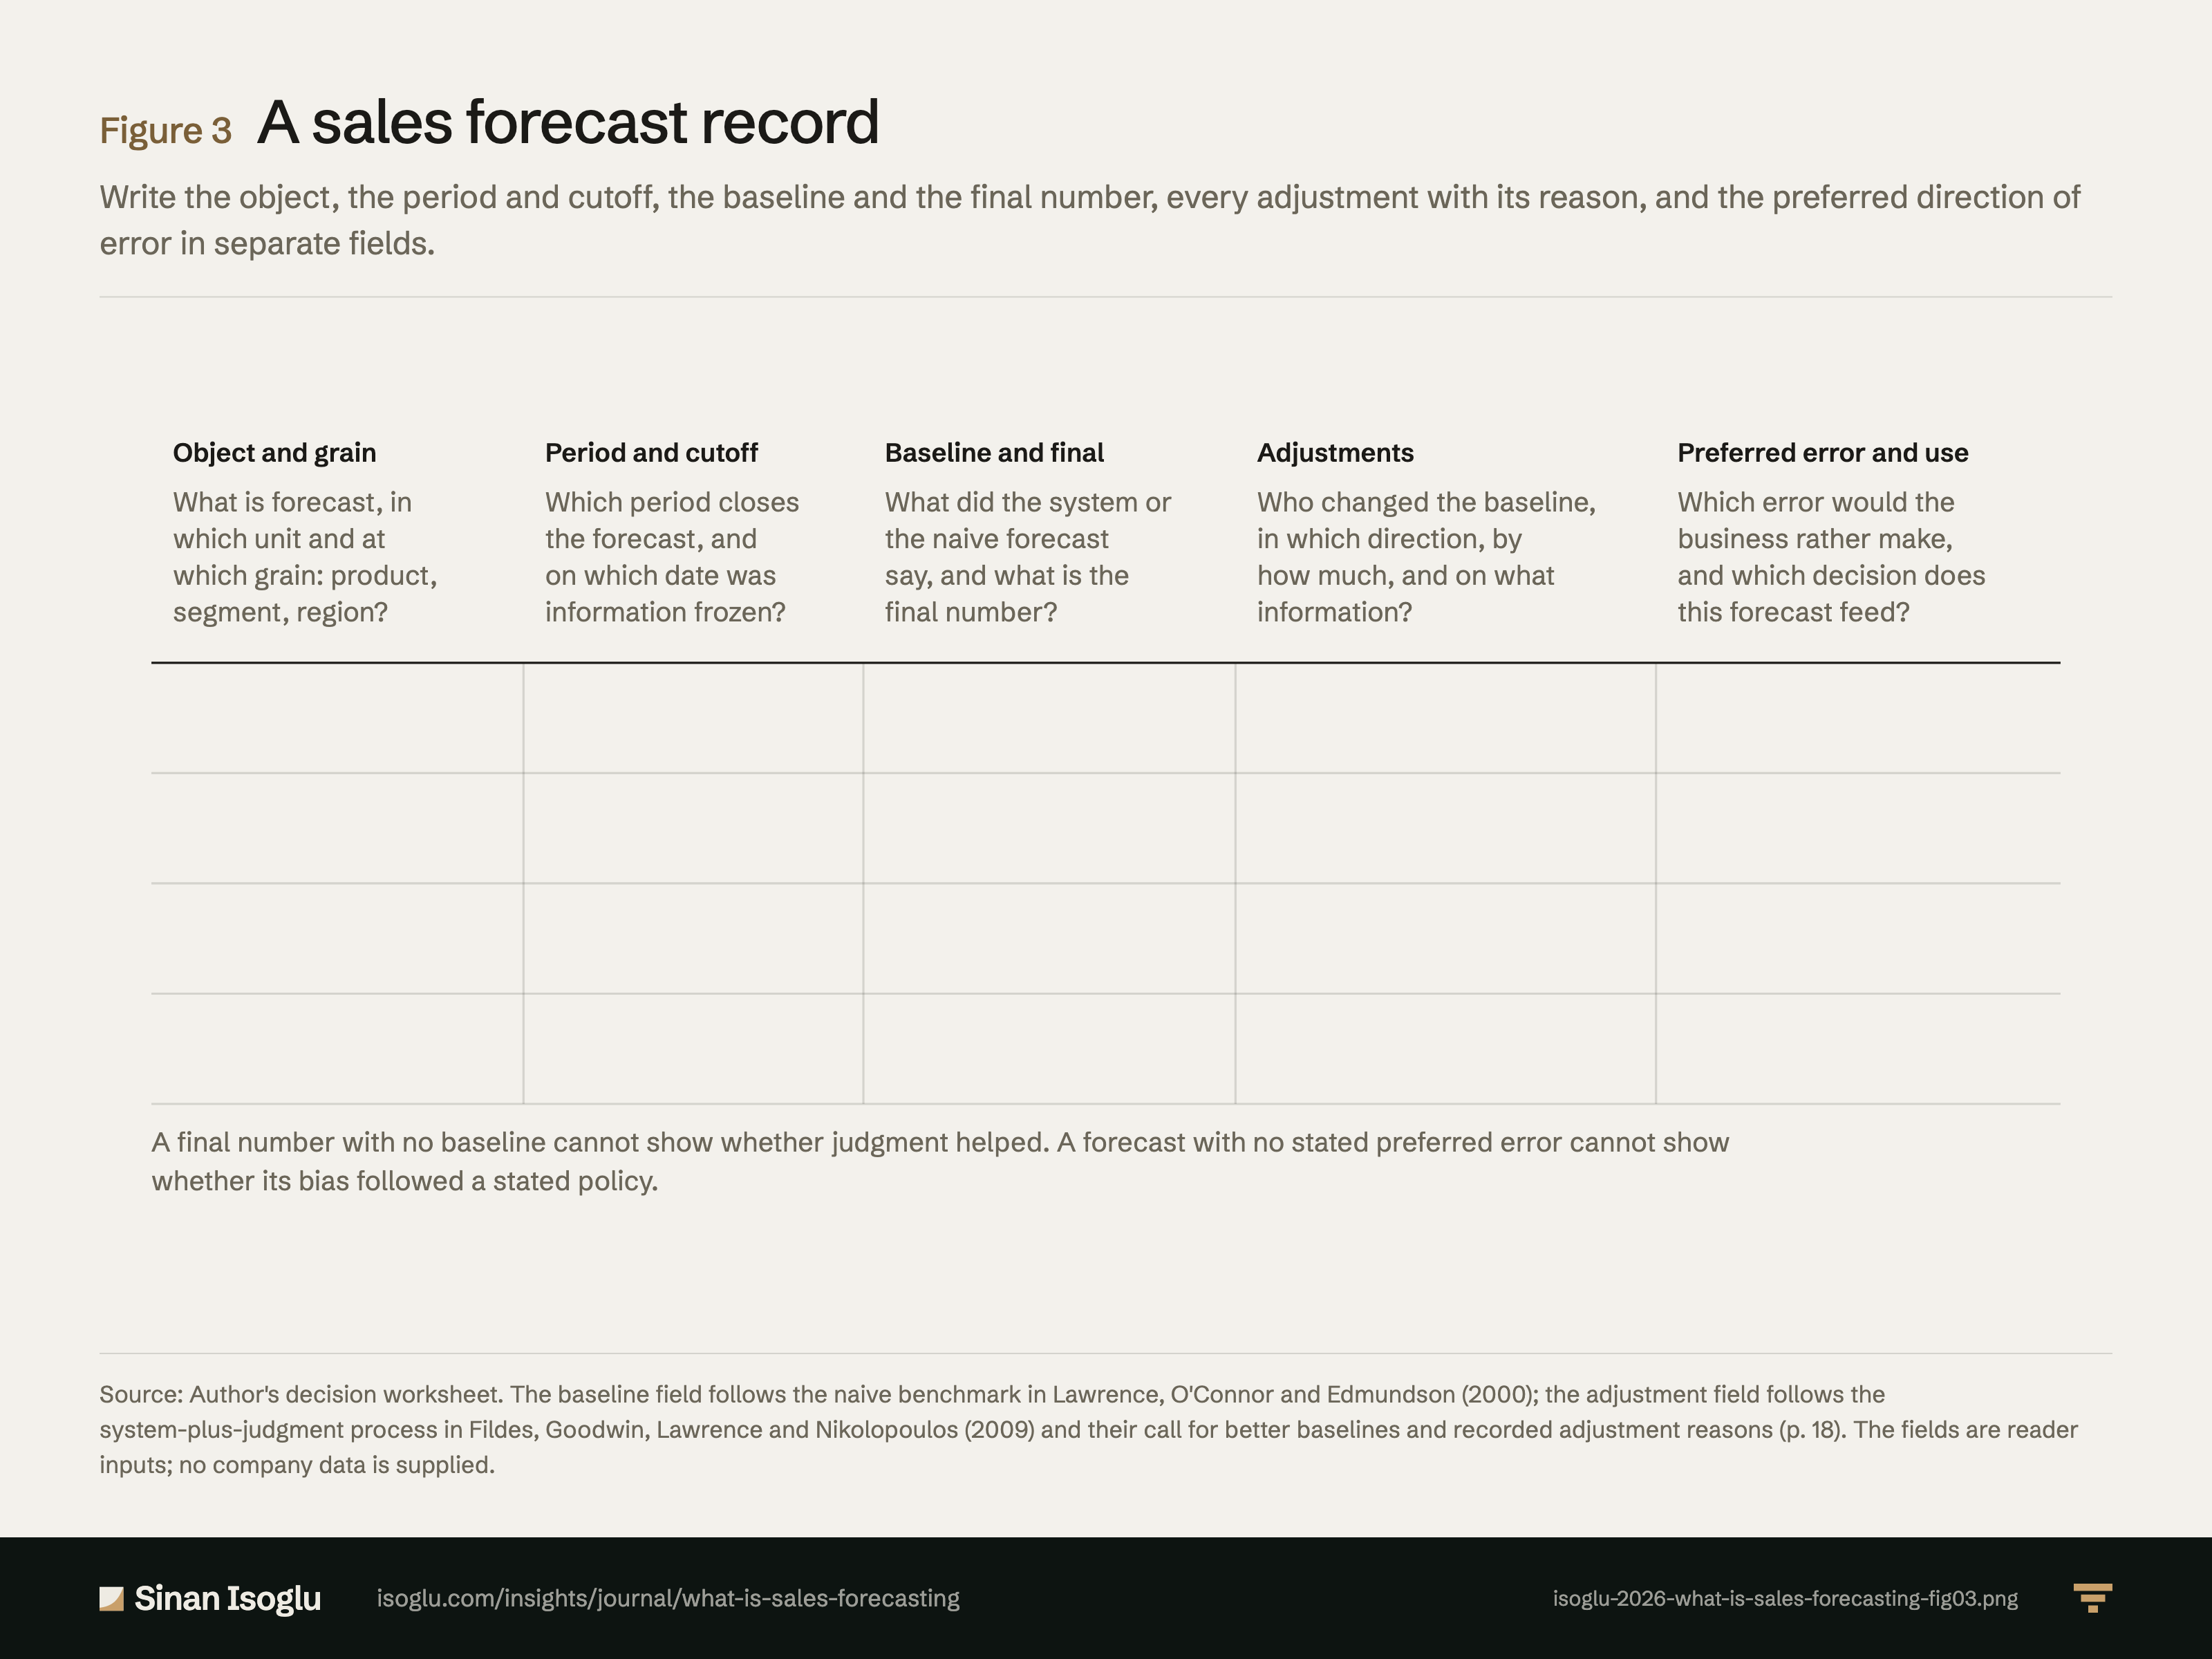
Write the object, the period and cutoff, the baseline and the final number, every adjustment with its reason, and the preferred direction of error in separate fields.

Cite Embed

Figure 3A sales forecast record

A five-column worksheet for recording a sales forecast: the object and grain, the period and information cutoff, the baseline and final forecast, each adjustment with who made it, its direction, size and reason, and the preferred direction of error with the decision the forecast feeds.Object and grainWhat is forecast, inwhich unit and atwhich grain: product,segment, region?Period and cutoffWhich period closesthe forecast, andon which date wasinformation frozen?Baseline and finalWhat did the system orthe naive forecastsay, and what is thefinal number?AdjustmentsWho changed the baseline,in which direction, byhow much, and on whatinformation?Preferred error and useWhich error would thebusiness rather make,and which decision doesthis forecast feed?A final number with no baseline cannot show whether judgment helped. A forecast with no stated preferred error cannot showwhether its bias followed a stated policy.

Source: Author's decision worksheet. The baseline field follows the naive benchmark in Lawrence, O'Connor and Edmundson (2000); the adjustment field follows the system-plus-judgment process in Fildes, Goodwin, Lawrence and Nikolopoulos (2009) and their call for better baselines and recorded adjustment reasons (p. 18). The fields are reader inputs; no company data is supplied.
PNG4:3, 1600 × 1200, with the title, the source line and the attribution set in the image isoglu-2026-what-is-sales-forecasting-fig03.png

Cite or embed

APA 7

Isoglu, S. (2026). A sales forecast record [Figure]. isoglu.com. https://isoglu.com/insights/exhibits/isoglu-2026-what-is-sales-forecasting-fig03/

BibTeX
@misc{isoglu-2026-what-is-sales-forecasting-fig03,
  author = {Isoglu, Sinan},
  title = {{A sales forecast record}},
  year = {2026},
  howpublished = {Figure 3, isoglu.com},
  url = {https://isoglu.com/insights/exhibits/isoglu-2026-what-is-sales-forecasting-fig03/},
  note = {From the essay {What is sales forecasting?}}
}
Embed this exhibit

Copy this HTML to use the PNG exhibit on your site with its source line and a link back to the exhibit page.

<figure>
  <a href="https://isoglu.com/insights/exhibits/isoglu-2026-what-is-sales-forecasting-fig03/">
    <img src="https://isoglu.com/social/isoglu-2026-what-is-sales-forecasting-fig03.png" alt="Figure 3: A sales forecast record" width="3200" height="2400">
  </a>
  <figcaption>Figure 3: A sales forecast record. Source: Author&#39;s decision worksheet. The baseline field follows the naive benchmark in Lawrence, O&#39;Connor and Edmundson (2000); the adjustment field follows the system-plus-judgment process in Fildes, Goodwin, Lawrence and Nikolopoulos (2009) and their call for better baselines and recorded adjustment reasons (p. 18). The fields are reader inputs; no company data is supplied. <a href="https://isoglu.com/insights/exhibits/isoglu-2026-what-is-sales-forecasting-fig03/">View exhibit</a>.</figcaption>
</figure>