Figure 2From “What is sales forecasting?”
Five numbers, five questions
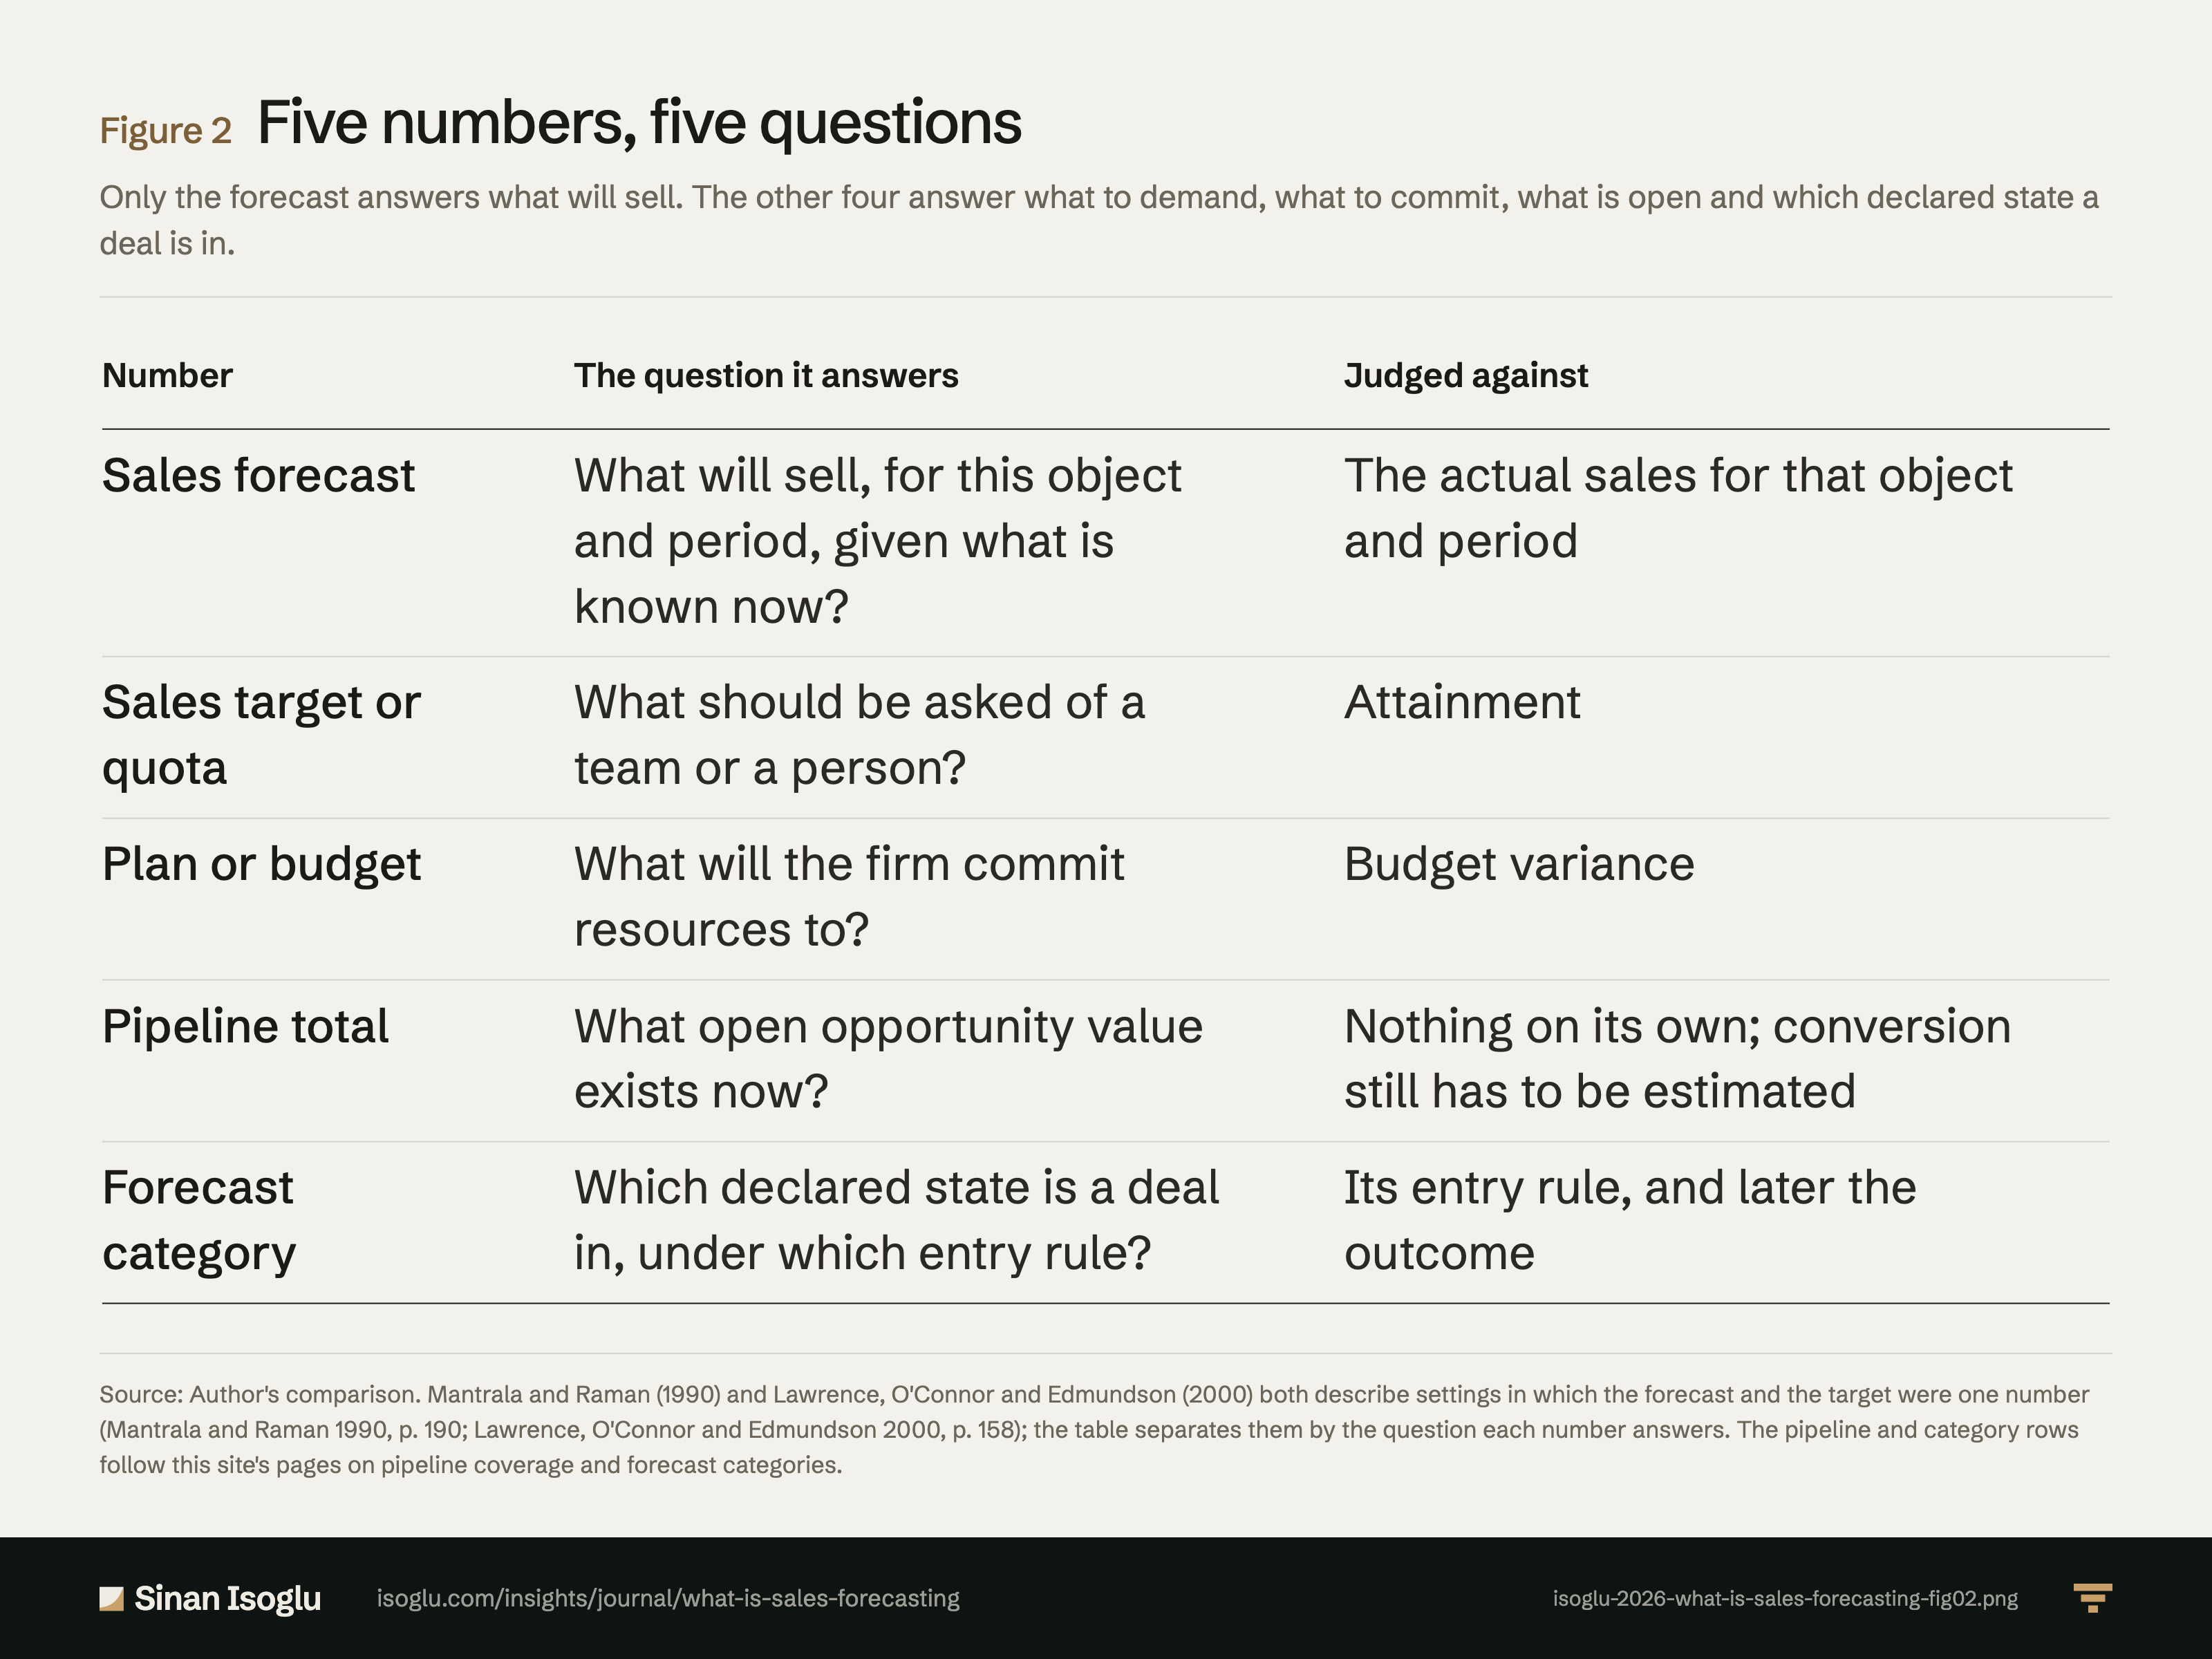
Only the forecast answers what will sell. The other four answer what to demand, what to commit, what is open and which declared state a deal is in.
Figure 2Five numbers, five questions
| Number | The question it answers | Judged against |
|---|---|---|
| Sales forecast | What will sell, for this object and period, given what is known now? | The actual sales for that object and period |
| Sales target or quota | What should be asked of a team or a person? | Attainment |
| Plan or budget | What will the firm commit resources to? | Budget variance |
| Pipeline total | What open opportunity value exists now? | Nothing on its own; conversion still has to be estimated |
| Forecast category | Which declared state is a deal in, under which entry rule? | Its entry rule, and later the outcome |
Swipe or scroll horizontally if the table is wider than your screen.
Source: Author's comparison. Mantrala and Raman (1990) and Lawrence, O'Connor and Edmundson (2000) both describe settings in which the forecast and the target were one number (Mantrala and Raman 1990, p. 190; Lawrence, O'Connor and Edmundson 2000, p. 158); the table separates them by the question each number answers. The pipeline and category rows follow this site's pages on pipeline coverage and forecast categories.
From the essay
Revenue operations & AI
What is sales forecasting?
Sales forecasting estimates what will sell, for a named unit and period, before the actual is known. It is not the target, and it needs a baseline.
Read the essayThis exhibit belongs to an essay: the numbers live here, the argument lives there.
Cite or embed
Contact
Bring the question you're working on.
Research, a guest lecture, or a commercial question.