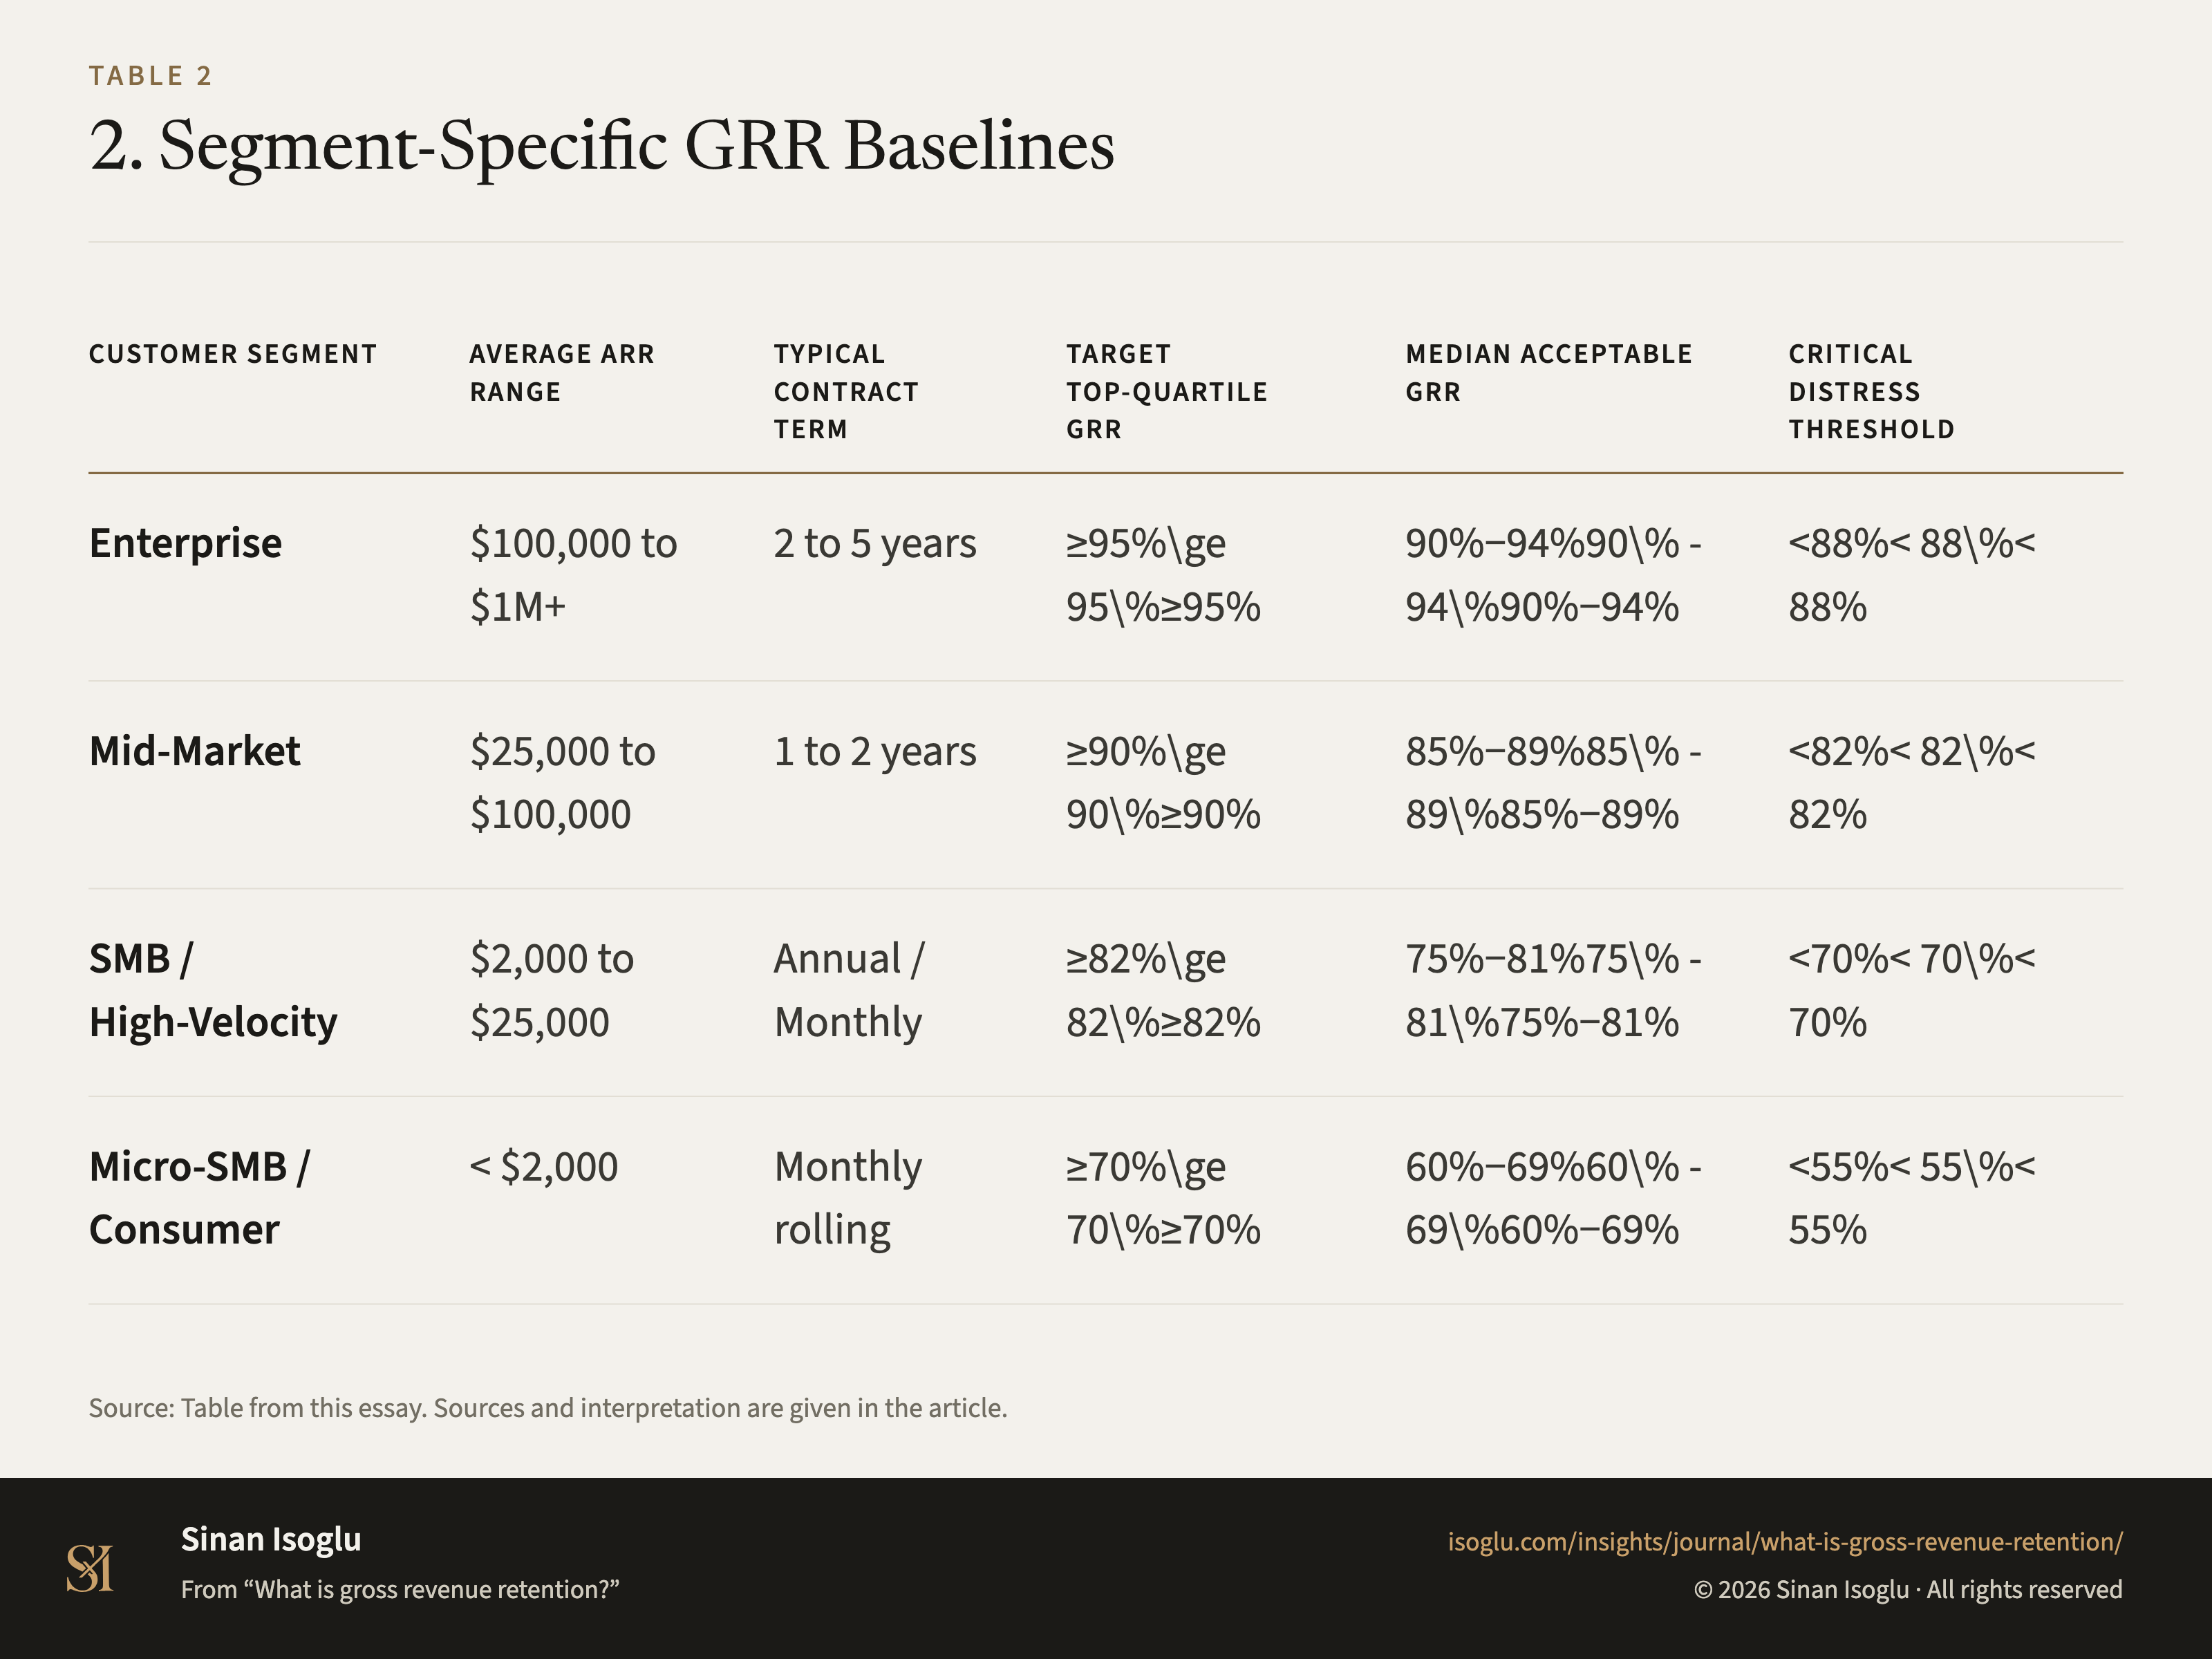
Table 12. Segment-Specific GRR Baselines
| Customer segment | Average ARR range | Typical contract term | Target top-quartile GRR | Median acceptable GRR | Critical distress threshold |
|---|---|---|---|---|---|
| Enterprise | \$100,000 to \$1M+ | 2 to 5 years | $\ge 95\%$ | $90\% - 94\%$ | $< 88\%$ |
| Mid-Market | \$25,000 to \$100,000 | 1 to 2 years | $\ge 90\%$ | $85\% - 89\%$ | $< 82\%$ |
| SMB / High-Velocity | \$2,000 to \$25,000 | Annual / Monthly | $\ge 82\%$ | $75\% - 81\%$ | $< 70\%$ |
| Micro-SMB / Consumer | < \$2,000 | Monthly rolling | $\ge 70\%$ | $60\% - 69\%$ | $< 55\%$ |
Swipe or scroll horizontally if the table is wider than your screen.
Source: Table from this essay. Sources and interpretation are given in the article.
PNG4:3, 1600 × 1200, with the title, the source line and the attribution set in the image isoglu-2026-what-is-gross-revenue-retention-fig03.png
From the essay
Growth that compounds
What is gross revenue retention?
Gross revenue retention measures preserved recurring revenue without expansion. Isolate contraction and churn before expansion masks cohort decay.
Read the essayThis exhibit belongs to an essay: the numbers live here, the argument lives there.
Cite or embed
Related exhibits
Contact
Bring the question you're working on.
Research, a guest lecture, or a commercial question.