Abbildung 1Aus „Was ist CUPED?“
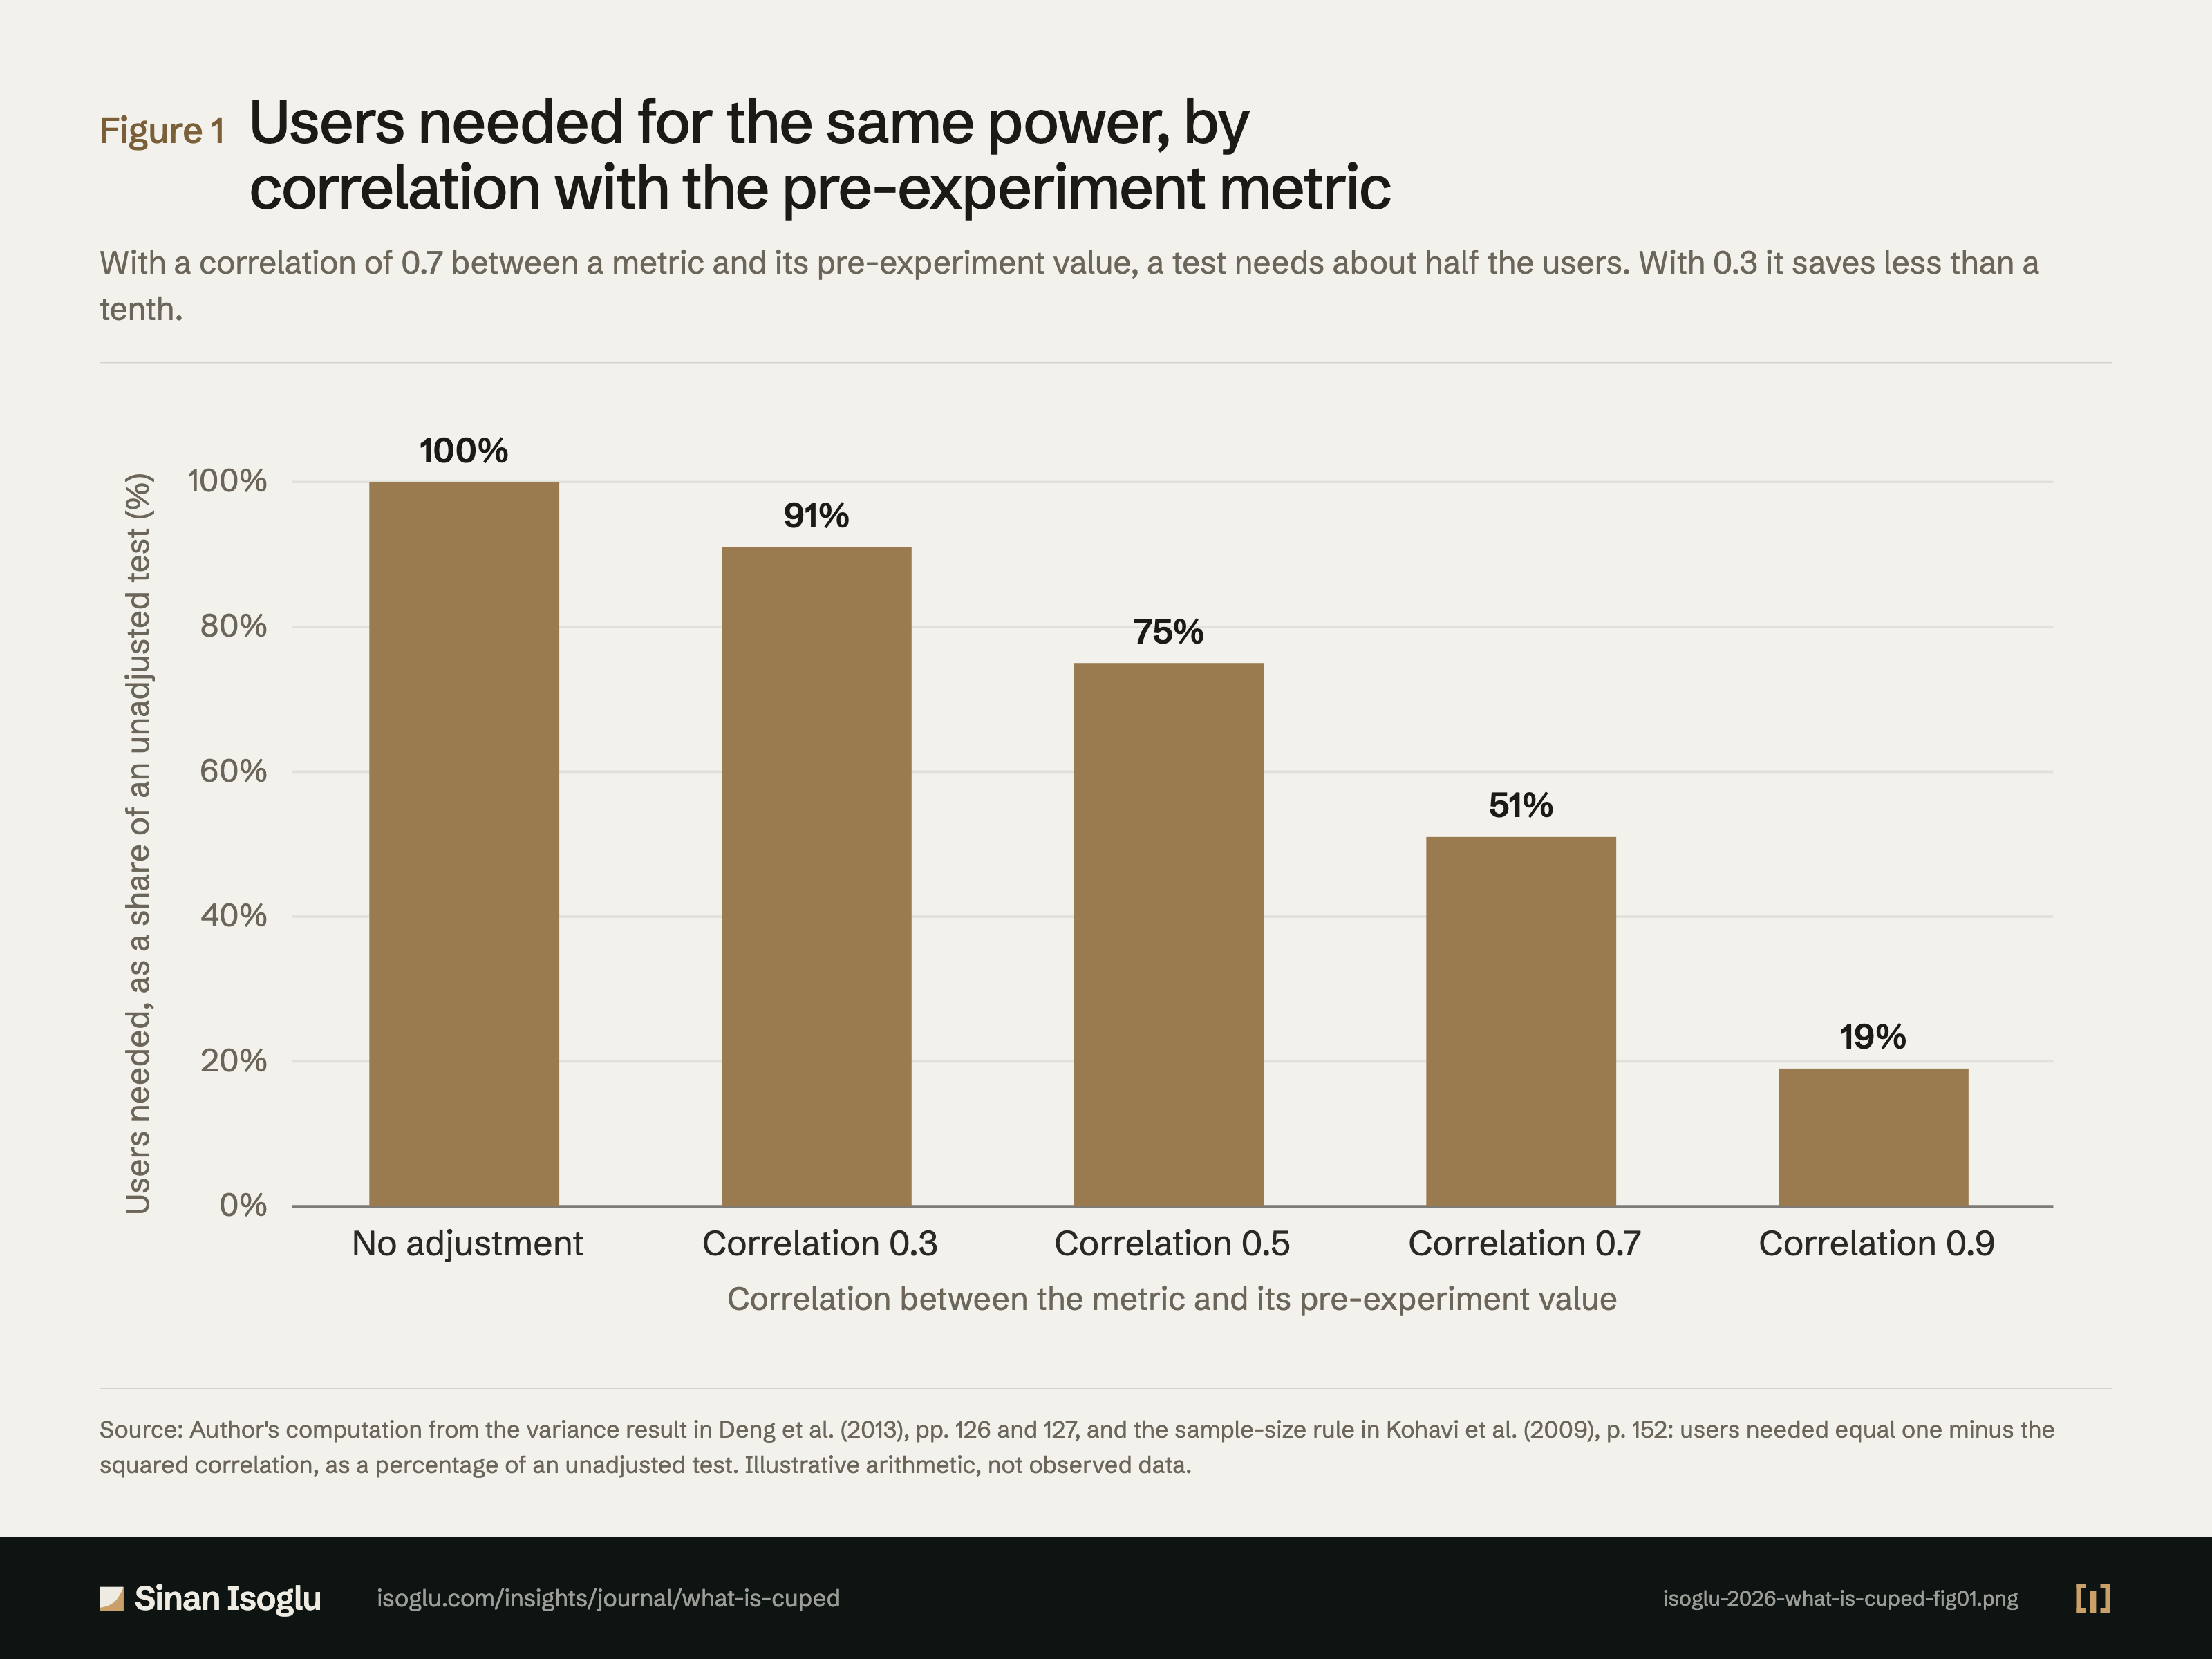
Nötige Nutzer für dieselbe Teststärke, nach Korrelation mit der Kennzahl der Vorperiode
Bei einer Korrelation von 0,7 zwischen einer Kennzahl und ihrem Wert aus der Vorperiode braucht ein Test etwa die Hälfte der Nutzer. Bei 0,3 spart er weniger als ein Zehntel.
Abbildung 1Nötige Nutzer für dieselbe Teststärke, nach Korrelation mit der Kennzahl der Vorperiode
Quelle: Rechnung des Autors aus dem Varianzergebnis bei Deng et al. (2013), S. 126 und 127, und der Faustregel zur Stichprobengröße bei Kohavi et al. (2009), S. 152: Die nötigen Nutzer entsprechen eins minus dem Quadrat der Korrelation, in Prozent eines unbereinigten Tests. Veranschaulichende Rechnung, keine beobachteten Daten.
Quelle und Evidenz
Jede Zeile nennt eine Aussage zu dieser Abbildung, ihre Quelle und die Art ihrer Prüfung.
- A DXKW13-C3 With control variates the variance of the delta falls by the squared correlation between metric and covariate; the optimal coefficient is the OLS slope; a covariate built only from pre-experiment information has equal expectation in both groups by randomization; the same metric in the pre-period is the natural covariate; one coefficient serves both groups; stratification is the categorical special case; unlike a linear model the argument needs no model of the outcome (pp. 125 to 127): "The larger ρ, the better the variance reduction"; "turns out to be the ordinary least square (OLS) solution of regressing (centered) Y on (centered) X"; "By using only information from before the launch of the experiment to construct the control variate, the randomization between treatment and control ensures"; "an obvious approach is to choose X to be the same as Y, which naturally leads to using the same variable during pre-experiment observation window as the control variate"; "the same θ has to be used for both control and treatment"; "when the covariate X is categorical (say, with discrete values 1, . . . , K) the two approaches produce identical estimates"; "To achieve a large correlation and hence better variance reduction, an obvious approach is to choose X to be the same as Y"; "makes strong assumptions that are usually not satisfied in practice"Deng, Xu, Kohavi & Walker (2013) · Deng, Xu, Kohavi & Walker. (2013)
- A KLSH09-C5 The standard error of a mean falls with the square root of the sample size; the minimum sample size for 95% confidence and 80% power grows with the variance and falls with the square of the detectable change; in a shop with 5% buyers a 5% revenue change needs over 409,000 users and a 5% conversion change under 122,000; lower-variability metrics and filtering unexposed users raise sensitivity; an A/A test checks variability and the system (pp. 151 to 153): "the Std-Err of a mean is inversely proportional to the square root of the sample size"; "A second formula is a calculation for the minimum sample size, assuming the desired confidence level is 95% and the desired power is 80%"; "you will need over 409,000 users to achieve the desired 80% power"; "you will need less than 122,000 users to achieve the desired power"; "Use OEC components that have inherently lower variability"; "Lower the variability of the OEC by filtering out users who were not exposed to the variants"Kohavi, Longbotham, Sommerfield & Henne (2009)
- B CUPED-OWN-C2 Figure 1: users needed for the same power equal one minus the squared correlation as a share of an unadjusted test (100, 91, 75, 51 and 19 per cent for correlations 0, 0.3, 0.5, 0.7 and 0.9); illustrative arithmetic, not data.Author computation from DXKW13-C3 and KLSH09-C5
Prüfgrade: A, gegen die gedruckte Seite der Primärquelle geprüft · B, Primärquelle, nur Textebene · C, belastbare Sekundärquelle · D, berichtet.
Aus dem Beitrag
Aus der Forschung
Was ist CUPED?
CUPED bereinigt eine A/B-Test-Kennzahl mit ihrem Wert vor dem Test. Das senkt Rauschen, nicht Verzerrung, und verlangt eine vom Test unberührte Kovariate.
Den Beitrag lesenDiese Abbildung gehört zu einem Essay: Die Zahlen stehen hier, das Argument dort.
Zitieren oder einbetten
Verwandte Abbildungen
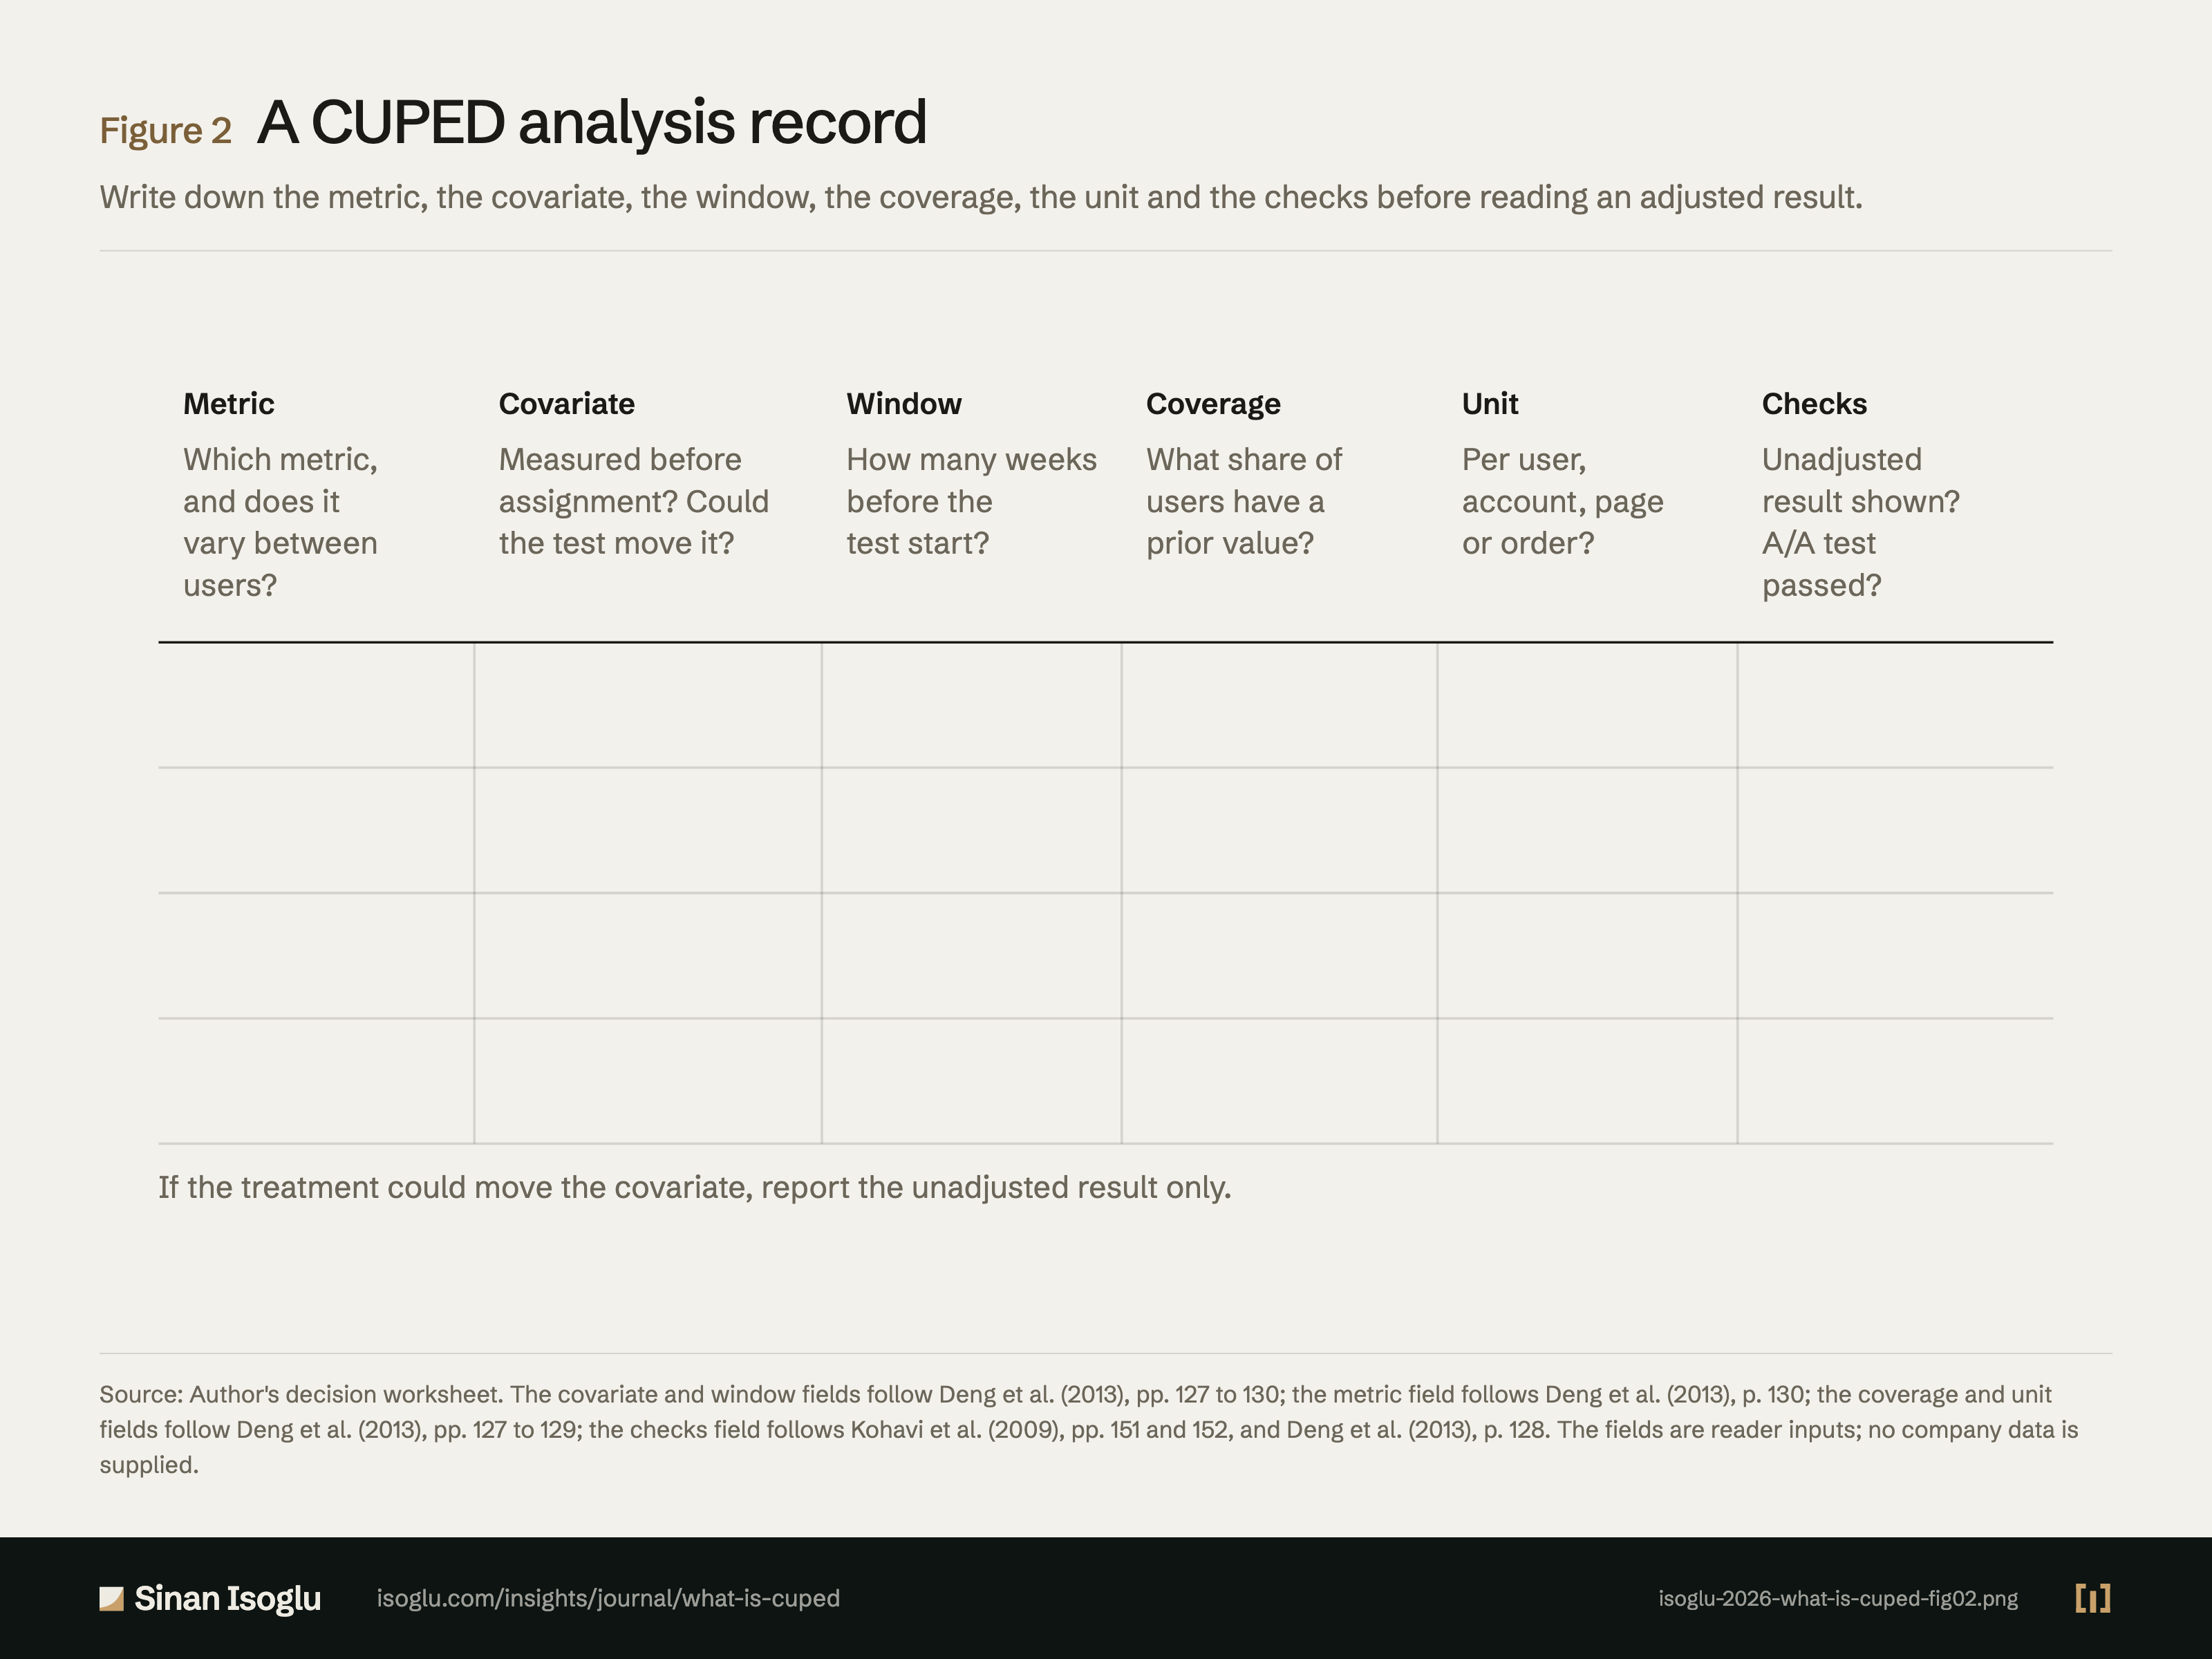
Abbildung 2Grafik
Ein Blatt für eine CUPED-Auswertung
Was ist CUPED?
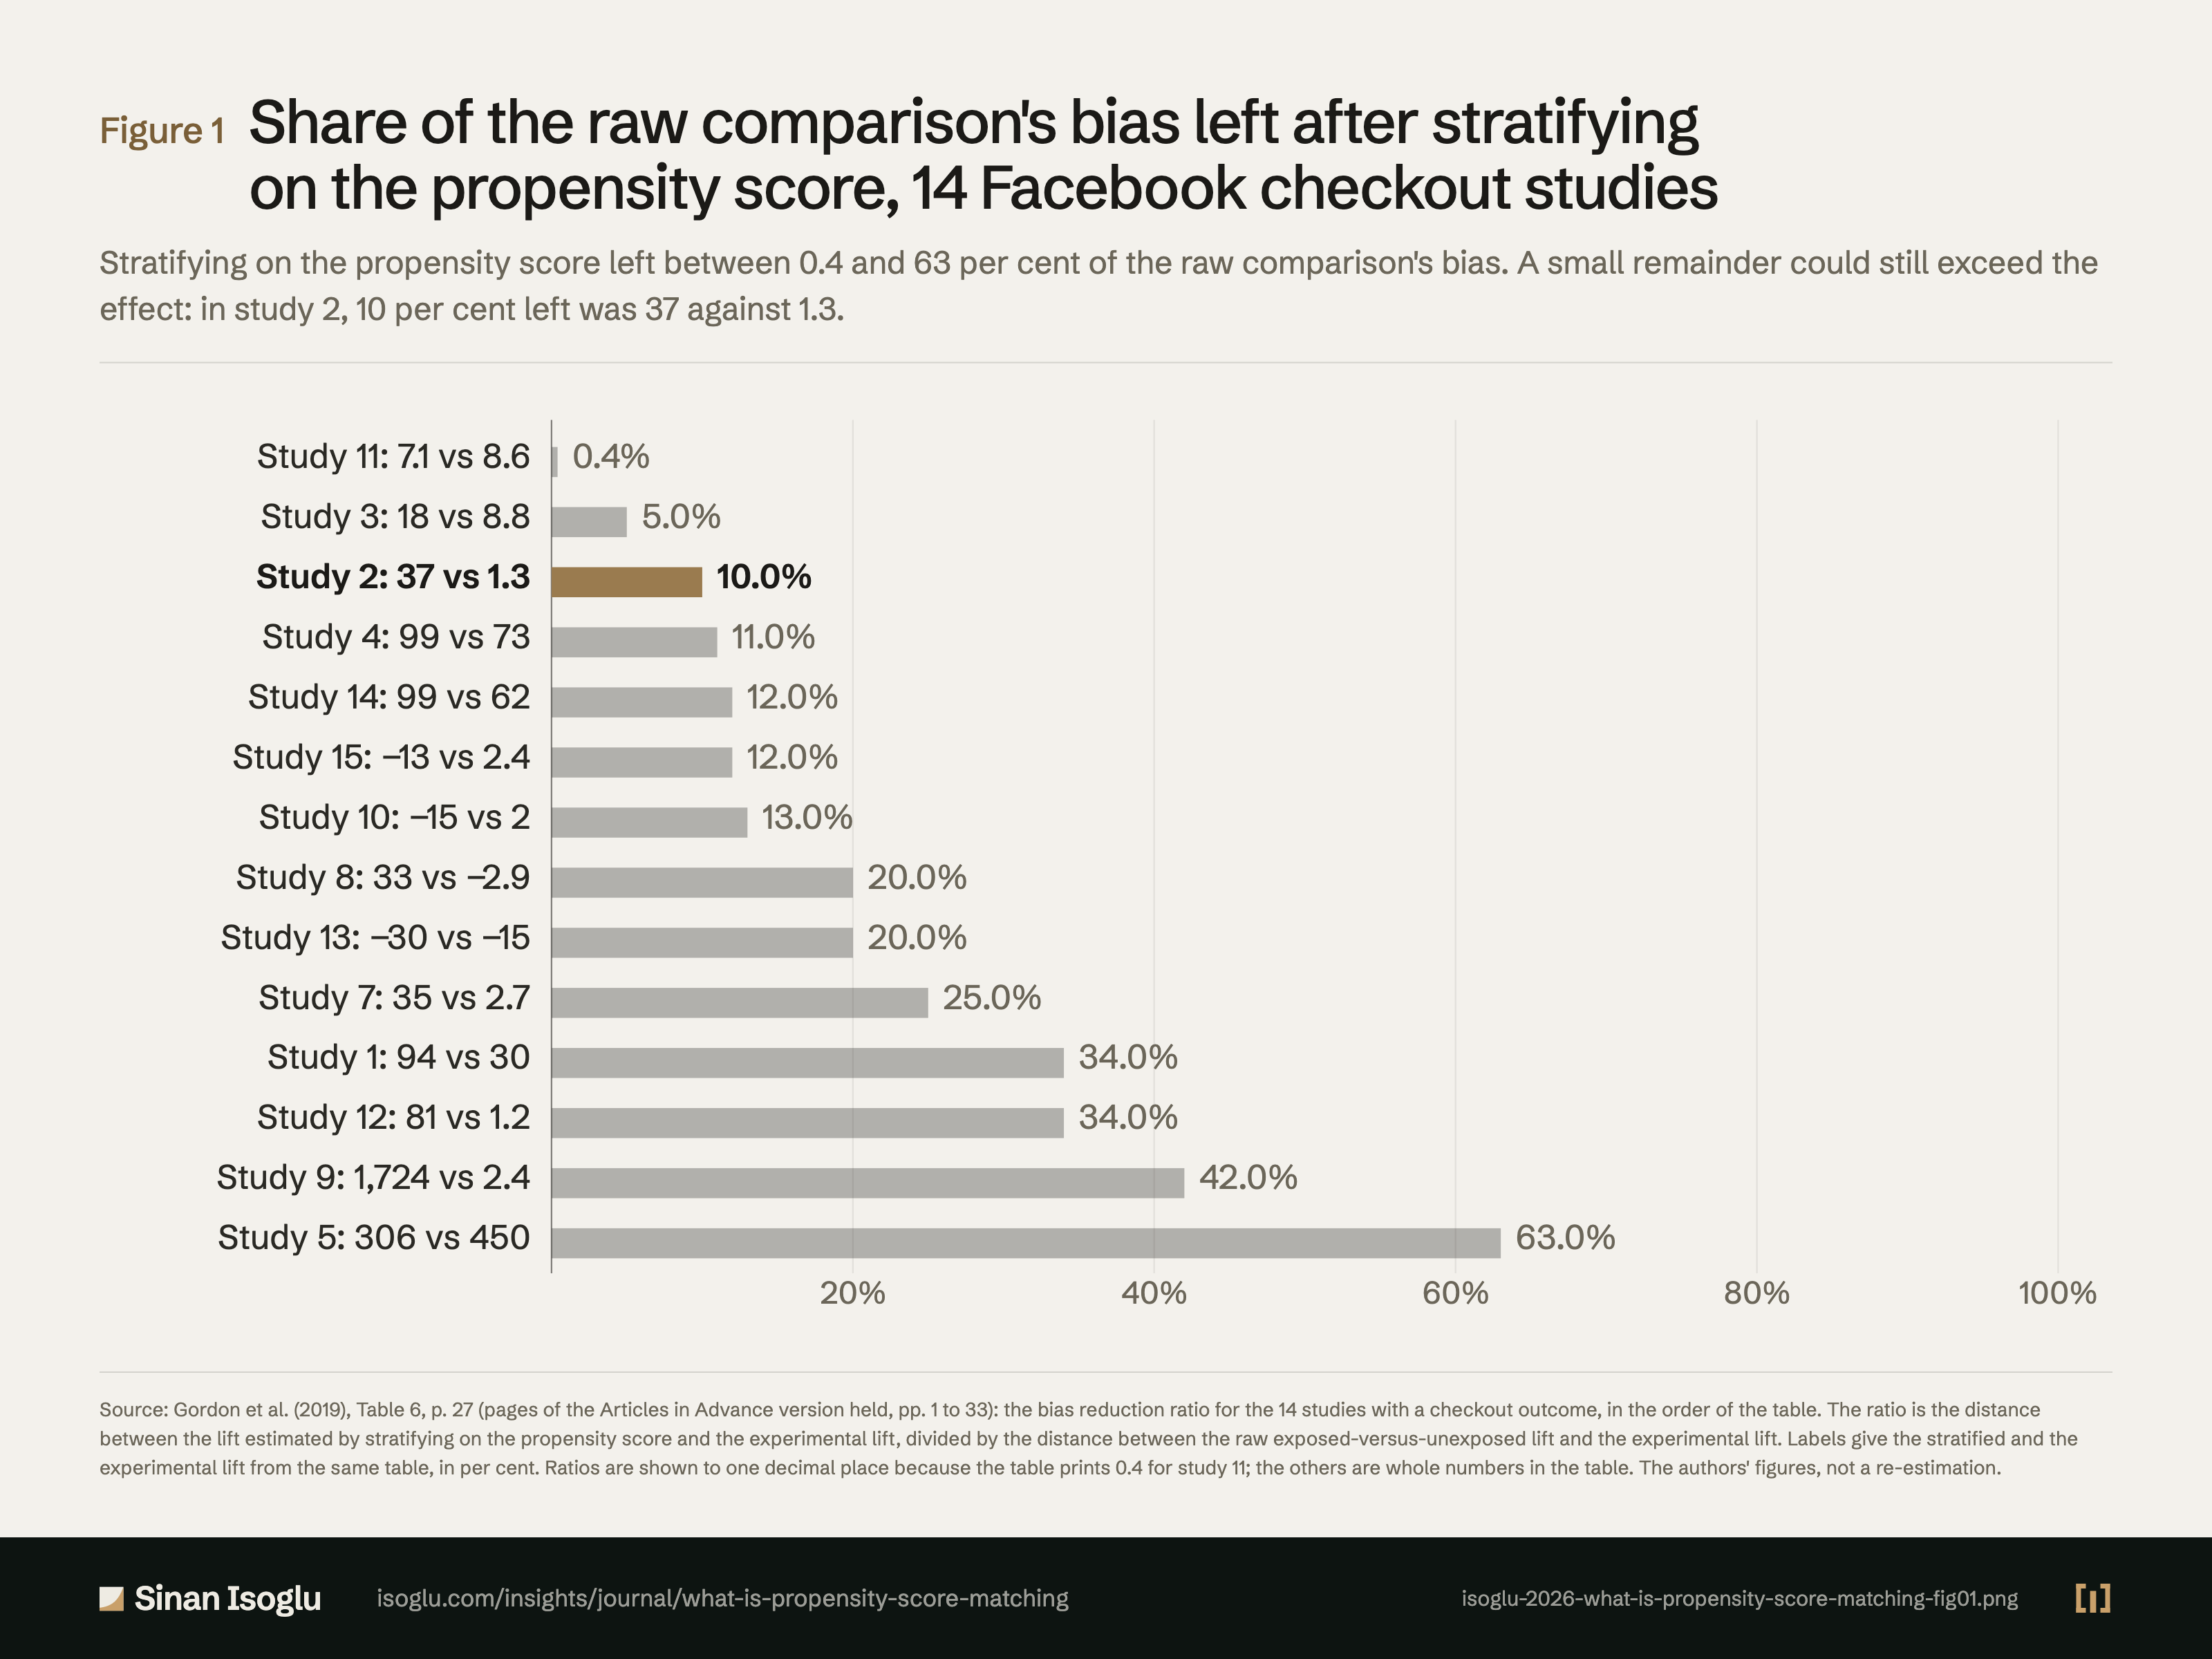
Abbildung 1Grafik
Anteil der Verzerrung des rohen Vergleichs nach der Stratifizierung auf dem Propensity Score, 14 Facebook-Studien mit Kauf als Conversion
Was ist Propensity-Score-Matching?
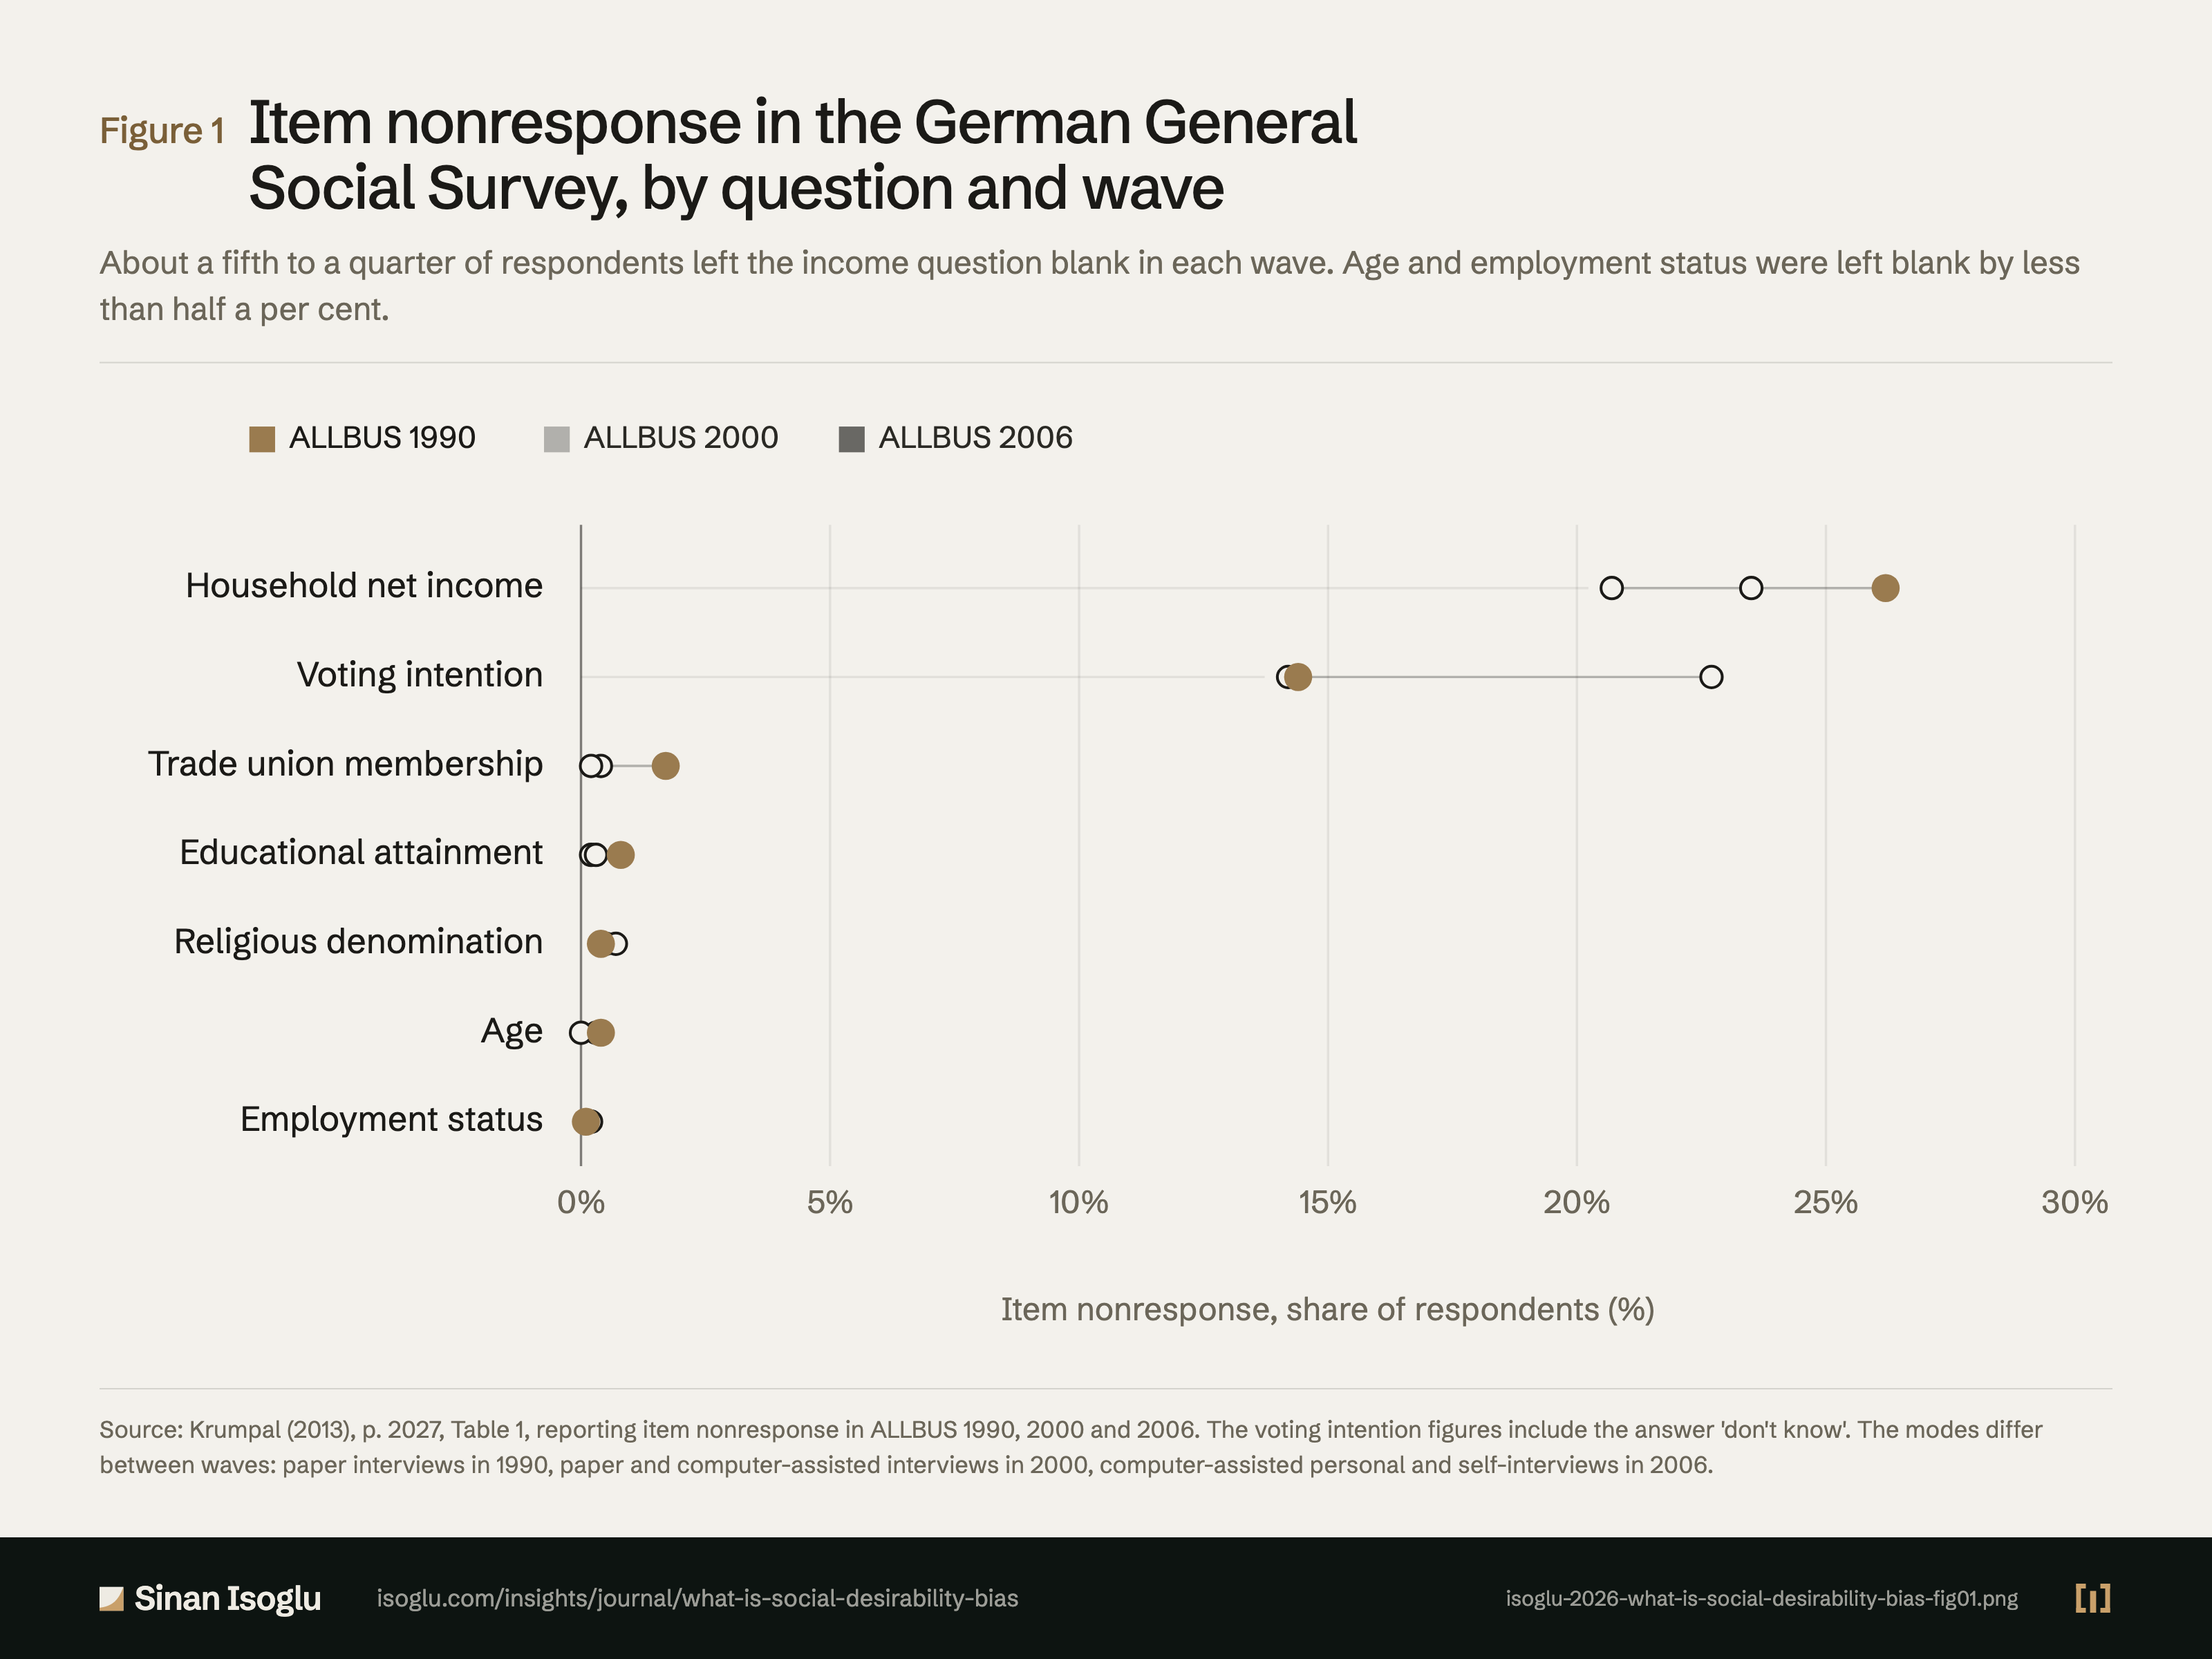
Abbildung 1Grafik
Fehlende Antworten im ALLBUS, nach Frage und Welle
Was ist soziale Erwünschtheit?
Kontakt
Schicken Sie die Frage, an der Sie arbeiten.
Forschung, ein Gastvortrag oder eine Frage aus der Praxis.