← Every exhibit

Figure 2From “What is CUPED?”

A CUPED analysis record

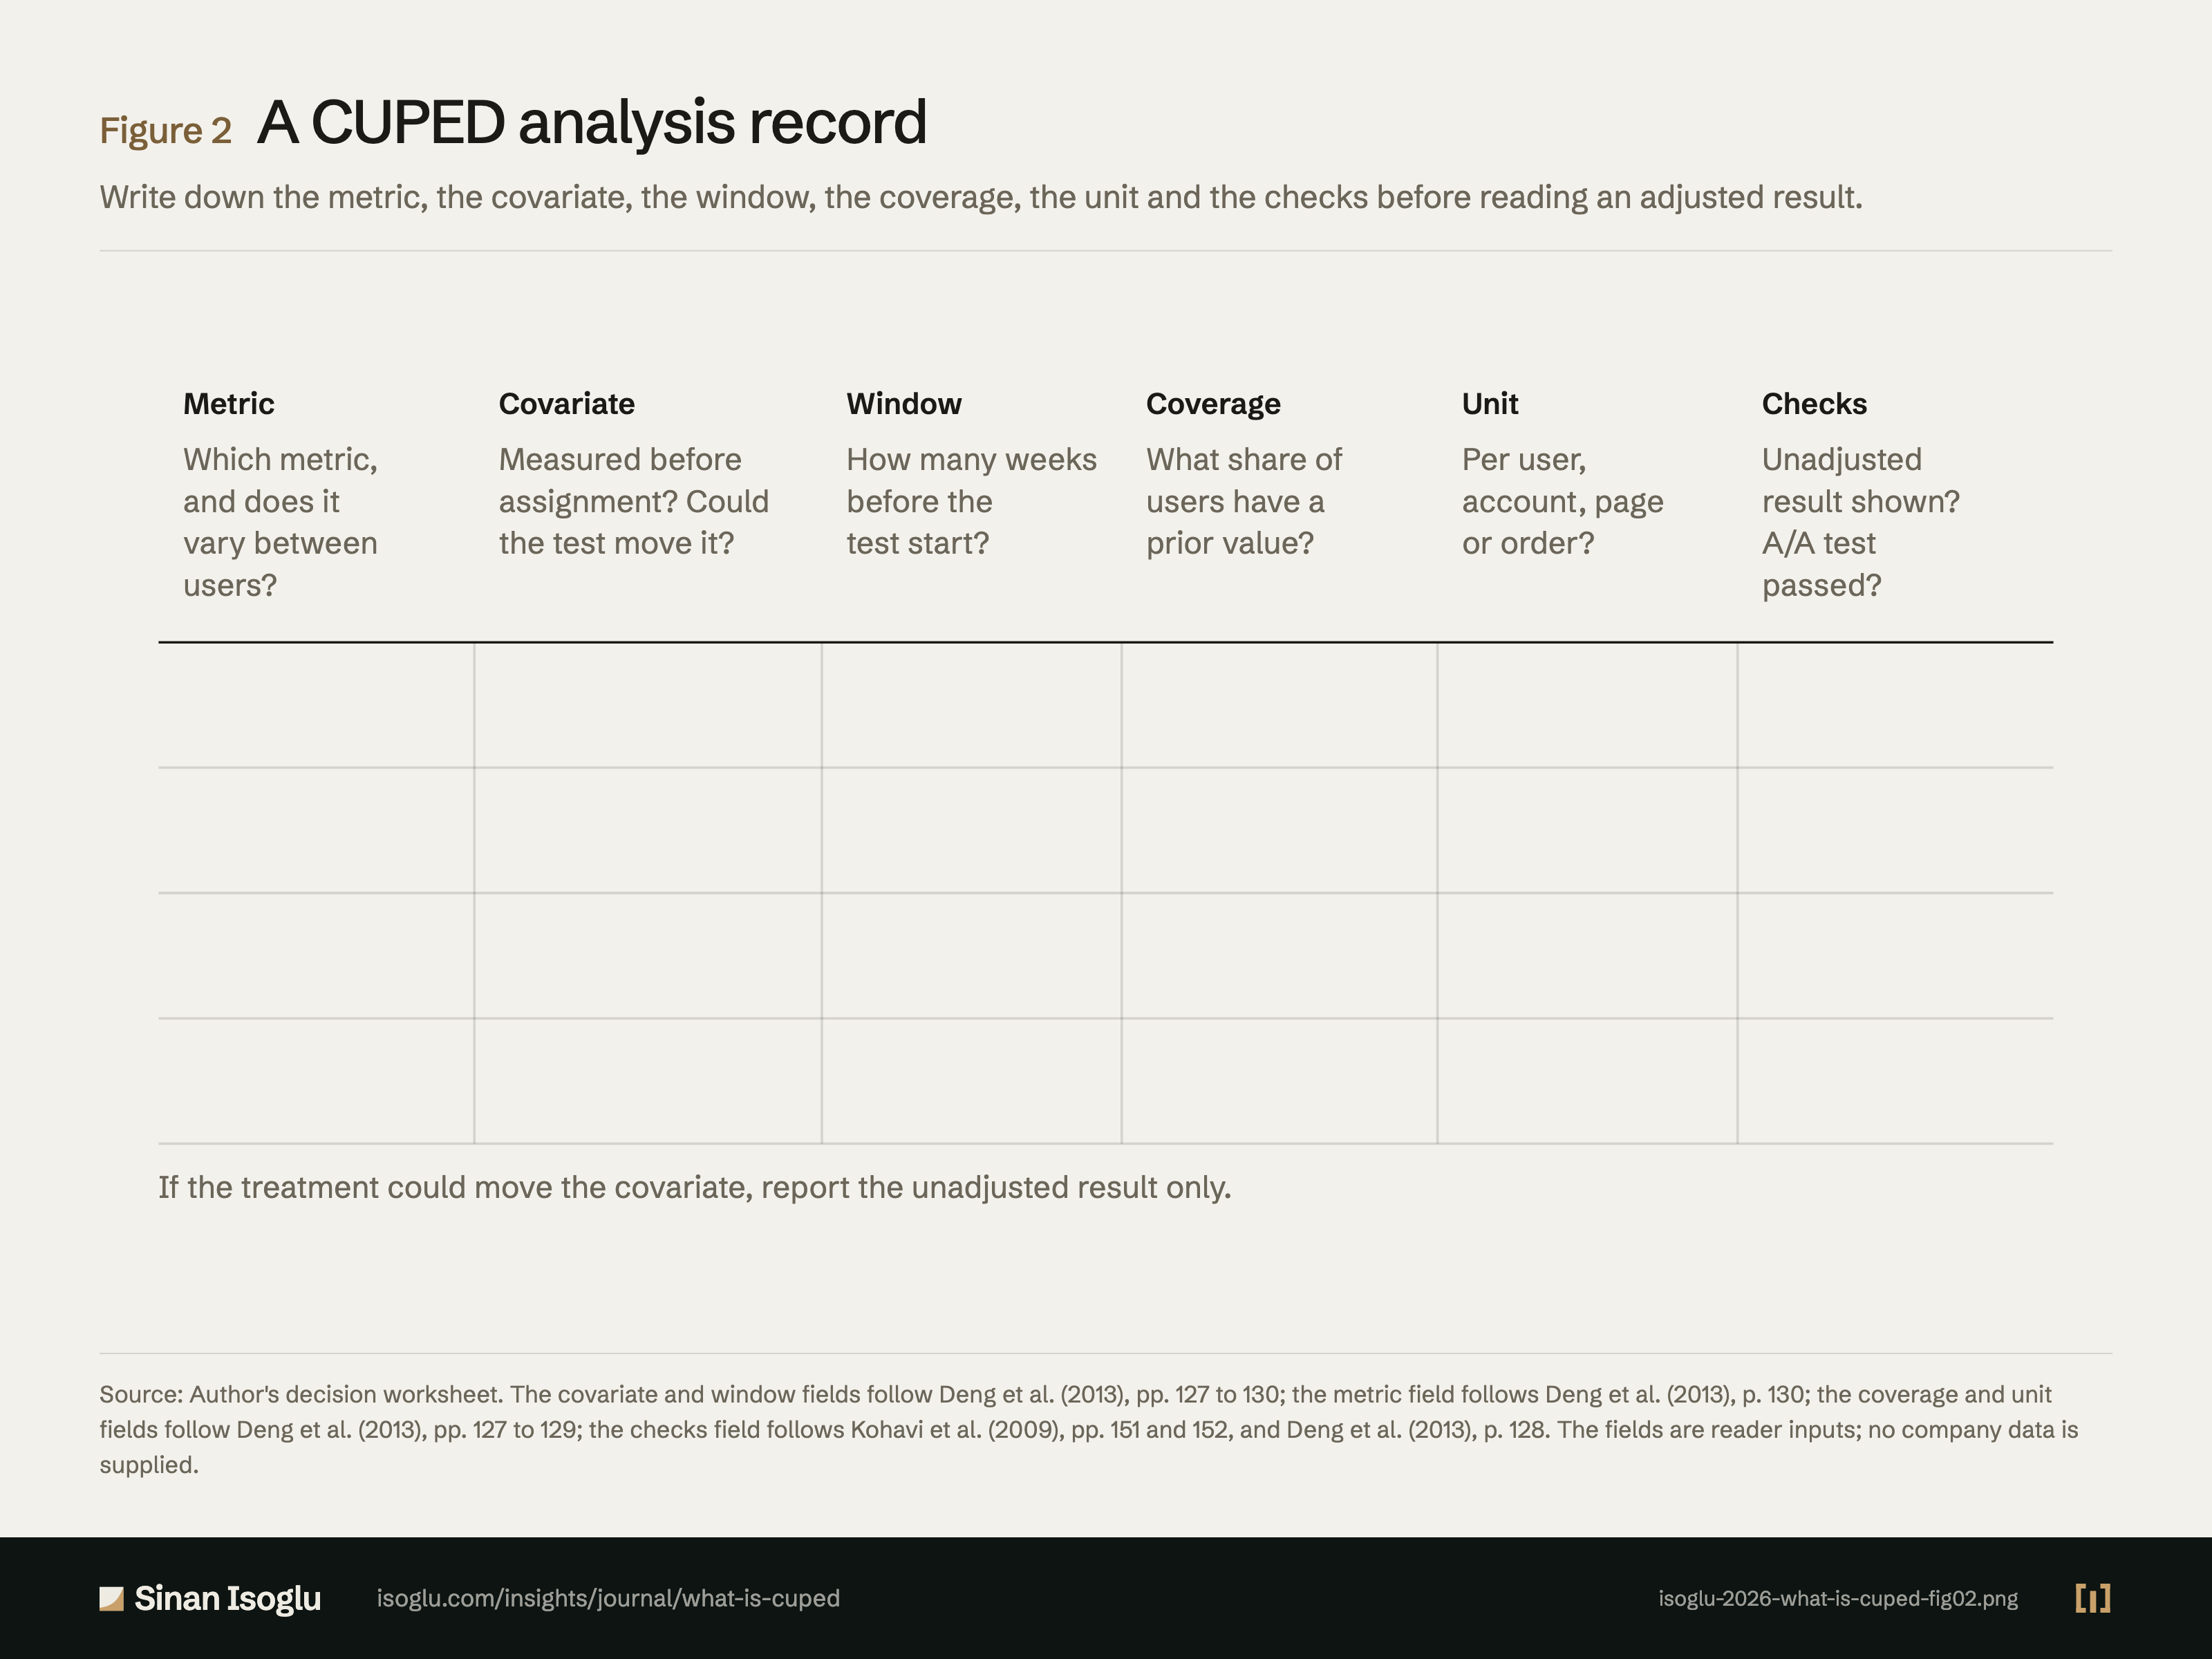
Write down the metric, the covariate, the window, the coverage, the unit and the checks before reading an adjusted result.

Cite Embed

Figure 2A CUPED analysis record

A six-column worksheet for a CUPED analysis: the metric and how much it varies between users, the covariate and whether the treatment could move it, the pre-experiment window, the share of users with a pre-experiment value, the unit of analysis, and the checks reported with the adjusted result.MetricWhich metric,and does itvary betweenusers?CovariateMeasured beforeassignment? Couldthe test move it?WindowHow many weeksbefore thetest start?CoverageWhat share ofusers have aprior value?UnitPer user,account, pageor order?ChecksUnadjustedresult shown?A/A testpassed?If the treatment could move the covariate, report the unadjusted result only.

Source: Author's decision worksheet. The covariate and window fields follow Deng et al. (2013), pp. 127 to 130; the metric field follows Deng et al. (2013), p. 130; the coverage and unit fields follow Deng et al. (2013), pp. 127 to 129; the checks field follows Kohavi et al. (2009), pp. 151 and 152, and Deng et al. (2013), p. 128. The fields are reader inputs; no company data is supplied.
PNG4:3, 1600 × 1200, with the title, the source line and the attribution set in the image isoglu-2026-what-is-cuped-fig02.png

Source and evidence

Each line names a claim related to this exhibit, its source, and how it was checked.

  • B CUPED-OWN-C3 A CUPED analysis is written down as one record: metric, covariate and why the treatment cannot move it, pre-period window, coverage, unit (user, account, page or order), and checks (unadjusted result, A/A test); illustrated with a hypothetical B2B software firm's report builder test that randomizes whole accounts, analyses per user with the delta method, and checks the pre-period correlation of revenue per account before adjusting it.Author worksheet grounded in DXKW13-C4, DXKW13-C5 and KLSH09-C5

Grades: A, verified against the printed page of the primary source · B, primary source, text layer only · C, authoritative secondary · D, reported.

Cite or embed

APA 7

Isoglu, S. (2026). A CUPED analysis record [Figure]. isoglu.com. https://isoglu.com/insights/exhibits/isoglu-2026-what-is-cuped-fig02/

BibTeX
@misc{isoglu-2026-what-is-cuped-fig02,
  author = {Isoglu, Sinan},
  title = {{A CUPED analysis record}},
  year = {2026},
  howpublished = {Figure 2, isoglu.com},
  url = {https://isoglu.com/insights/exhibits/isoglu-2026-what-is-cuped-fig02/},
  note = {From the essay {What is CUPED?}}
}
Embed this exhibit

Copy this HTML to use the PNG exhibit on your site with its source line and a link back to the exhibit page.

<figure>
  <a href="https://isoglu.com/insights/exhibits/isoglu-2026-what-is-cuped-fig02/">
    <img src="https://isoglu.com/social/isoglu-2026-what-is-cuped-fig02.png" alt="Figure 2: A CUPED analysis record" width="3200" height="2400">
  </a>
  <figcaption>Figure 2: A CUPED analysis record. Source: Author&#39;s decision worksheet. The covariate and window fields follow Deng et al. (2013), pp. 127 to 130; the metric field follows Deng et al. (2013), p. 130; the coverage and unit fields follow Deng et al. (2013), pp. 127 to 129; the checks field follows Kohavi et al. (2009), pp. 151 and 152, and Deng et al. (2013), p. 128. The fields are reader inputs; no company data is supplied. <a href="https://isoglu.com/insights/exhibits/isoglu-2026-what-is-cuped-fig02/">View exhibit</a>.</figcaption>
</figure>