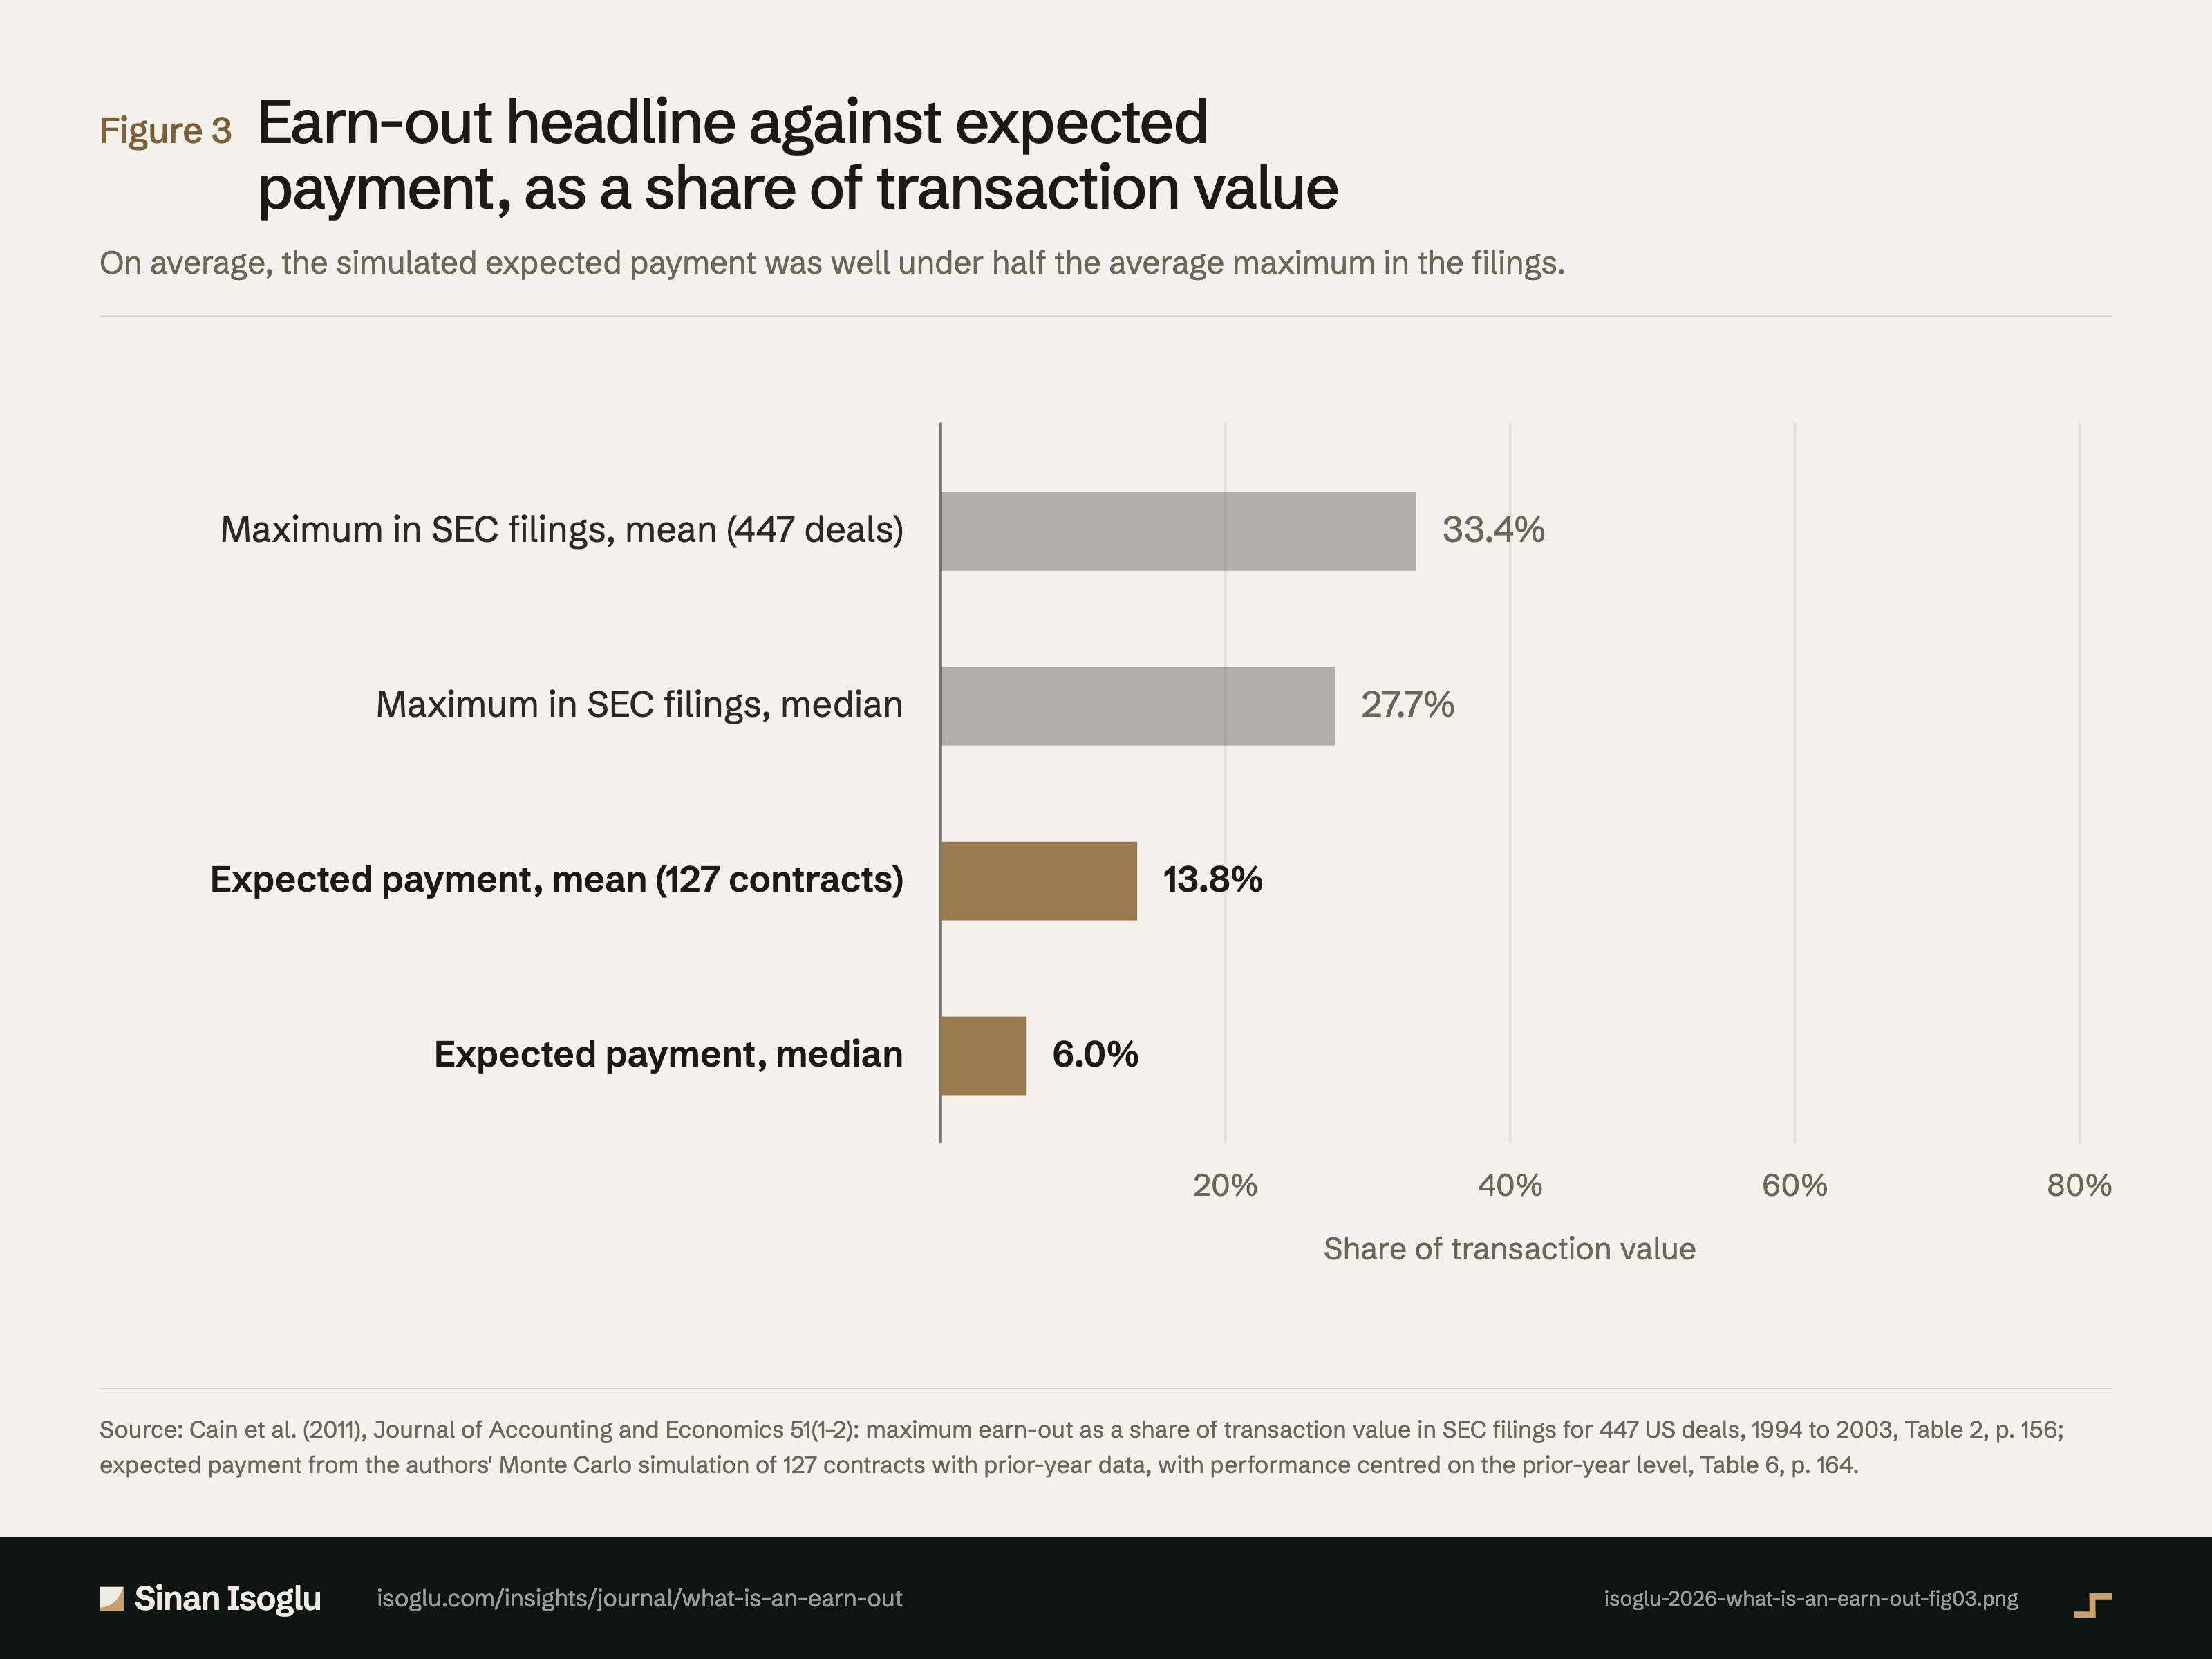
Figure 3From “What is an earn-out? The part of the price that waits for proof”
Earn-out headline against expected payment, as a share of transaction value
On average, the simulated expected payment was well under half the average maximum in the filings.
Figure 3Earn-out headline against expected payment, as a share of transaction value
Source: Cain et al. (2011), Journal of Accounting and Economics 51(1–2): maximum earn-out as a share of transaction value in SEC filings for 447 US deals, 1994 to 2003, Table 2, p. 156; expected payment from the authors' Monte Carlo simulation of 127 contracts with prior-year data, with performance centred on the prior-year level, Table 6, p. 164.
Source and evidence
Each line names a claim related to this exhibit, its source, and how it was checked.
- A A verified against the printed page of the primary sourceB primary source, text layer onlyC authoritative secondaryD reported Contract size and shape: maximum earn-out $21 million on average, median $5 million; 33% of transaction value on average if paid in full (median 28%; Table 2, p. 156, read on the page image: 447 deals, mean 33.4%, median 27.7%; SDC-reported 990 deals, mean 32.7%, median 28.6%); 90% contingent on the target alone; linear (42%) or stepwise (40%) to a cap; the median target must grow 18% before any payment and over a quarter need no growth (pp. 152, 154 to 156): "the maximum earnout that could be paid per acquisition is $21 million, with a median of $5 million"; "Conditional on the maximum being paid, the earnout constitutes 33% of the total transaction value"; "the earnout is contingent on the performance of the target firm only"; "a linear function of the target's performance subject to a maximum (42% of the sample)"; "a stepwise function of the target's performance subject to a maximum (40% of the sample)"; "the median target must improve its performance by 18% relative to the prior year's level"; "over 25% of the targets need not improve performance at all"Cain, Denis and Denis (2011)
- A A verified against the printed page of the primary sourceB primary source, text layer onlyC authoritative secondaryD reported A Monte Carlo of 127 contracts with prior-year data, drawing performance from a distribution centred on the prior-year level (no growth), puts the expected payment at 13.8% of transaction value on average (median 6.0%, Table 6, p. 164, read on the page image) against the SDC-recorded 32.7% for all deals; about 19% expect zero; the SDC figures are an upper bound in most acquisitions (pp. 163, 164): "assuming a normal distribution with a mean equal to the pre-acquisition performance level"; "the expected earnout payment is equal to $2.4 million and constitutes 13.8% of the total transaction value"; "the SDC-reported earnout contracts represented an average amount of $22.3 million, or 32.7% of transaction value"; "these numbers appear to represent an upper bound, rather than an expectation of the potential earnout payoffs in most acquisitions"; "about 19% of our sample firms exhibit an expected earnout payoff of zero"Cain, Denis and Denis (2011)
From the essay
Go-to-market strategy
What is an earn-out? The part of the price that waits for proof
An earn-out pays part of the price only if the acquired business hits agreed targets. Studies find it in hard-to-value deals; integration can strain it.
Read the essayThis exhibit belongs to an essay: the numbers live here, the argument lives there.
Cite or embed
Related exhibits
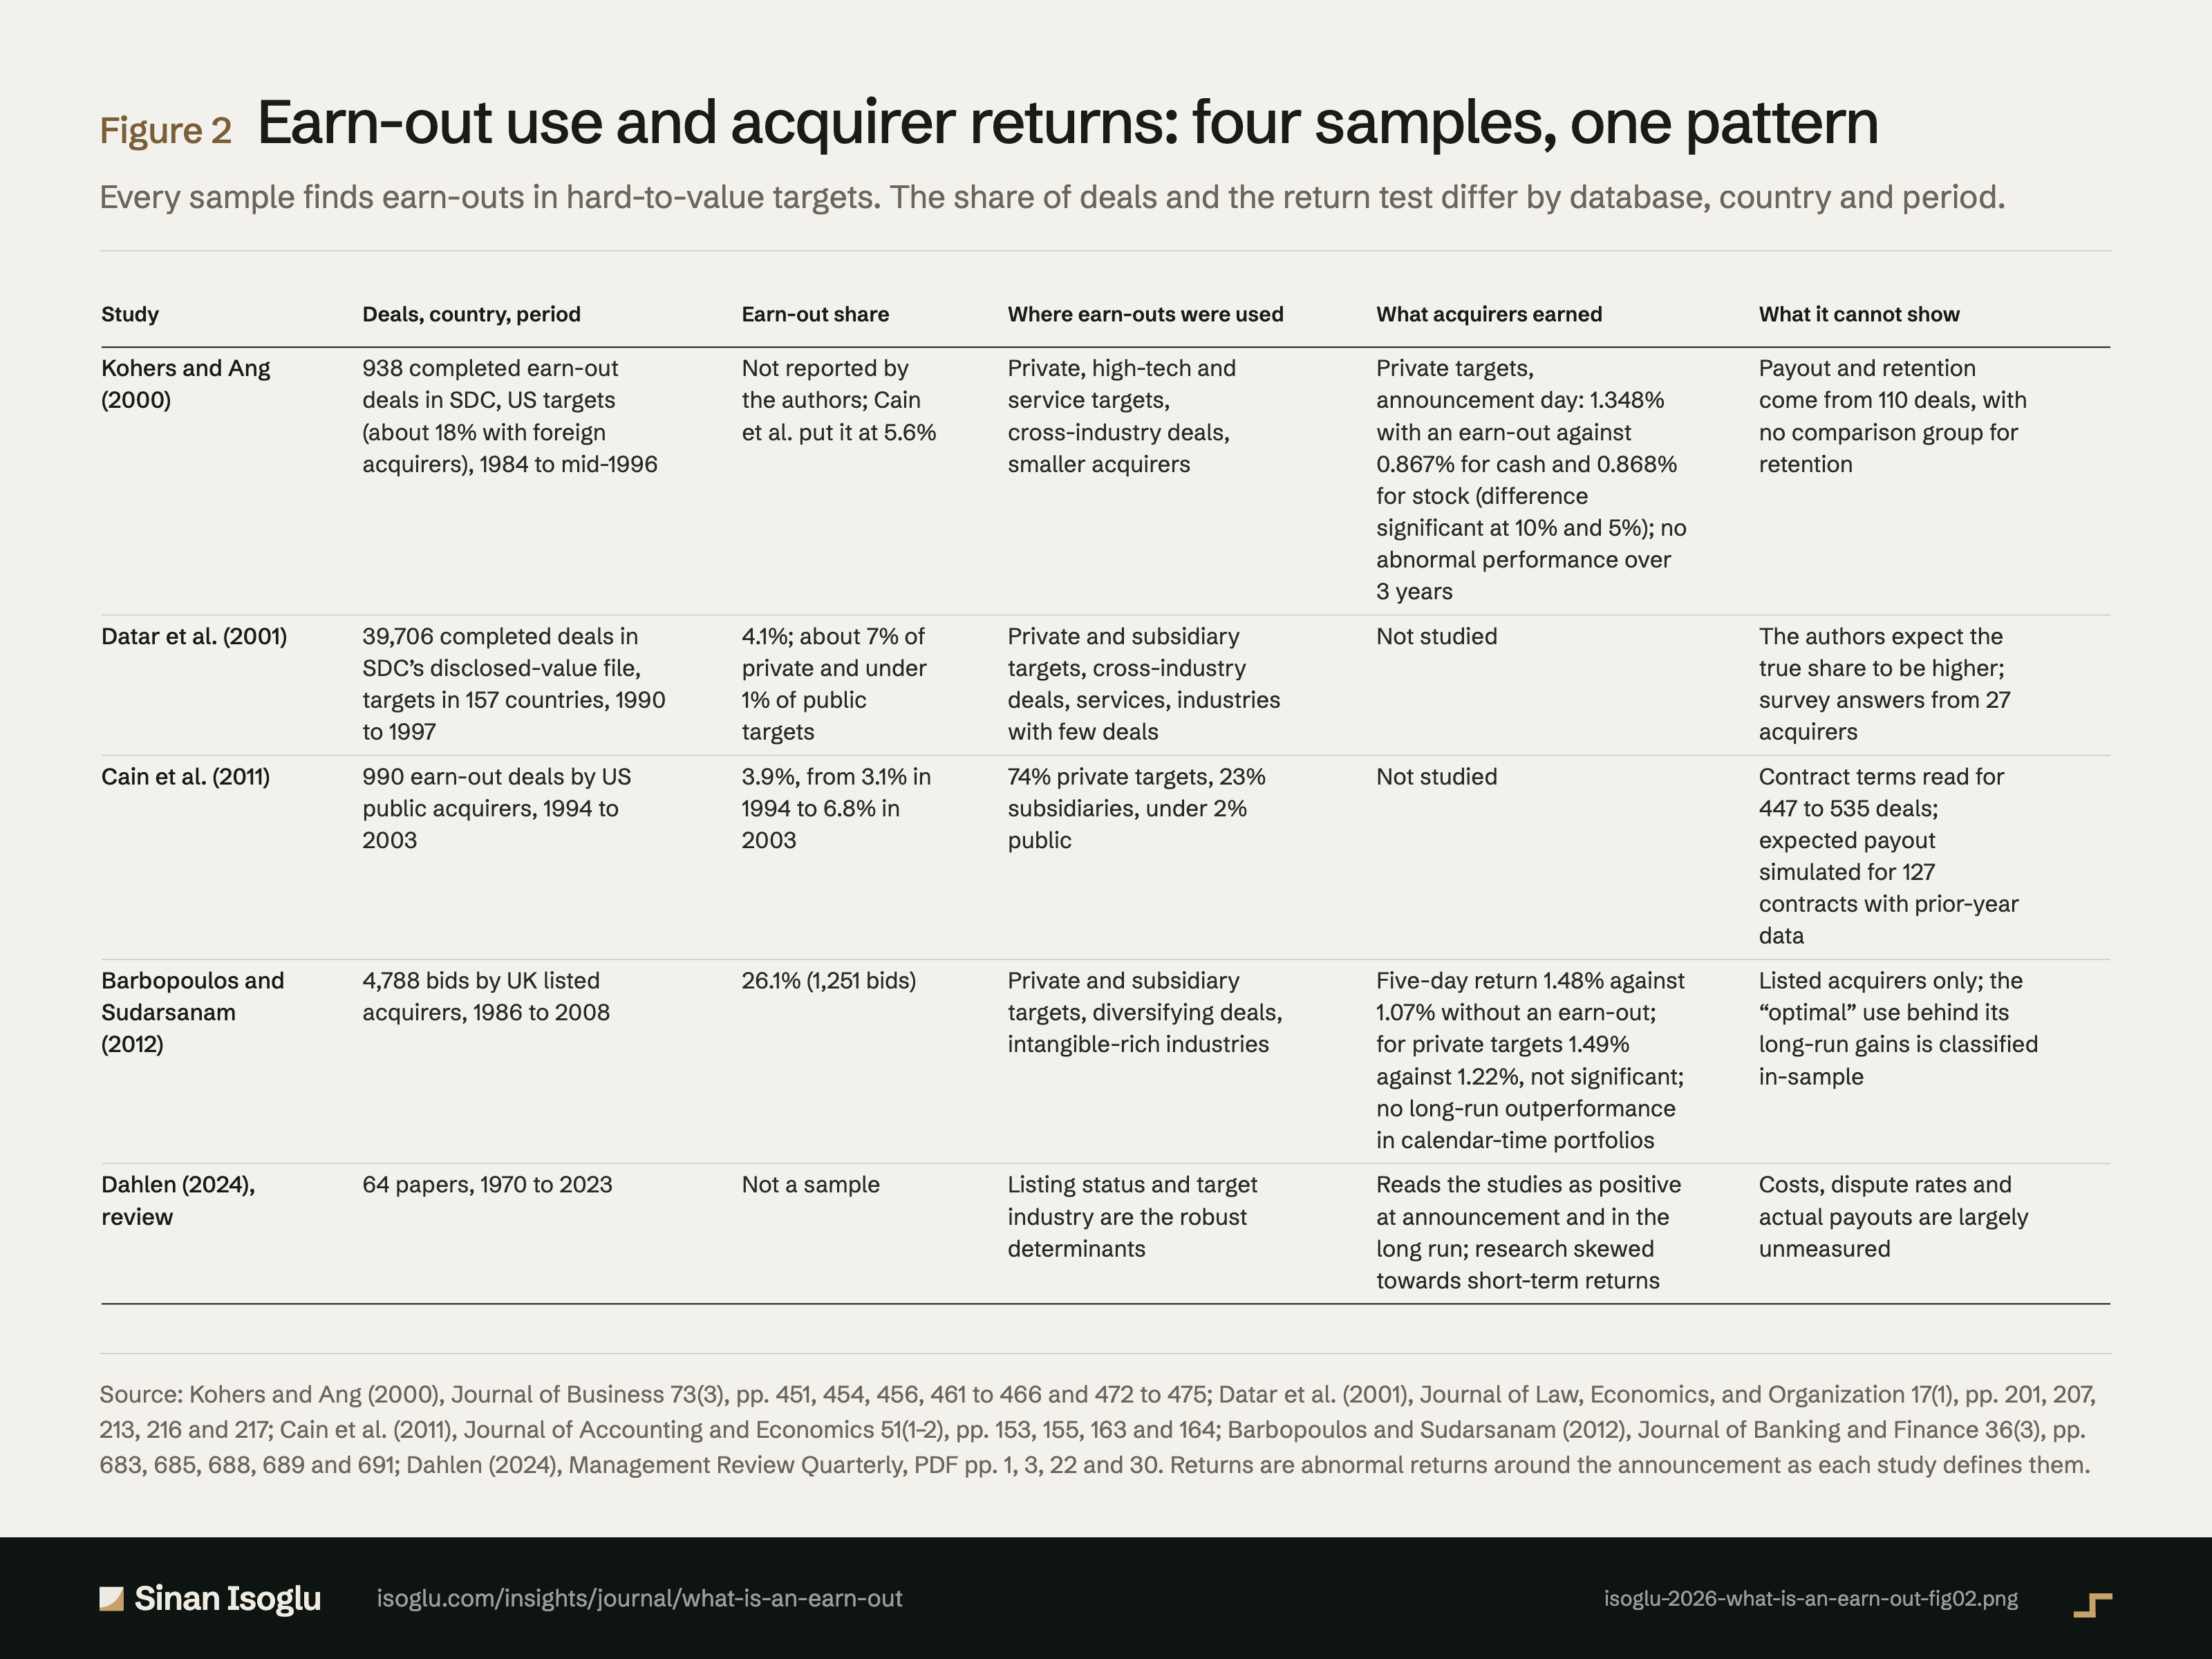
Figure 2Figure
Earn-out use and acquirer returns: four samples, one pattern
What is an earn-out? The part of the price that waits for proof
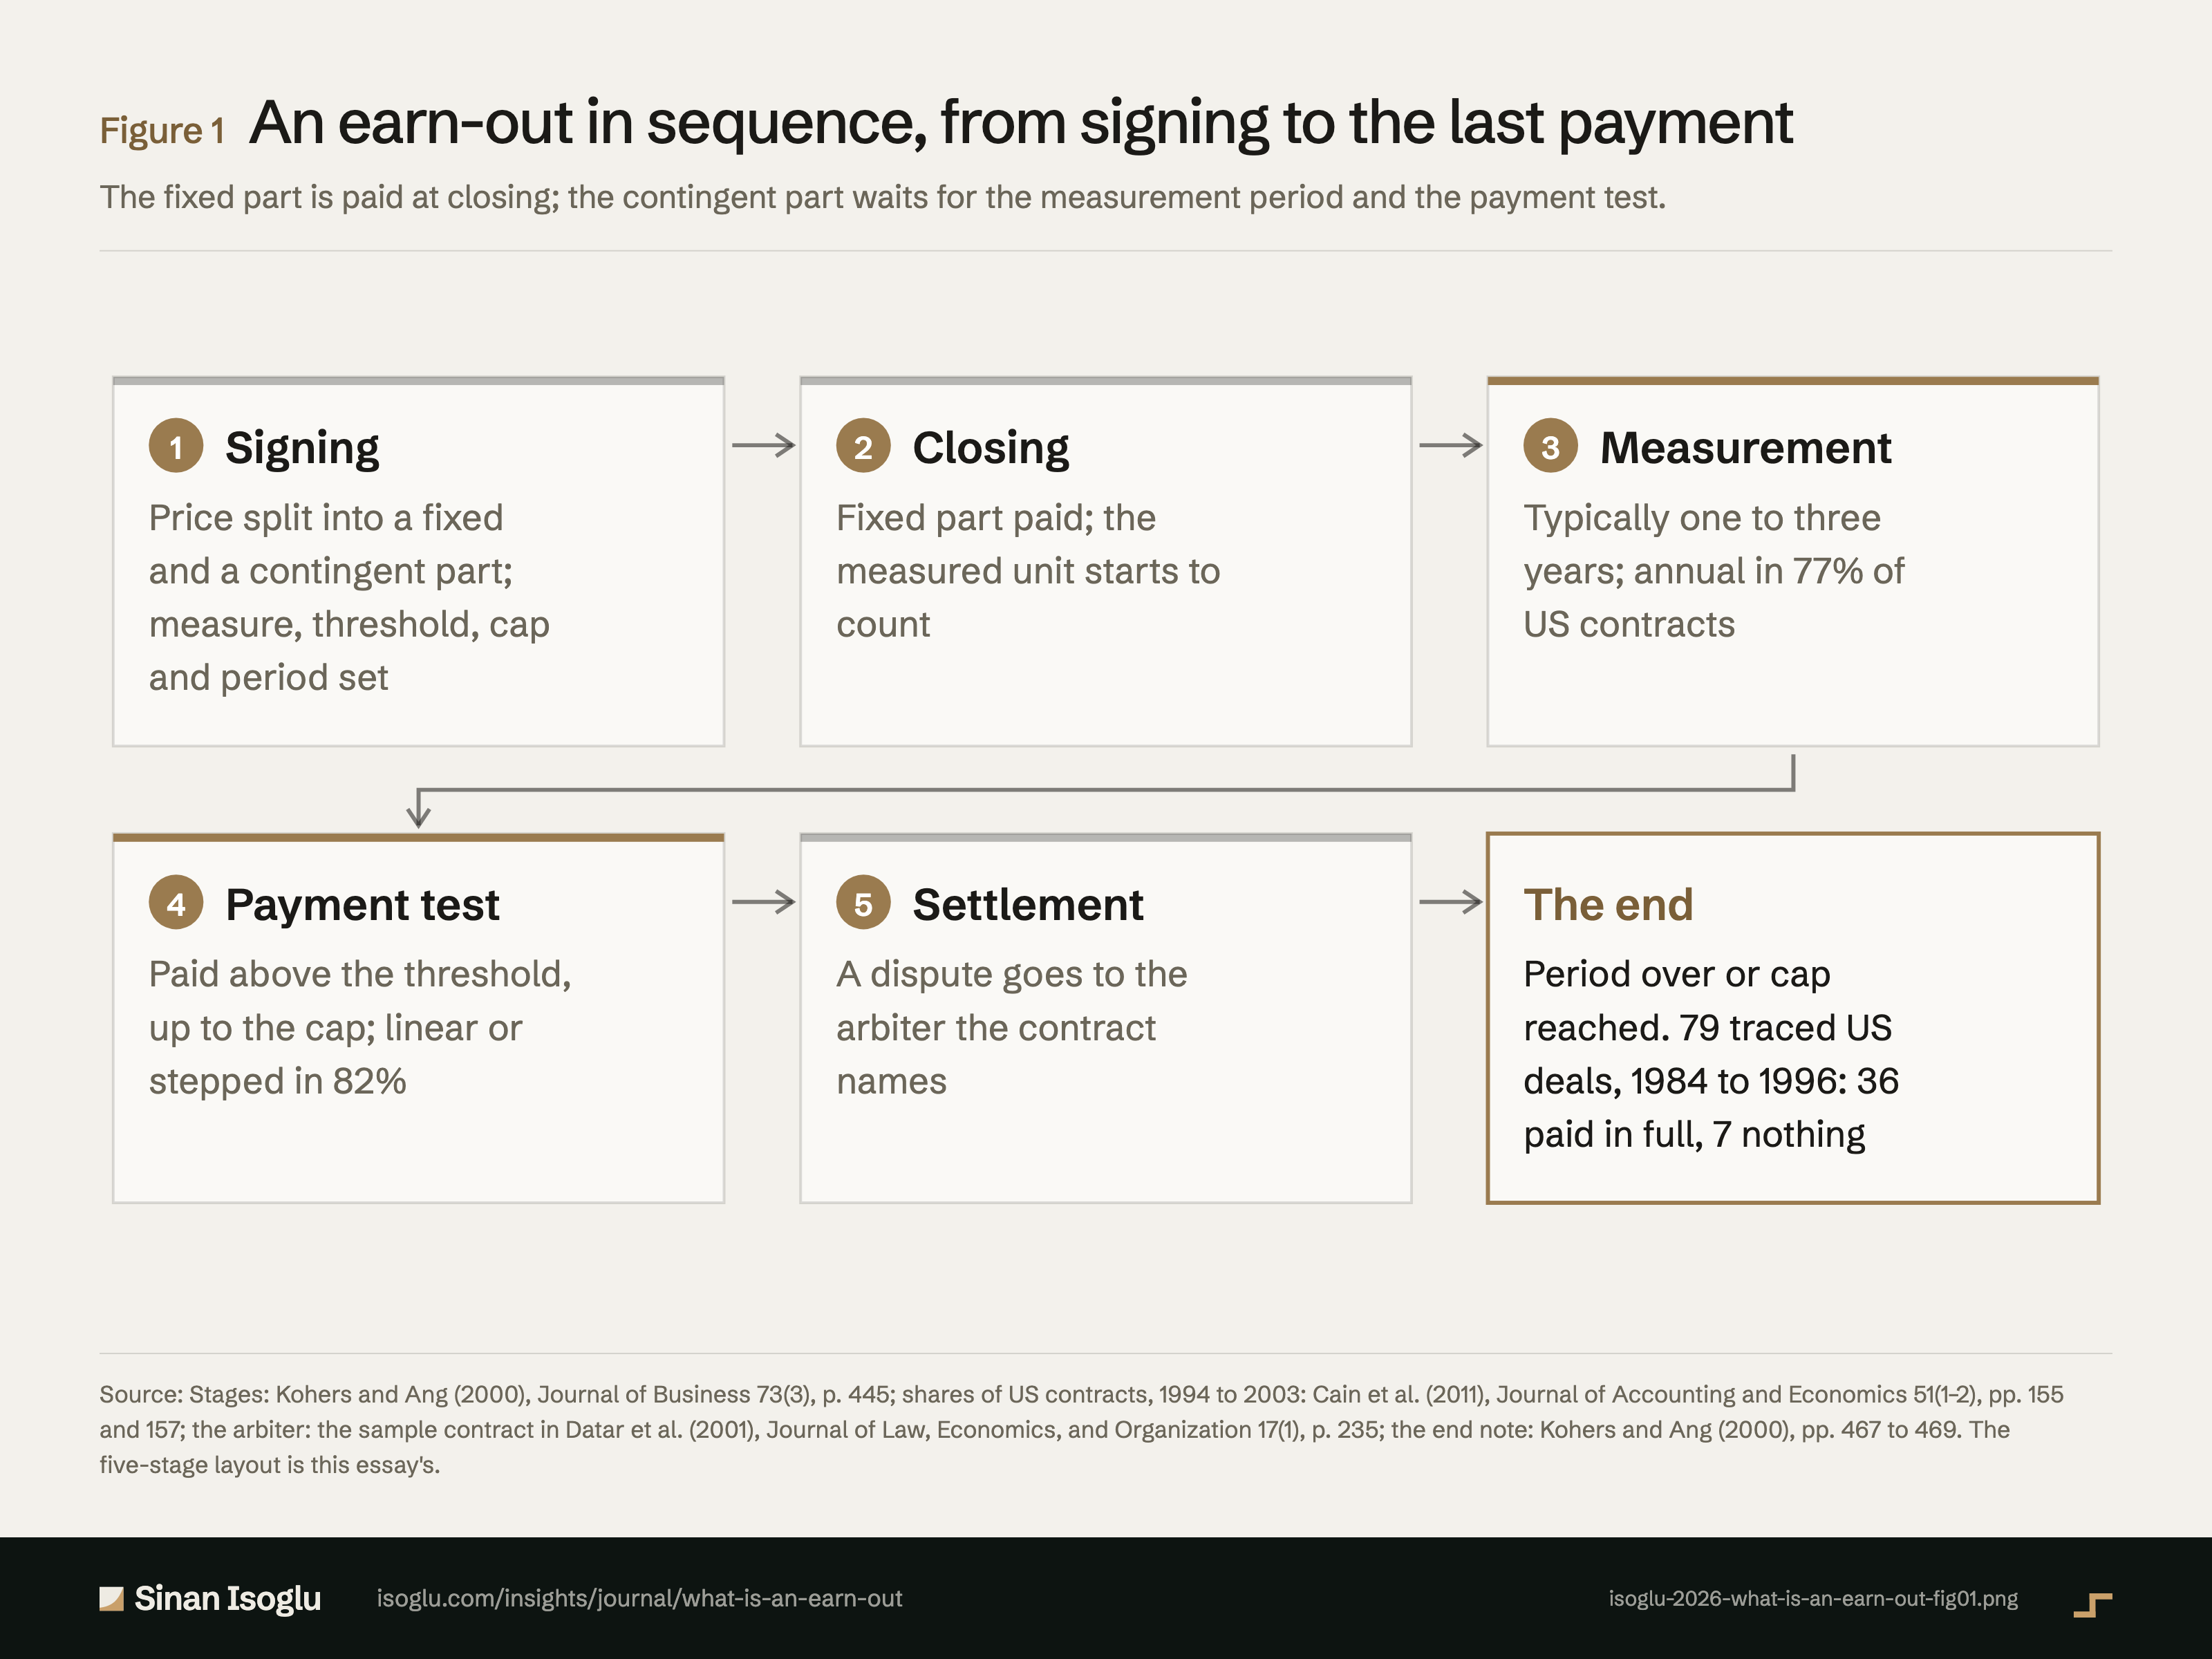
Figure 1Figure
An earn-out in sequence, from signing to the last payment
What is an earn-out? The part of the price that waits for proof
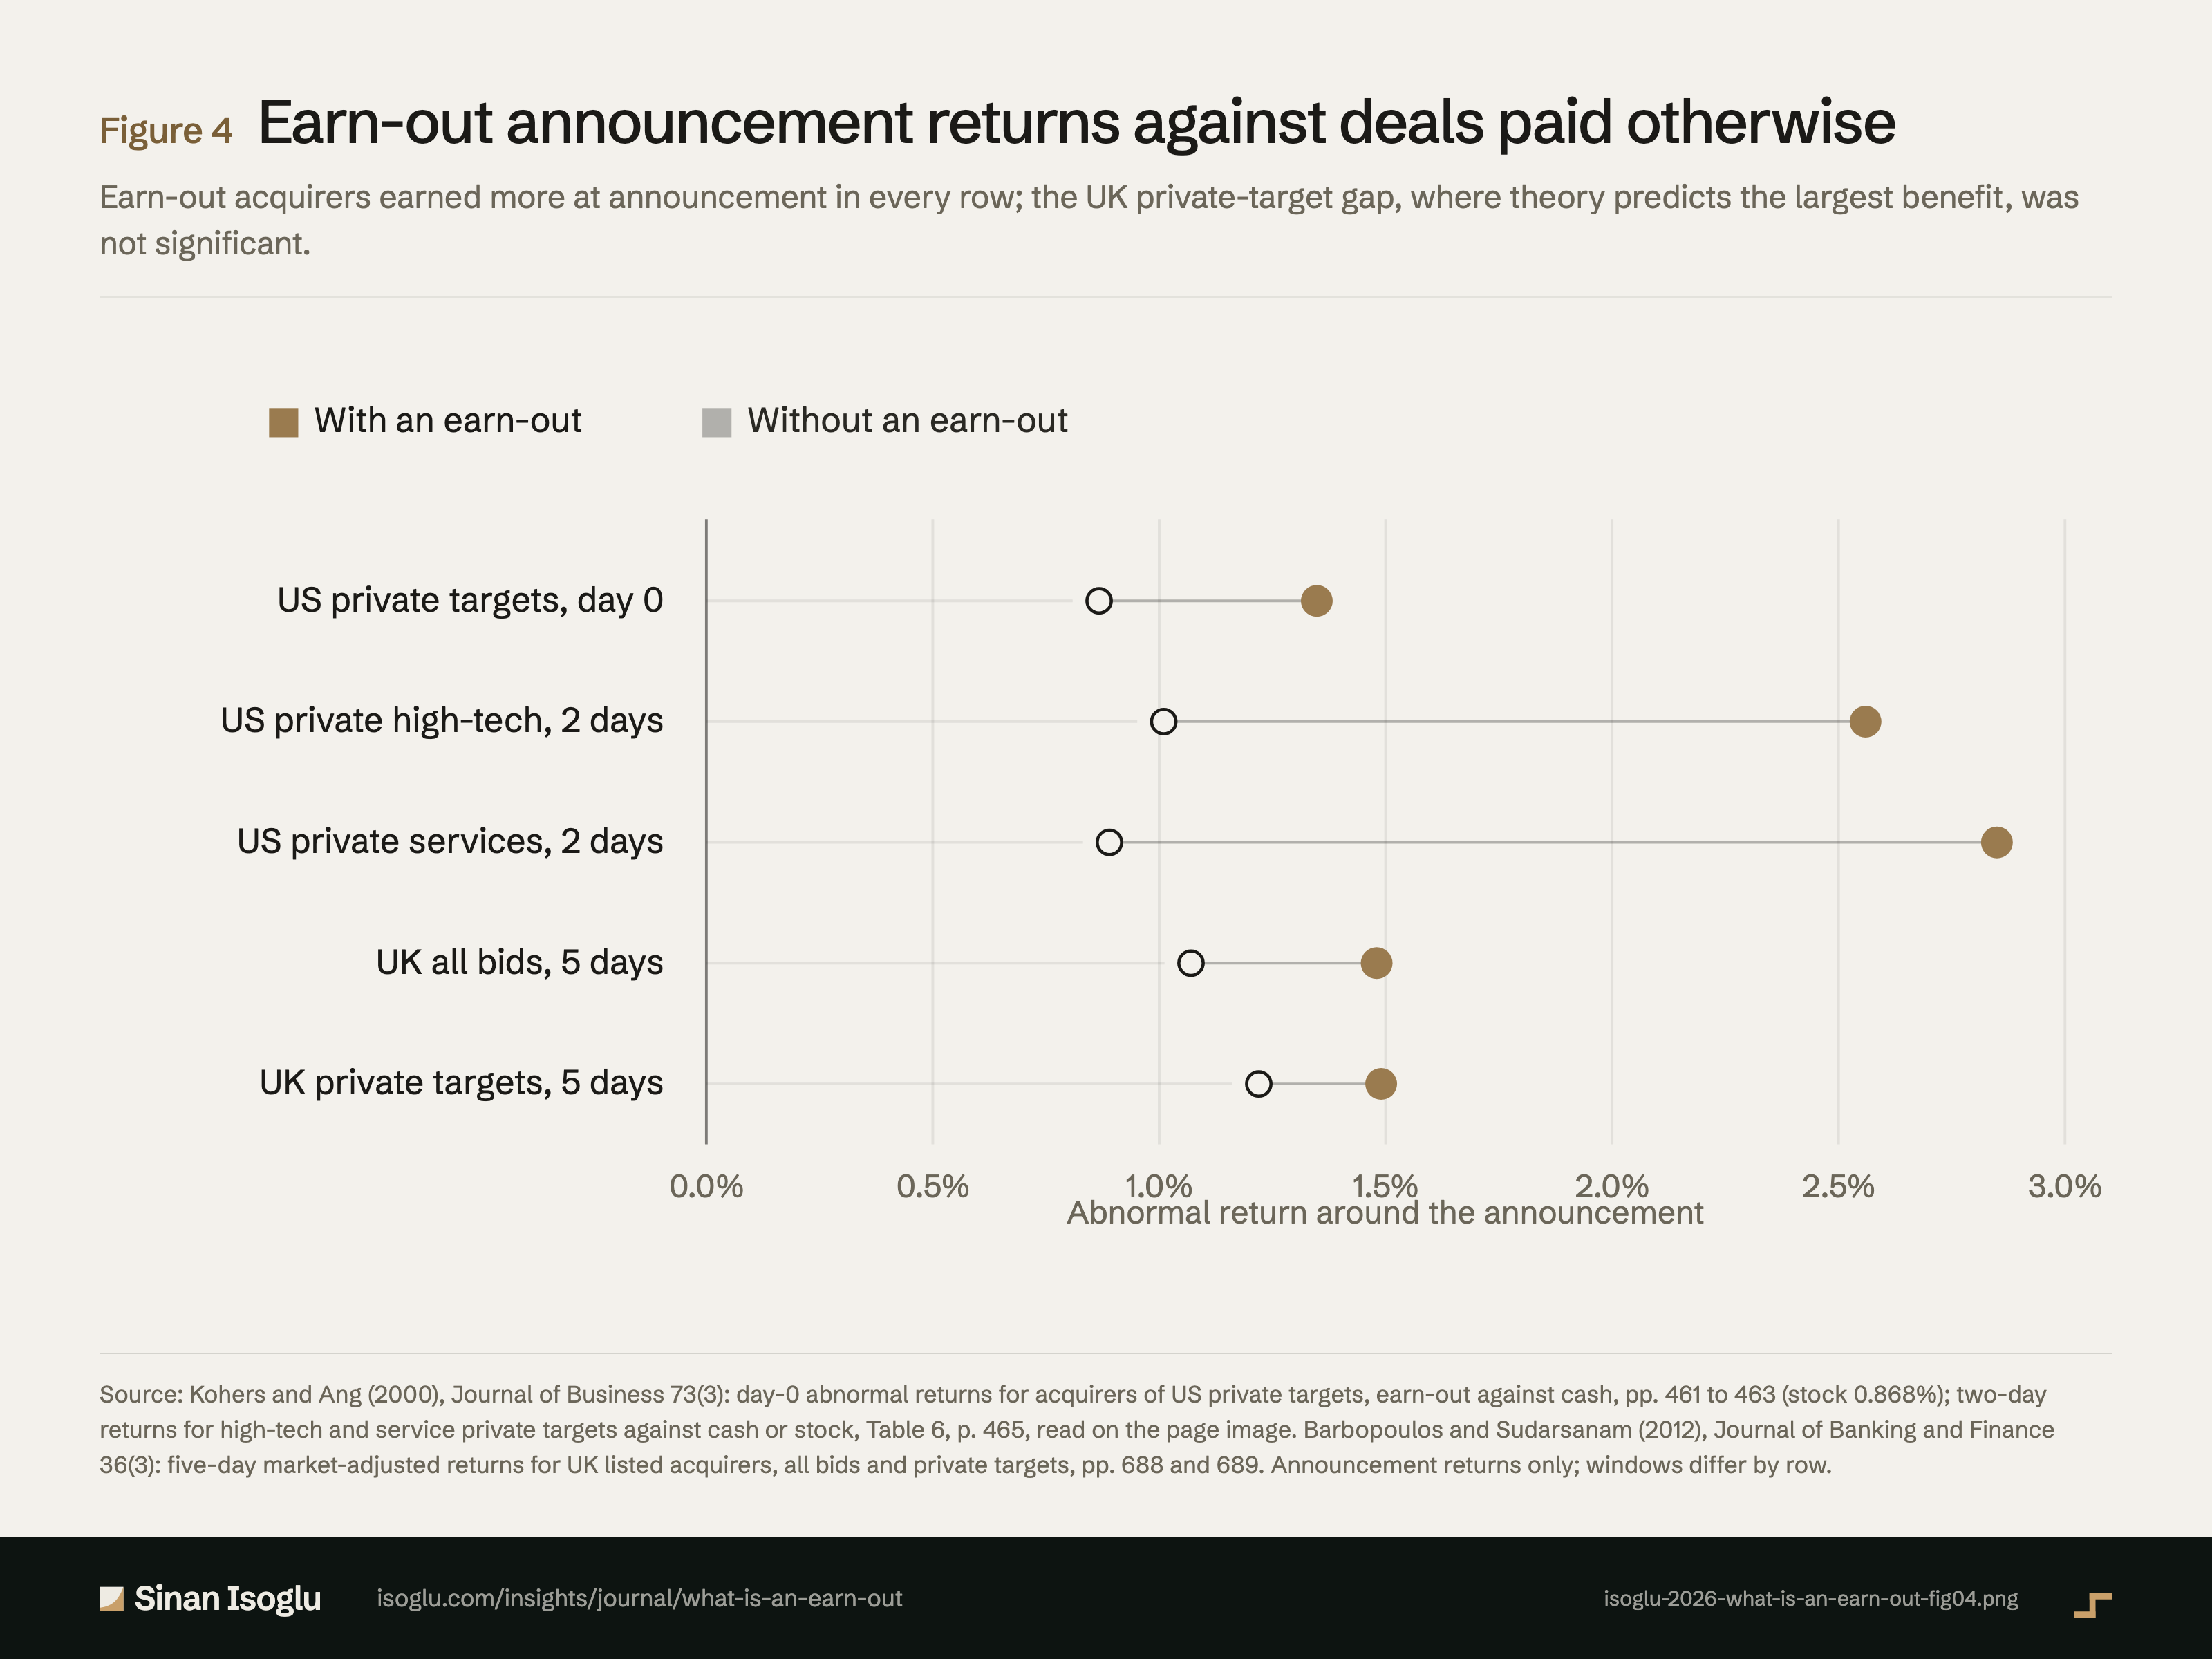
Figure 4Figure
Earn-out announcement returns against deals paid otherwise
What is an earn-out? The part of the price that waits for proof
Contact
Bring the question you're working on.
Research, a guest lecture, or a commercial question.