Figure 2From “What is an earn-out? The part of the price that waits for proof”
Earn-out use and acquirer returns: four samples, one pattern
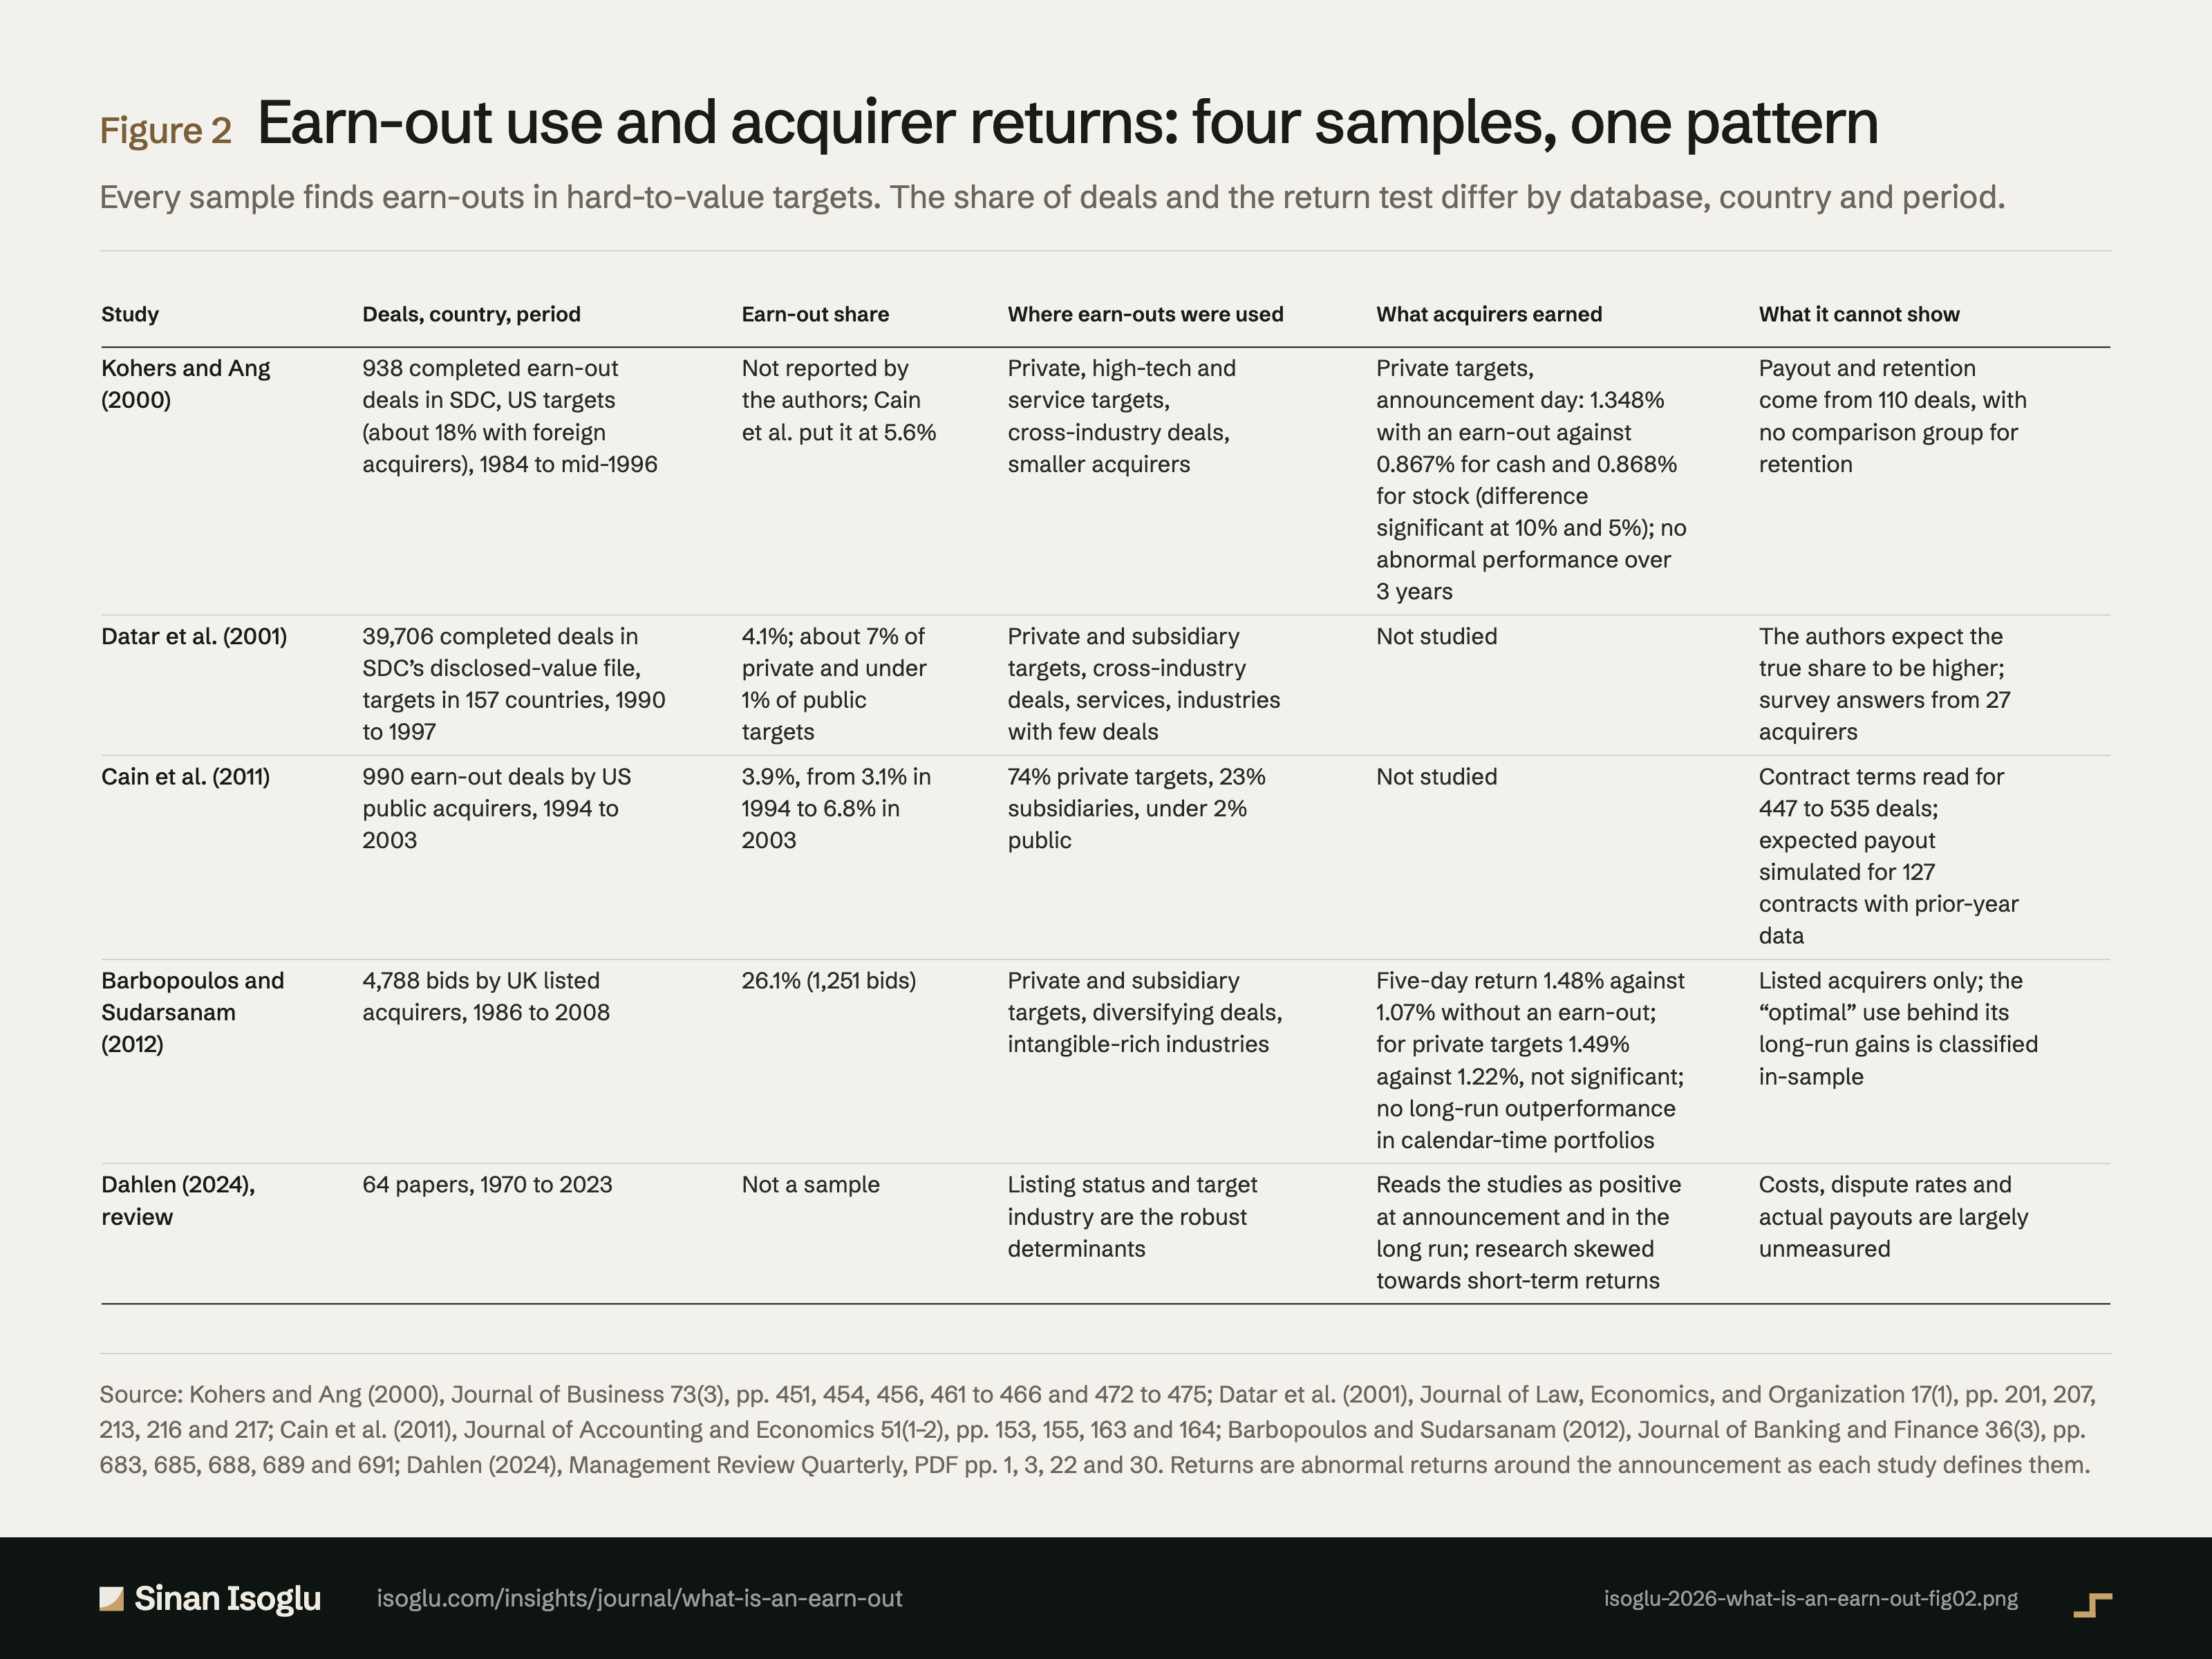
Every sample finds earn-outs in hard-to-value targets. The share of deals and the return test differ by database, country and period.
Figure 2Earn-out use and acquirer returns: four samples, one pattern
| Study | Deals, country, period | Earn-out share | Where earn-outs were used | What acquirers earned | What it cannot show |
|---|---|---|---|---|---|
| Kohers and Ang (2000) | 938 completed earn-out deals in SDC, US targets (about 18% with foreign acquirers), 1984 to mid-1996 | Not reported by the authors; Cain et al. put it at 5.6% | Private, high-tech and service targets, cross-industry deals, smaller acquirers | Private targets, announcement day: 1.348% with an earn-out against 0.867% for cash and 0.868% for stock (difference significant at 10% and 5%); no abnormal performance over 3 years | Payout and retention come from 110 deals, with no comparison group for retention |
| Datar et al. (2001) | 39,706 completed deals in SDC's disclosed-value file, targets in 157 countries, 1990 to 1997 | 4.1%; about 7% of private and under 1% of public targets | Private and subsidiary targets, cross-industry deals, services, industries with few deals | Not studied | The authors expect the true share to be higher; survey answers from 27 acquirers |
| Cain et al. (2011) | 990 earn-out deals by US public acquirers, 1994 to 2003 | 3.9%, from 3.1% in 1994 to 6.8% in 2003 | 74% private targets, 23% subsidiaries, under 2% public | Not studied | Contract terms read for 447 to 535 deals; expected payout simulated for 127 contracts with prior-year data |
| Barbopoulos and Sudarsanam (2012) | 4,788 bids by UK listed acquirers, 1986 to 2008 | 26.1% (1,251 bids) | Private and subsidiary targets, diversifying deals, intangible-rich industries | Five-day return 1.48% against 1.07% without an earn-out; for private targets 1.49% against 1.22%, not significant; no long-run outperformance in calendar-time portfolios | Listed acquirers only; the "optimal" use behind its long-run gains is classified in-sample |
| Dahlen (2024), review | 64 papers, 1970 to 2023 | Not a sample | Listing status and target industry are the robust determinants | Reads the studies as positive at announcement and in the long run; research skewed towards short-term returns | Costs, dispute rates and actual payouts are largely unmeasured |
Swipe or scroll horizontally if the table is wider than your screen.
Source: Kohers and Ang (2000), Journal of Business 73(3), pp. 451, 454, 456, 461 to 466 and 472 to 475; Datar et al. (2001), Journal of Law, Economics, and Organization 17(1), pp. 201, 207, 213, 216 and 217; Cain et al. (2011), Journal of Accounting and Economics 51(1–2), pp. 153, 155, 163 and 164; Barbopoulos and Sudarsanam (2012), Journal of Banking and Finance 36(3), pp. 683, 685, 688, 689 and 691; Dahlen (2024), Management Review Quarterly, PDF pp. 1, 3, 22 and 30. Returns are abnormal returns around the announcement as each study defines them.
Source and evidence
Each line names a claim related to this exhibit, its source, and how it was checked.
- A A verified against the printed page of the primary sourceB primary source, text layer onlyC authoritative secondaryD reported The sample: 938 completed earn-out takeovers in SDC from 1 January 1984 to 30 June 1996, US targets, 620 private and 275 divested subsidiaries; about 18% with foreign acquirers (pp. 451, 454): "completed takeovers using earnouts over the period from January 1, 1984, to June 30, 1996"; "In total, 938 mergers using earnouts as a means of payment are reported"; "620 of the 938 earnout deals involve private targets, while 275 of the total reflect the acquisition of divested subsidiaries"; "occurred between a U.S. target and an acquirer from another country"Kohers and Ang (2000)
- A A verified against the printed page of the primary sourceB primary source, text layer onlyC authoritative secondaryD reported In logit models of private and subsidiary deals, earn-out odds are almost 70% higher for high-tech targets, about 86% higher for service firms, about 72% higher for private targets than subsidiaries and about 30% lower within an industry; smaller acquirers and relatively large targets use them more (pp. 456, 457): "the odds of using earnouts in high-tech acquisitions are almost 70% higher"; "the odds of earnout use are about 86% higher in takeovers of service firms"; "by about 72% when the target is a privately held firm as opposed to a divested subsidiary"; "are about 30% less than that in diversification takeovers"; "smaller acquiring firms are more likely to employ earnouts than are larger companies"; "larger private targets and subsidiary targets, relative to their acquirers, have a higher likelihood of being paid with earnout payments"Kohers and Ang (2000)
- A A verified against the printed page of the primary sourceB primary source, text layer onlyC authoritative secondaryD reported Announcement returns: 1.356% on day 0 for 449 bidders; for private targets 1.348% with an earn-out against 0.867% for cash and 0.868% for stock, significant at the 10% level against cash (p = .0727) and the 5% level against stock (p = .0493) (the difference tests carry no stated sidedness; the one-sided note to Table 4, p. 463, covers each group's own t-statistics); larger for earn-outs in high-asymmetry private deals over two days (Table 6, p. 465, read on the page image: high-tech 2.56% against 1.01%, service 2.85% against 0.89%); no difference for divested subsidiaries (pp. 461 to 466): "the average abnormal return on day 0, the original merger announcement date, is 1.356%"; "the average abnormal return for the earnout subsample is 1.348%"; "significantly greater than the reaction to cash offers at the 10% level"; "significantly larger than that for stock offers at the 5% level"; "in high-tech takeovers, bidders using earnouts experience larger abnormal returns than bidders that chose either cash or stock"; "show no differences in the CARs for mergers using earnout contracts as opposed to cash or stock"Kohers and Ang (2000)
- A A verified against the printed page of the primary sourceB primary source, text layer onlyC authoritative secondaryD reported Over three years in calendar-time portfolios, acquirers using earn-outs show no abnormal performance, so the announcement gain is not reversed (pp. 473 to 475): "the ex ante benefits of earnouts are not reversed in the long run"; "no significant abnormal postmerger performance for acquirers using earnouts"Kohers and Ang (2000)
- A A verified against the printed page of the primary sourceB primary source, text layer onlyC authoritative secondaryD reported In 39,706 completed SDC acquisitions from 1990 to 1997, 4.1% carried a reported earn-out, about 7% of private and under 1% of public targets; the true share is likely far higher (pp. 213, 216, 217): "The final sample contains 39,706 acquisitions, including targets in 157 countries"; "The overall percentage of transactions involving reported earnouts is 4.1%"; "is likely to be far higher than the percentage produced by this analysis of the SDC database"; "approximately 7% of acquisitions of private companies utilize earnouts, compared to less than 1%"Datar, Frankel and Wolfson (2001)
- A A verified against the printed page of the primary sourceB primary source, text layer onlyC authoritative secondaryD reported 990 earn-outs among 25,213 acquisitions by US public acquirers from 1994 to 2003 (3.9%), rising from 3.1% to 6.8%; the authors put Kohers and Ang's rate at 5.6%; targets 74% private, 23% subsidiaries, under 2% public (p. 153): "Of this set, SDC identifies 990, or 3.9%, that include an earnout as part of the acquisition agreement"; "completed by publicly traded U.S. corporations between 1994 and 2003"; "the 5.6% observed in Kohers and Ang (2000)"; "the rate of earnout use has increased over the sample period from 3.1% in 1994 to 6.8% in 2003"; "fewer than 2% of the target companies are publicly traded"; "predominantly private companies (74%) and subsidiaries of public companies (23%)"Cain, Denis and Denis (2011)
- A A verified against the printed page of the primary sourceB primary source, text layer onlyC authoritative secondaryD reported A Monte Carlo of 127 contracts with prior-year data, drawing performance from a distribution centred on the prior-year level (no growth), puts the expected payment at 13.8% of transaction value on average (median 6.0%, Table 6, p. 164, read on the page image) against the SDC-recorded 32.7% for all deals; about 19% expect zero; the SDC figures are an upper bound in most acquisitions (pp. 163, 164): "assuming a normal distribution with a mean equal to the pre-acquisition performance level"; "the expected earnout payment is equal to $2.4 million and constitutes 13.8% of the total transaction value"; "the SDC-reported earnout contracts represented an average amount of $22.3 million, or 32.7% of transaction value"; "these numbers appear to represent an upper bound, rather than an expectation of the potential earnout payoffs in most acquisitions"; "about 19% of our sample firms exhibit an expected earnout payoff of zero"Cain, Denis and Denis (2011)
- A A verified against the printed page of the primary sourceB primary source, text layer onlyC authoritative secondaryD reported UK sample: 4,788 bids by LSE-listed acquirers announced 1986 to 2008, 26% with an earn-out, far above US rates, linked to the larger share of private targets in UK deals; 1,045 of the 1,251 earn-out targets private (Table 6, p. 688, read on the page image); contracts average about two years (pp. 679, 682, 683): "takeover bids announced by UK firms between 01/01/1986 and 31/12/2008"; "the acquirer is a UK company listed on the London Stock Exchange"; "4788 bids remain in the sample"; "The remaining M&A activity (i.e. 26%) involves earnouts as indicated by SDC"; "This is a much higher proportion of earnout use than in the US"; "on a much larger scale than in the US"; "the average length of the earnout contract is approximately 2-years"Barbopoulos and Sudarsanam (2012)
- A A verified against the printed page of the primary sourceB primary source, text layer onlyC authoritative secondaryD reported Older and larger acquirers use earn-outs less; unlisted targets are far more likely to be bought with one; some evidence for diversifying deals; intangible-rich industries have high predicted use (p. 687): "older and larger acquirers tend to make less use of earnout"; "unlisted targets are substantially more likely to be acquired using earnout than listed targets"; "There is some evidence that earnout is more likely in diversifying acquisitions"Barbopoulos and Sudarsanam (2012)
- A A verified against the printed page of the primary sourceB primary source, text layer onlyC authoritative secondaryD reported Five-day announcement returns: 1.48% for earn-out bids against 1.07%, significant; for private targets 1.49% against 1.22%, not significant, at the median earn-out bids beat cash bids (0.87% against 0.40%) and marginally trailed mixed offers (0.87% against 1.01%); no incremental value in cross-border deals (pp. 688 to 690): "overall earnout bids yield significantly higher returns than non-earnout bids, i.e. 1.48% versus 1.07%"; "earnout bids perform better than non-earnout bids (mean of 1.49% vs. 1.22%) but the difference is"; "earnout bids significantly outperform cash bids (median of 0.87% vs. 0.40%)"; "marginally underperform mixed offers (median of 0.87% vs. 1.01%)"; "in CBA, the use of earnout generates no incremental value relative to non-earnout"Barbopoulos and Sudarsanam (2012)
- A A verified against the printed page of the primary sourceB primary source, text layer onlyC authoritative secondaryD reported Long run: the authors claim post-acquisition gains, but in calendar-time portfolios earn-out acquirers do not outperform in any of years one to three; only model-optimal use earns 0.51% a month in year one, exhausted by year two; BHAR regressions show gains for correct use (pp. 678, 691, 692): "enhances acquirer value during the announcement and post-acquisition periods"; "earnout acquirers do not outperform non-earnout acquirers in any of the three periods"; "optimal use of earnout generates a significant 0.51% return in the first year"; "the value benefits of optimal earnout use are exhausted by year 2"; "bidders making the correct use of earnout in a deal"Barbopoulos and Sudarsanam (2012)
- A A verified against the printed page of the primary sourceB primary source, text layer onlyC authoritative secondaryD reported The 'correct currency' classification behind the optimal-use results is an in-sample prediction from the paper's own logit model (p. 685, fn. 25): "We note that the ‘prediction’ is in-sample ‘prediction’ and not out-of-sample"Barbopoulos and Sudarsanam (2012)
- A A verified against the printed page of the primary sourceB primary source, text layer onlyC authoritative secondaryD reported A systematic review of 64 earn-out papers from 1970 to 2023 in three streams: motives, implications and contract structure (PDF p. 1): "mapping the scattered research landscape by analyzing 64 papers published between 1970 and 2023"Dahlen (2024)
- A A verified against the printed page of the primary sourceB primary source, text layer onlyC authoritative secondaryD reported Listing status and target industry are the robust determinants; research on implications is skewed to short-term returns; costs are neither classified nor quantified; the share of earn-outs ending in court is unmeasured; actual payouts have not been followed up since Kohers and Ang; value-destroying target behaviour such as cut R&D and acquirer type such as private equity are open; the review reports, from studies not held here, a rise in North American use to as much as 15%, dated before the financial crisis on PDF p. 2 and to the 2010s (a spike, up to 15%) in footnote 5 on PDF p. 6, 27% of UK and 7% of German transactions in an international sample, and a Germany-focused survey in which more than half of respondents use earn-outs in more than half of their deals (PDF pp. 2, 3, 6, 7, 30): "Robust results have been reported for listing status and the industry of the target"; "the scholarly interest in this area is skewed towards short-term abnormal returns"; "no research has attempted either a classification of the costs involved or a quantification of the respective costs"; "Researchers could begin by measuring the share of earnout deals negotiated in court due to legal disputes"; "little scholarly attention has been paid to the actual payout of earnouts"; "no subsequent studies have followed up on their work"; "whether targets engage in (long-term) value-destroying behavior (e.g., decreasing R&D spending)"; "as well as the type of acquirer (e.g., private equity)"; "this share increased to 15% before the financial crisis"; "Bates et al. (2018) report a spike in earnout use in the 2010s, up to 15% of transactions"; "27% of transactions in the UK involved earnouts, whereas only 7% of transactions in Germany involved an earnout"; "More than half of the respondents stated that they use earnouts in more than half of their transactions"Dahlen (2024)
- A A verified against the printed page of the primary sourceB primary source, text layer onlyC authoritative secondaryD reported The review's own reading: earn-out deals yield positive short- and long-term abnormal returns (citing Barbopoulos and Sudarsanam among others); two studies attempt to measure retention, one finding earn-out fair value at the maximum payout where the parties aim to retain managers, the other, with a related study, higher announcement returns where deals can retain managers; one study of earn-outs and synergies, on Chinese deals, finds a significantly positive, U-shaped relation with earn-out size (PDF p. 22, region from Table 2): "Overall, earnout deals yield positive short-term and long-term abnormal returns"; "only two studies attempt to measure this effect"; "earnout fair value meets the maximum possible earnout payout when the parties attempt to retain managers"; "when earnout deals are capable of retaining managers (or founders), they yield higher abnormal returns during the announcement period"; "only He and Chen (2022) have focused on earnouts in this context"; "they find a significantly positive relationship that follows a U-shaped pattern depending on the earnout size"Dahlen (2024)
From the essay
Go-to-market strategy
What is an earn-out? The part of the price that waits for proof
An earn-out pays part of the price only if the acquired business hits agreed targets. Studies find it in hard-to-value deals; integration can strain it.
Read the essayThis exhibit belongs to an essay: the numbers live here, the argument lives there.
Cite or embed
Related exhibits
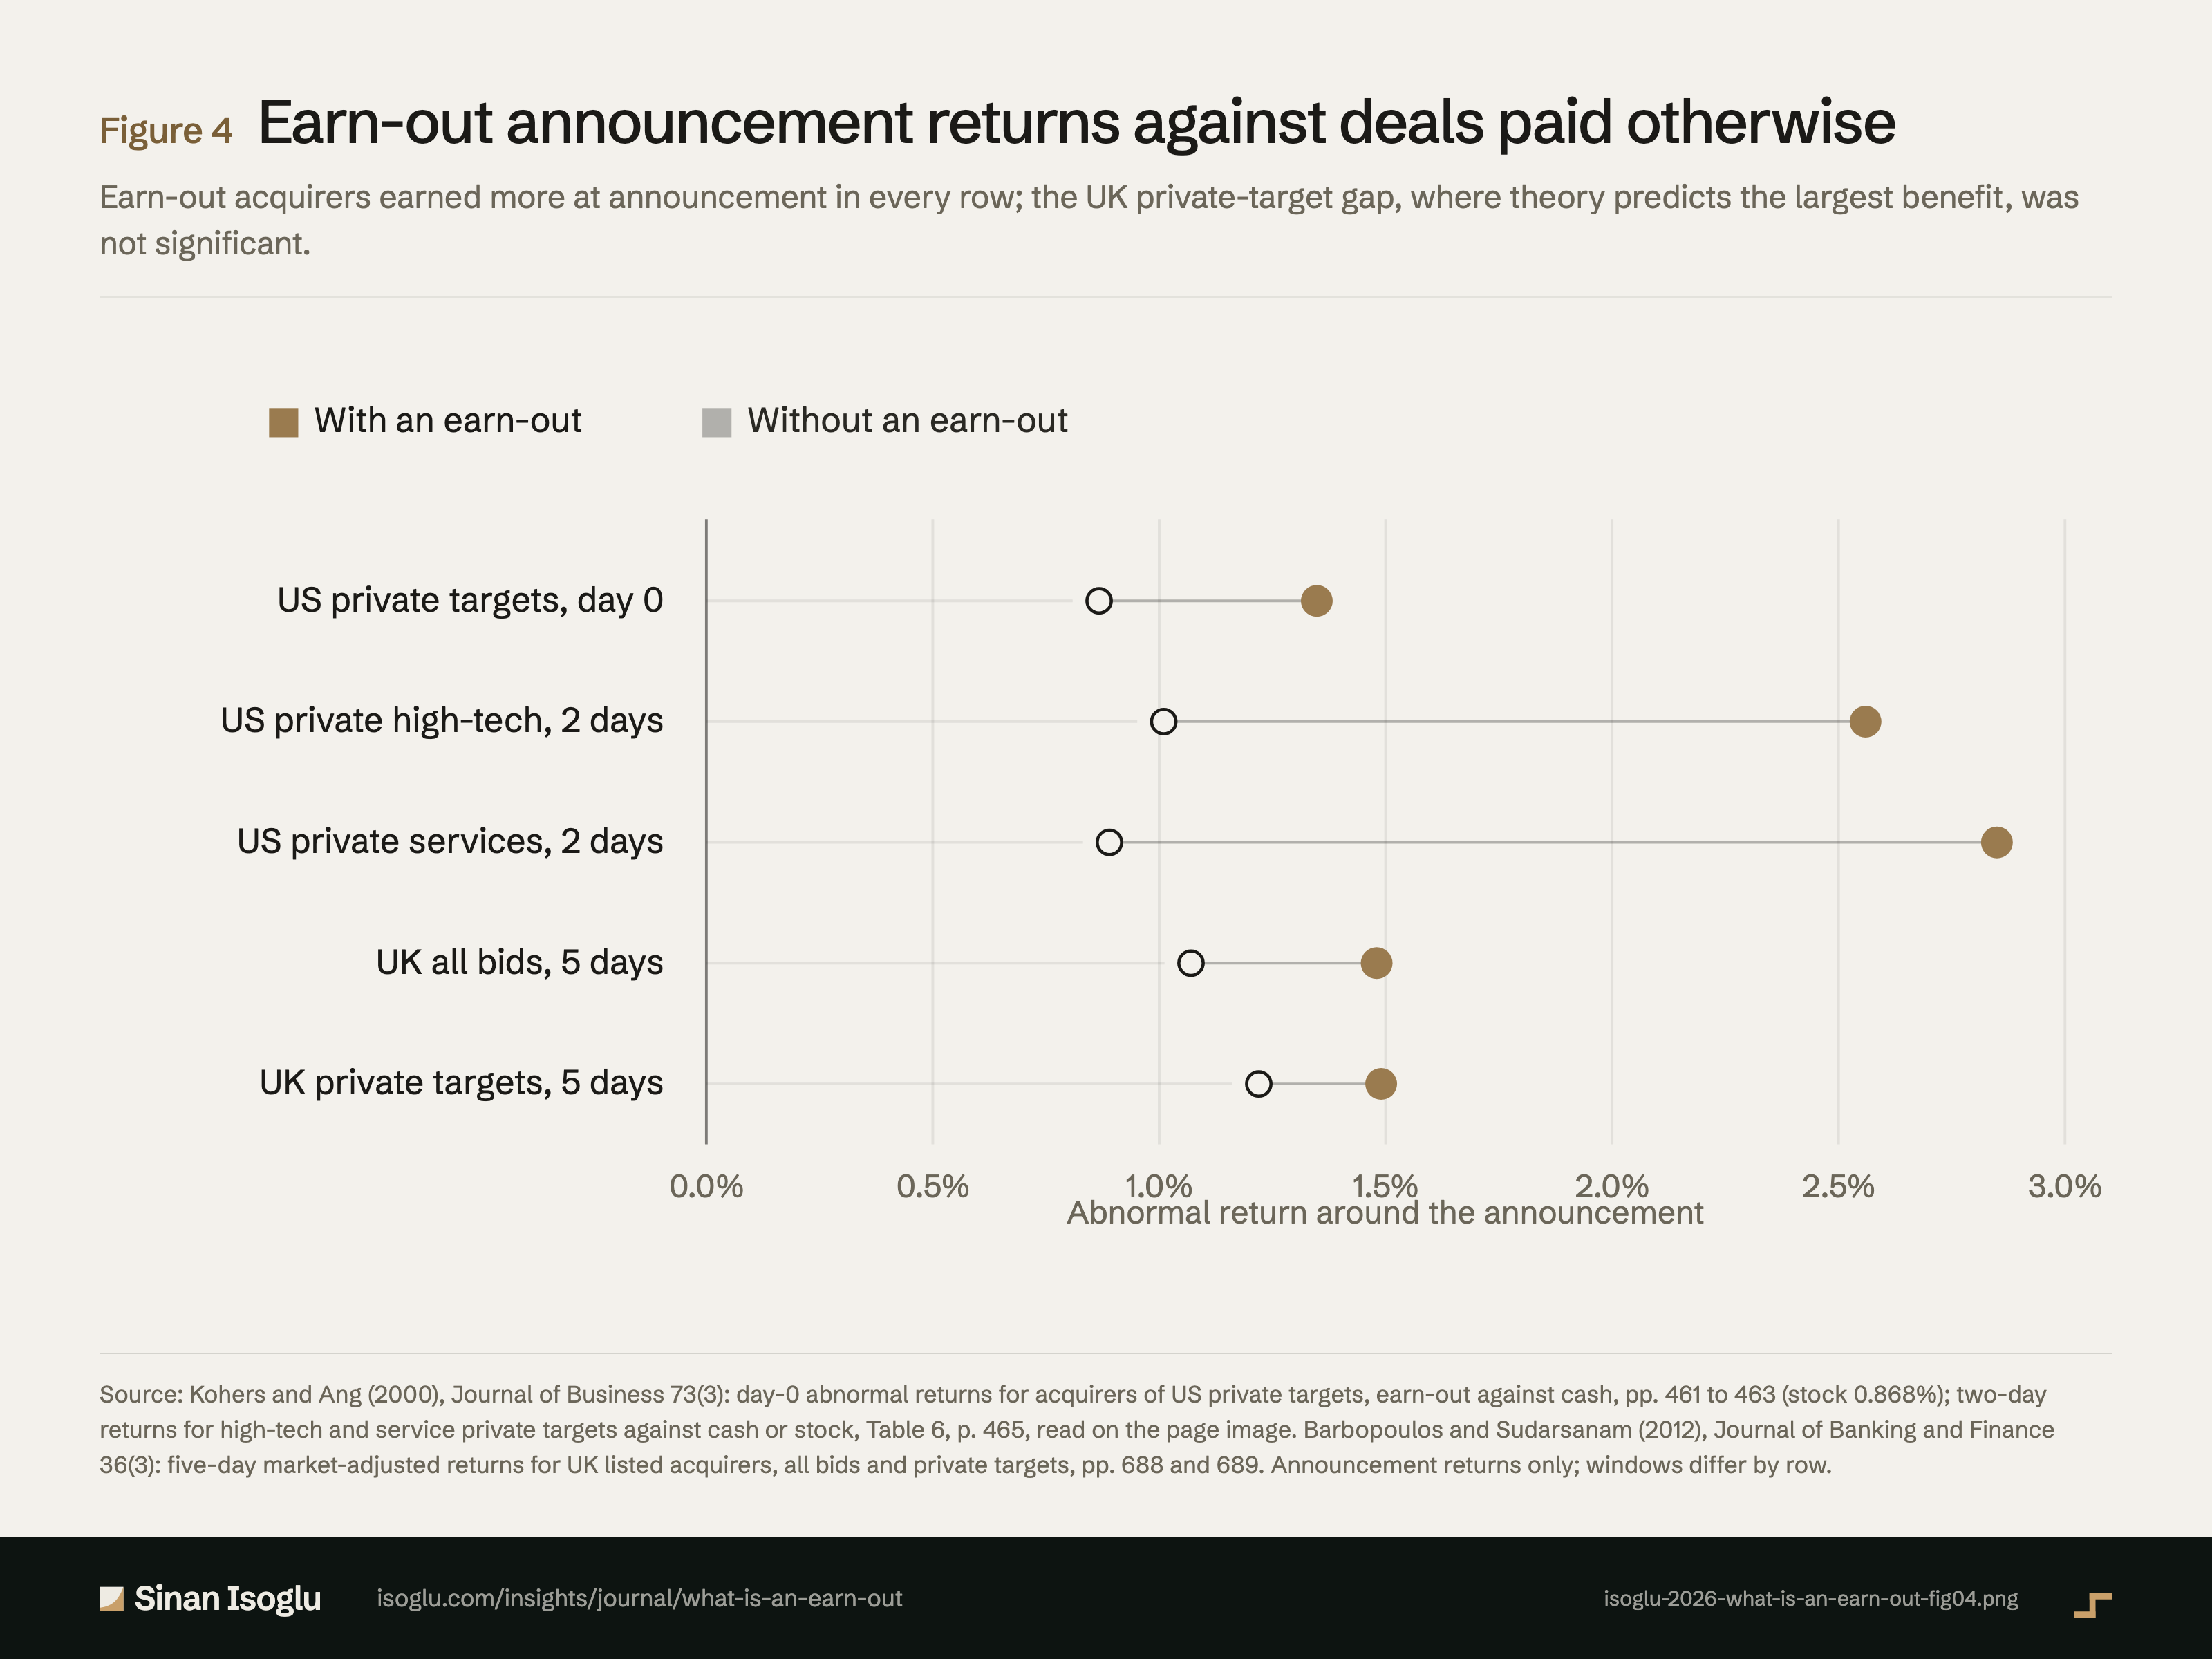
Figure 4Figure
Earn-out announcement returns against deals paid otherwise
What is an earn-out? The part of the price that waits for proof
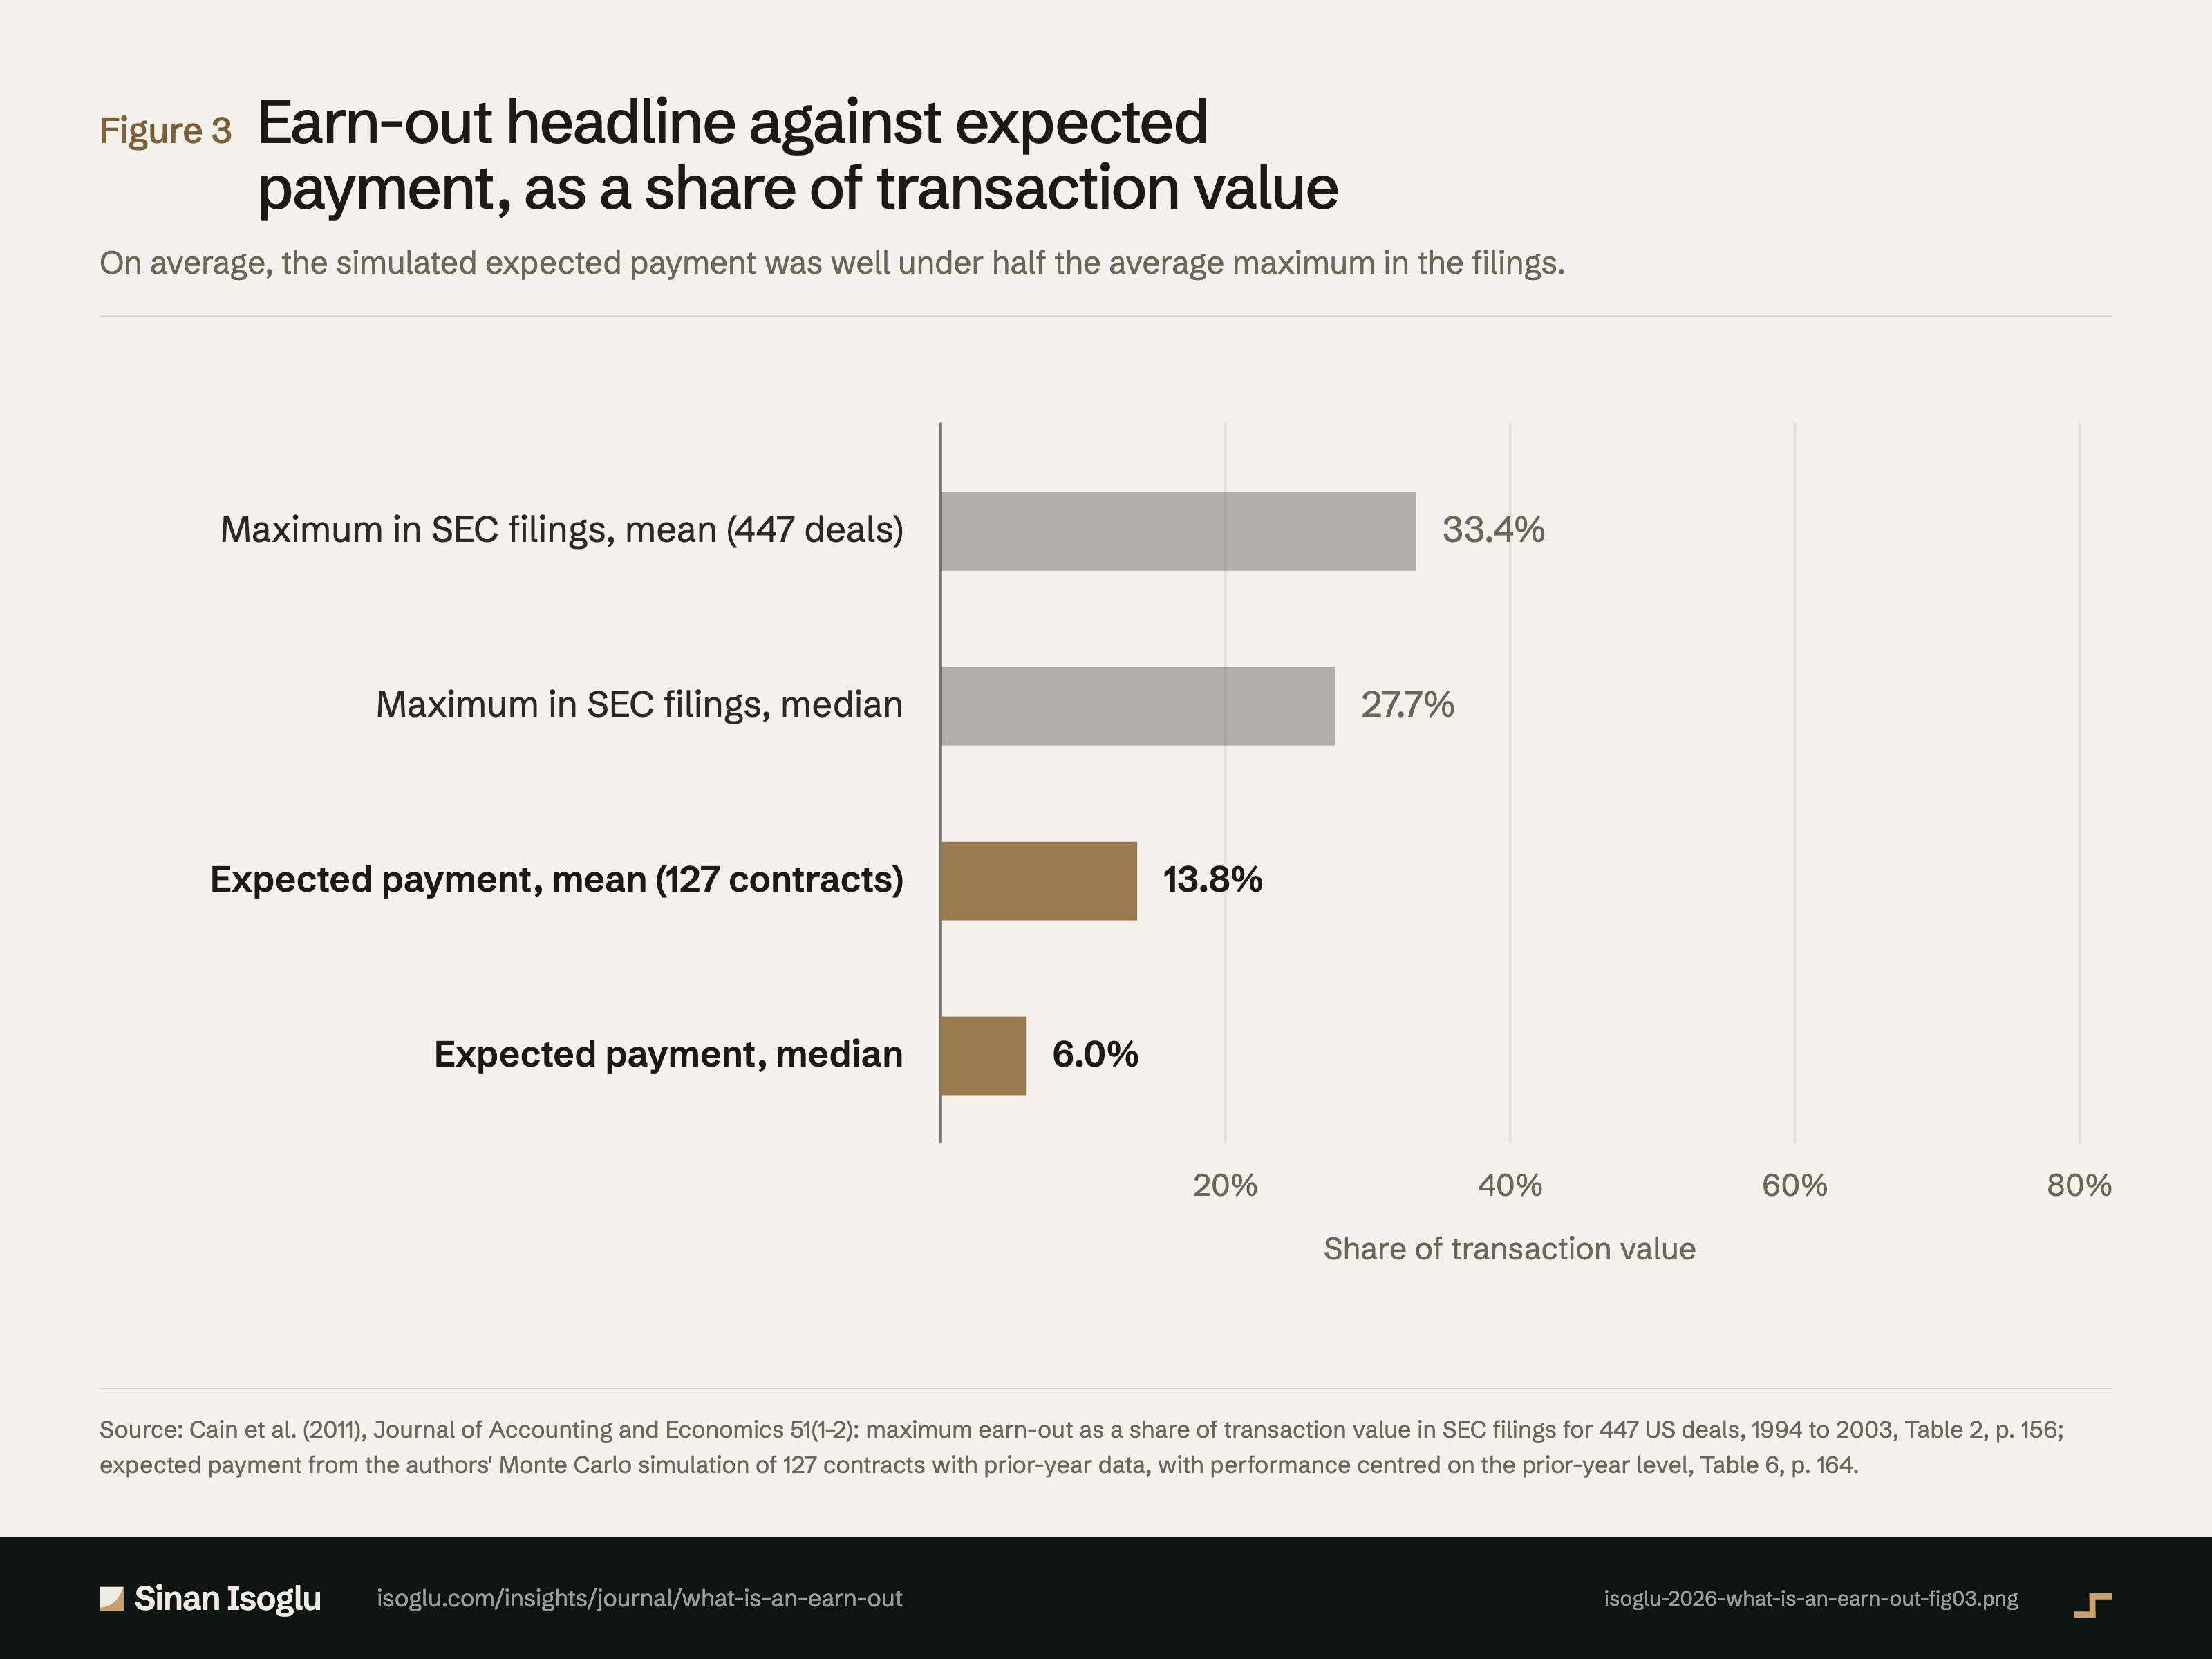
Figure 3Figure
Earn-out headline against expected payment, as a share of transaction value
What is an earn-out? The part of the price that waits for proof
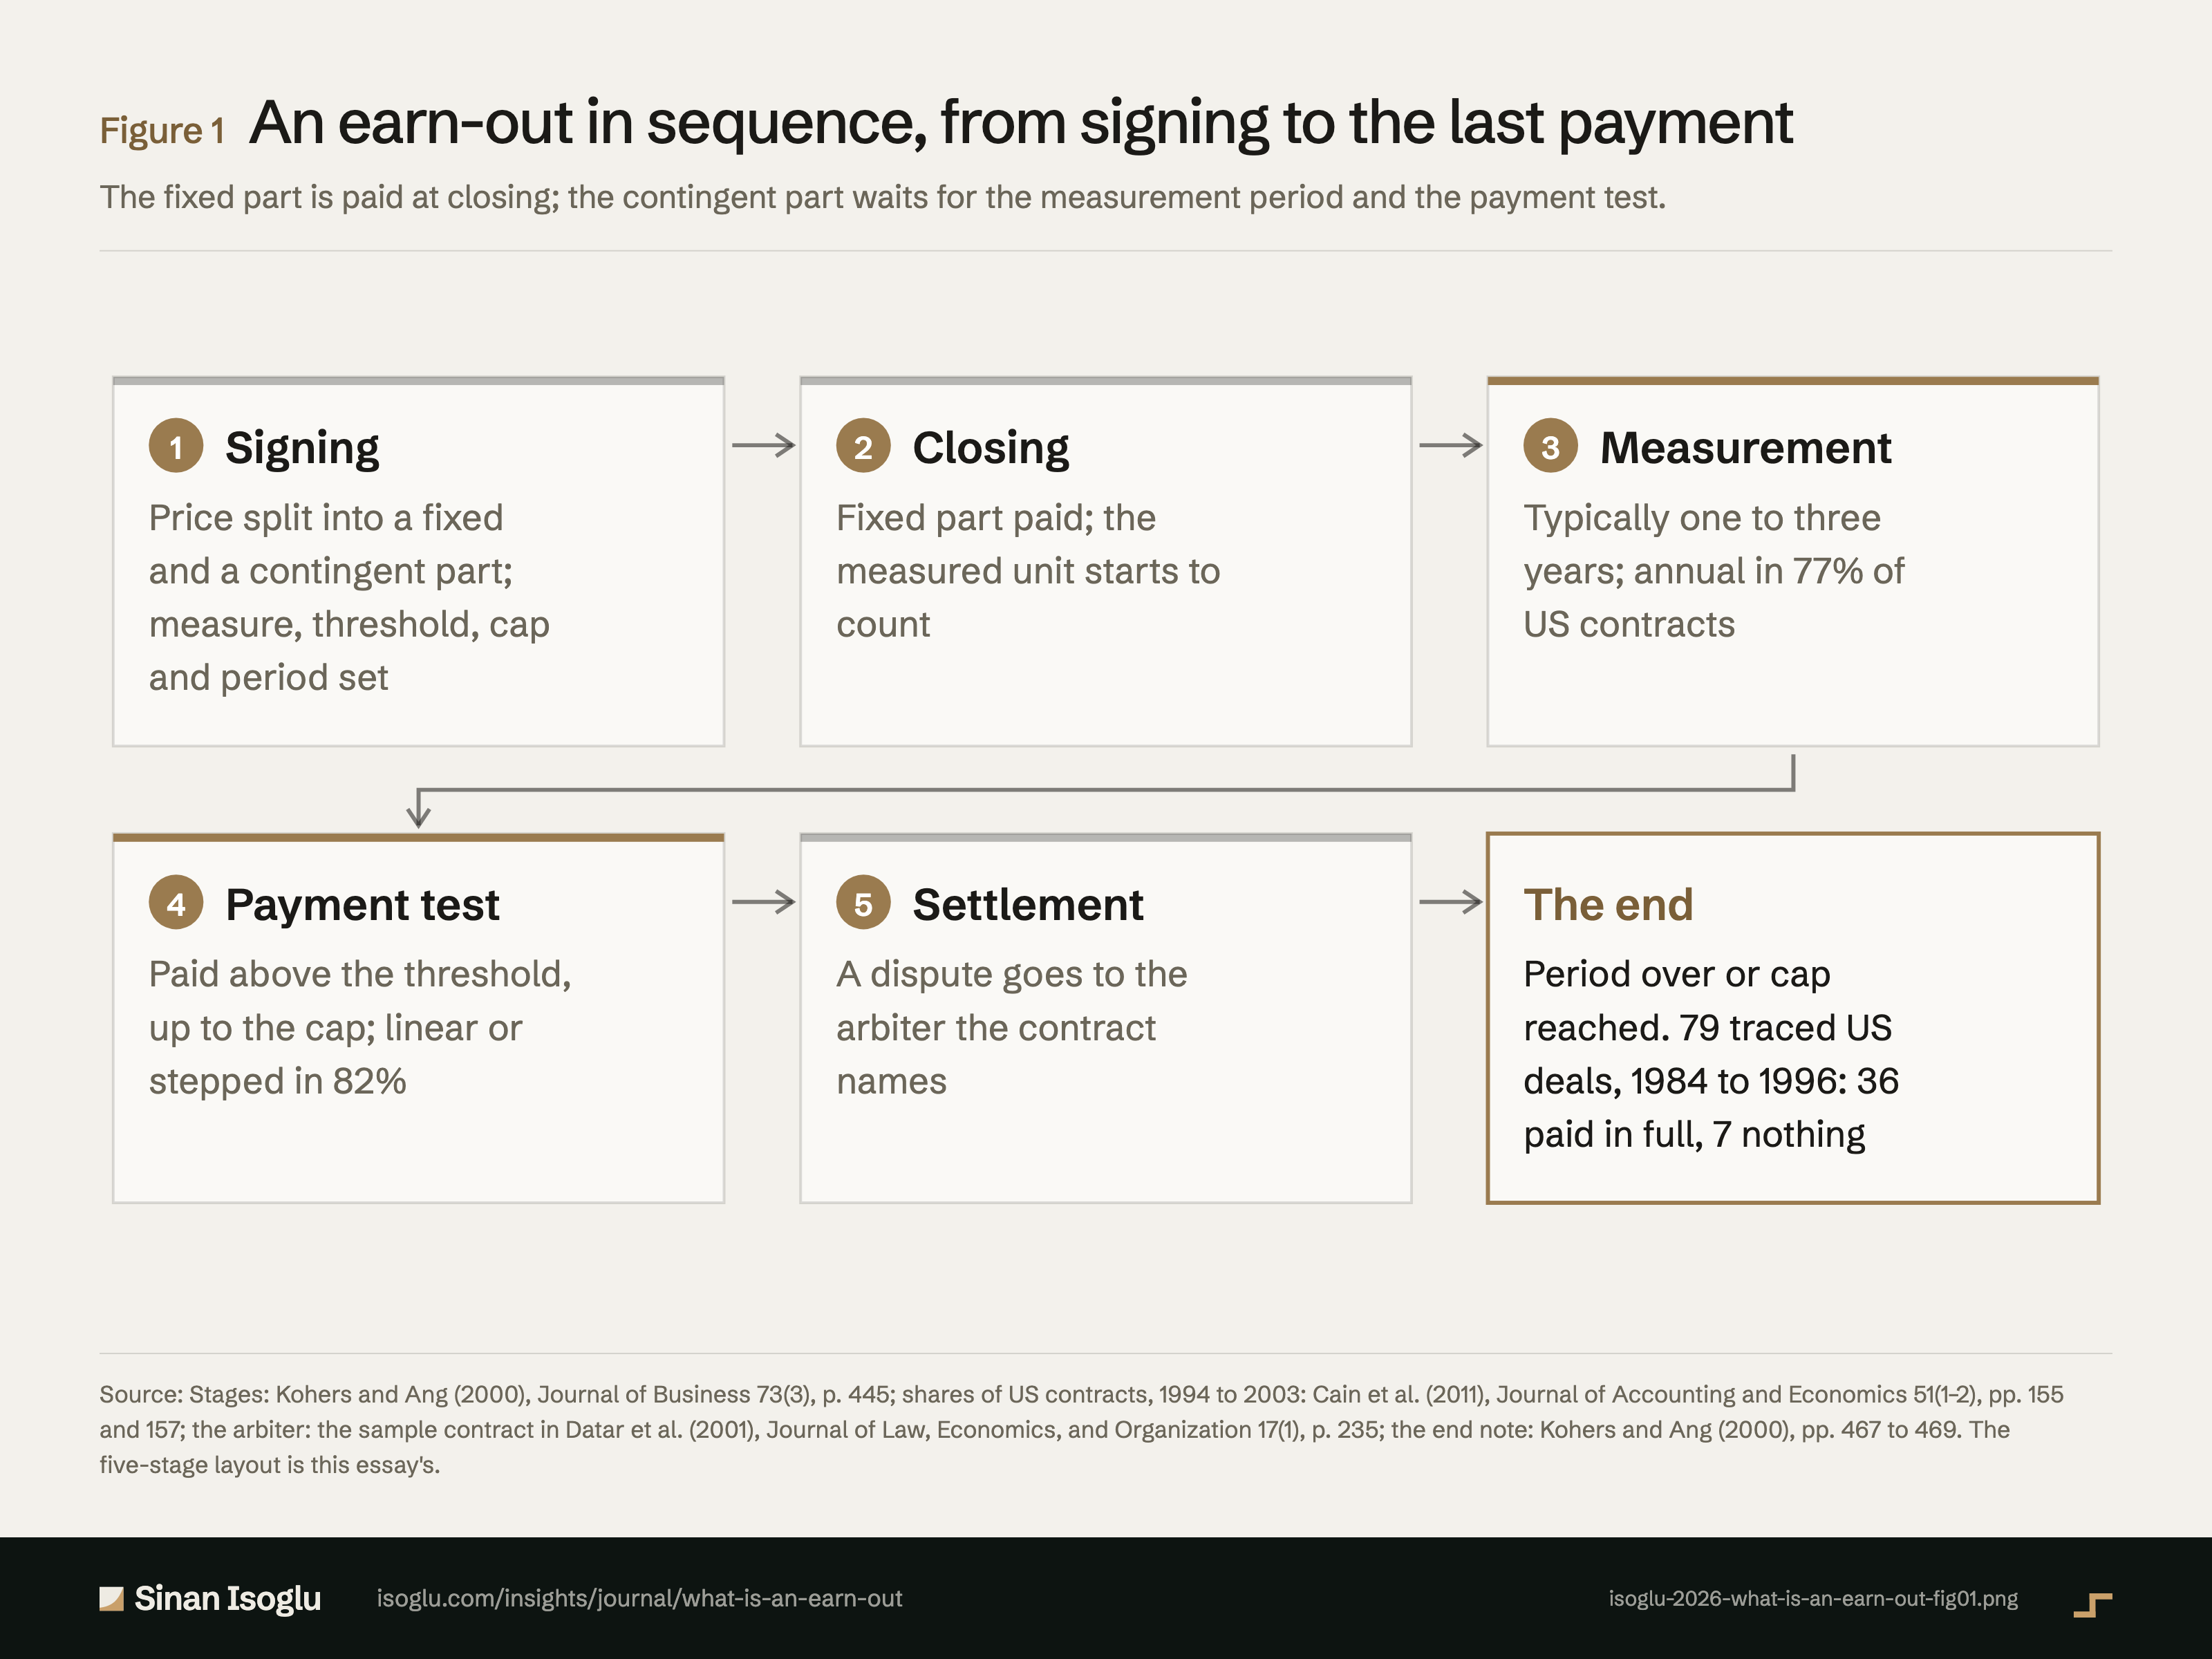
Figure 1Figure
An earn-out in sequence, from signing to the last payment
What is an earn-out? The part of the price that waits for proof
Contact
Bring the question you're working on.
Research, a guest lecture, or a commercial question.