Abbildung 2Aus „Was ist ein Earn-Out? Der Preisteil, der sich erst beweisen muss“
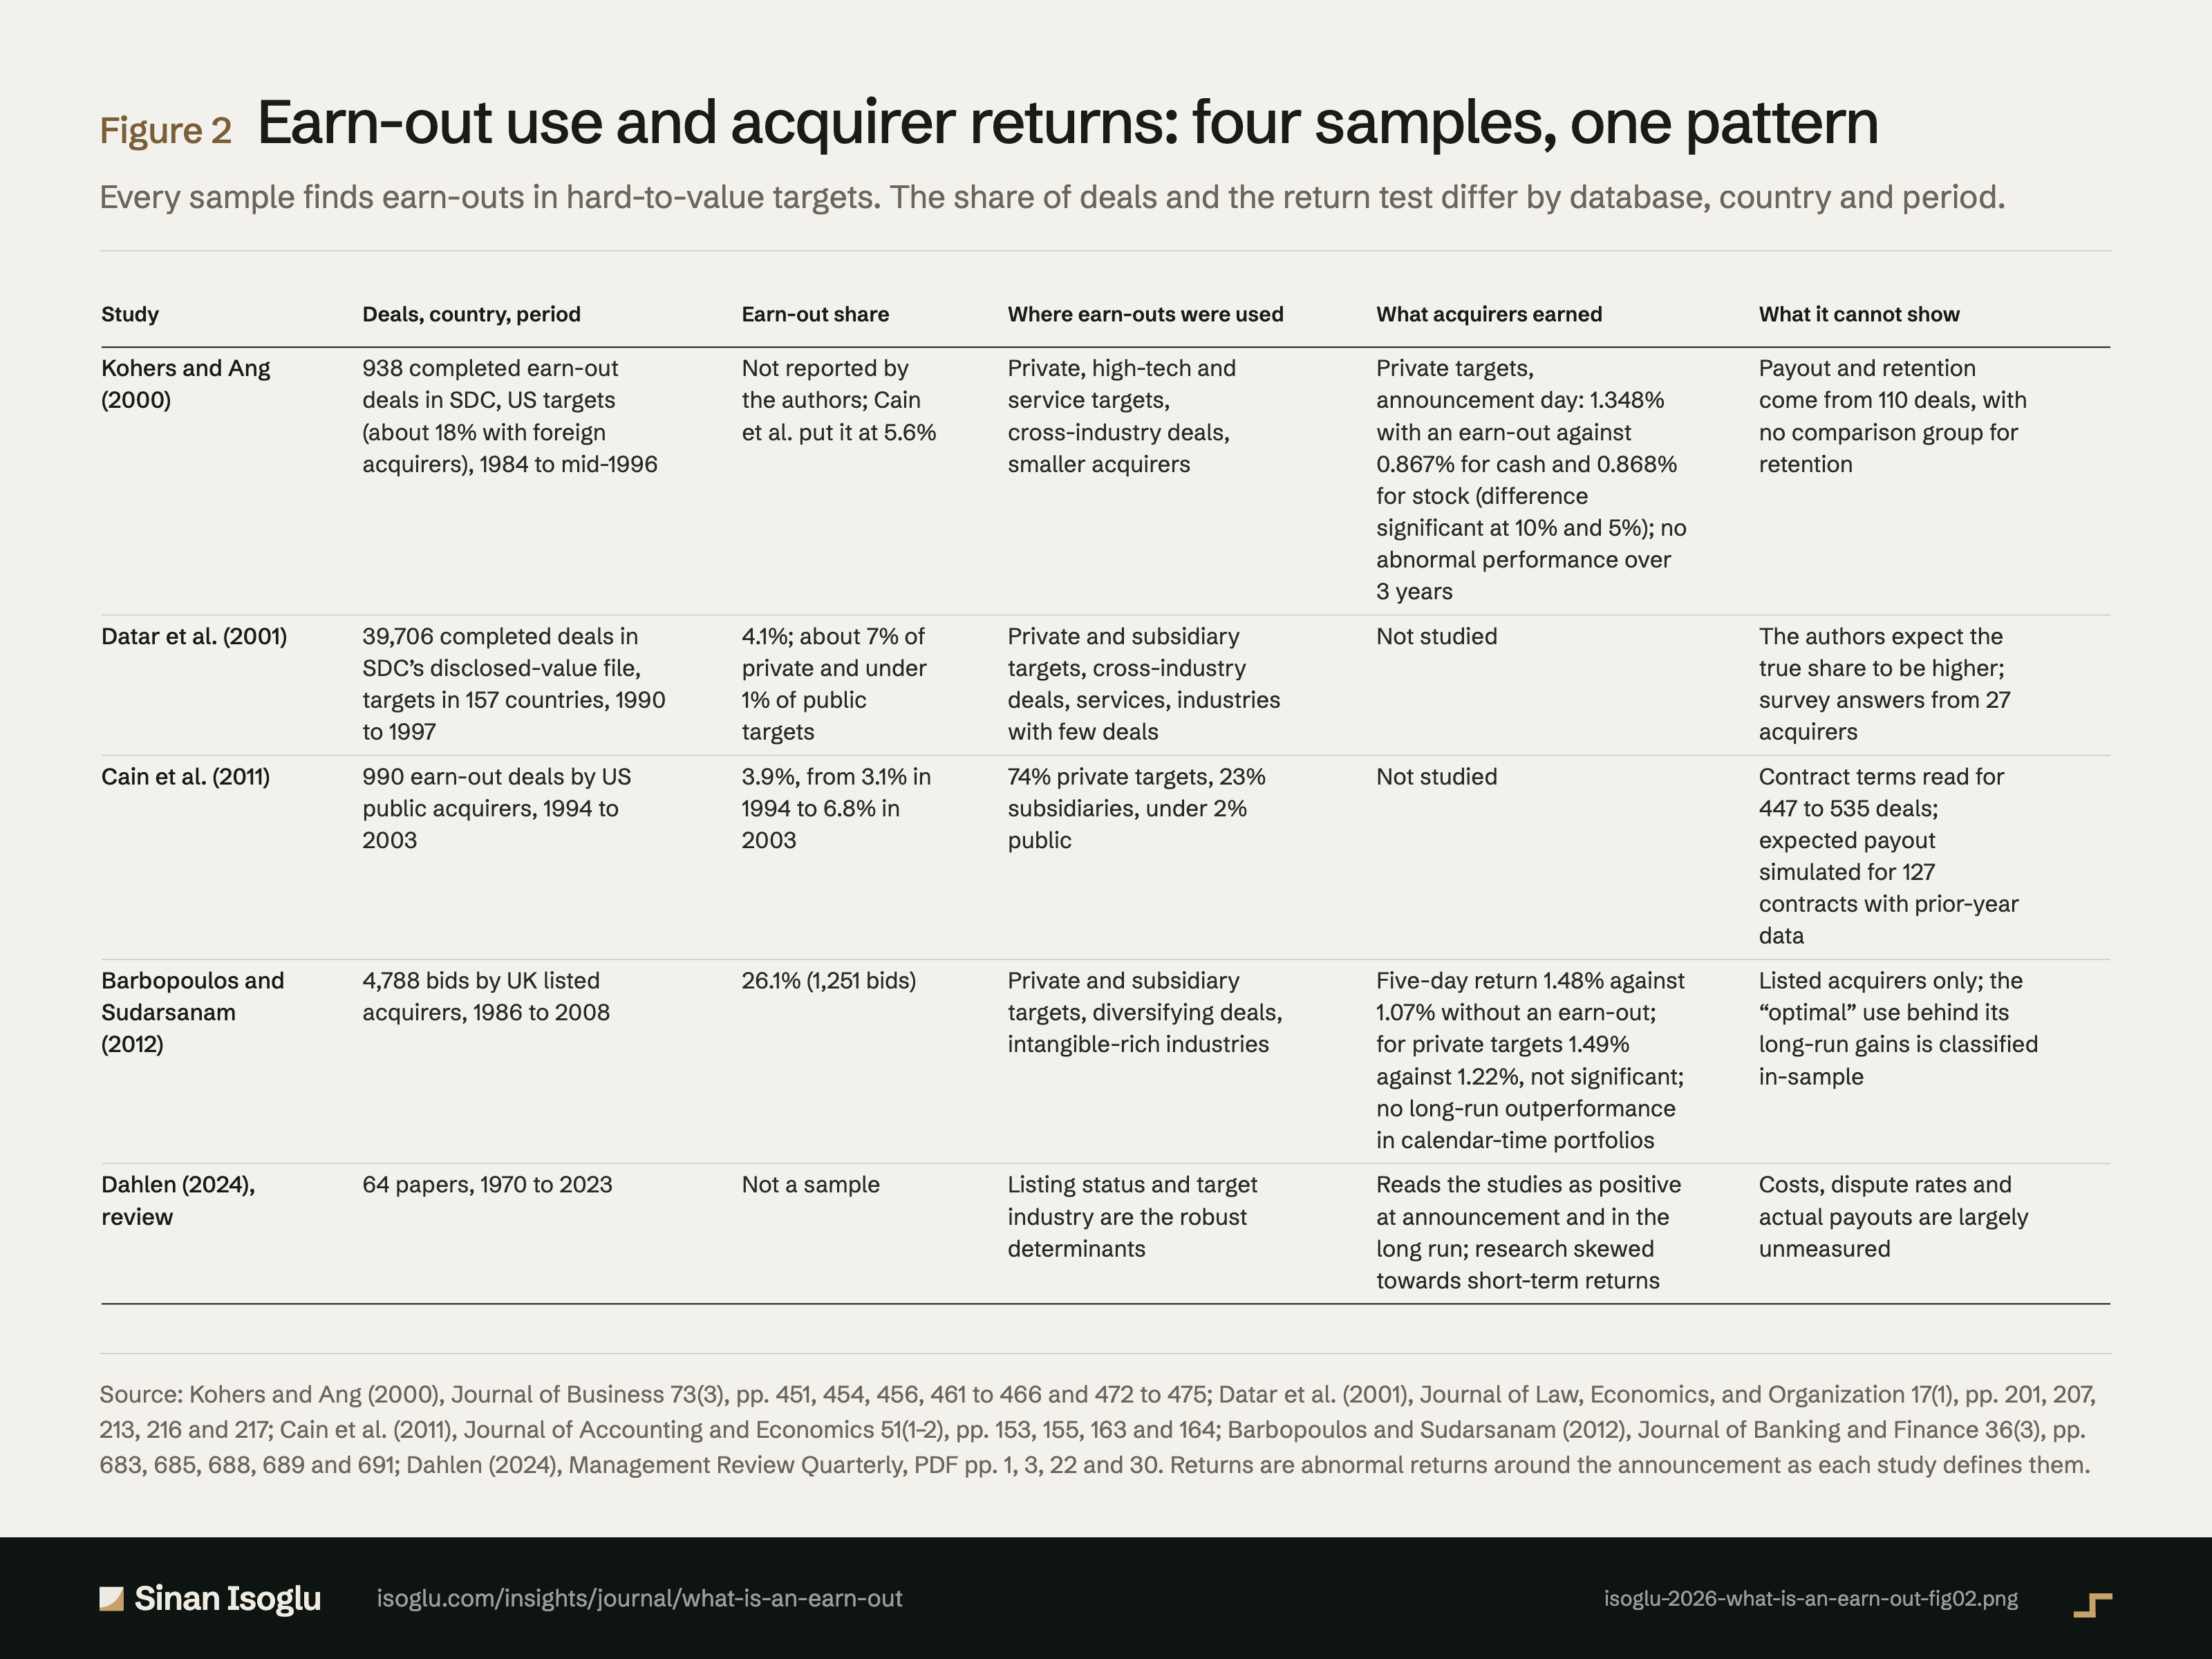
Earn-Out-Nutzung und Käuferrenditen: vier Stichproben, ein Muster
Jede Stichprobe findet Earn-Outs bei schwer bewertbaren Zielunternehmen. Anteil und Renditetest unterscheiden sich nach Datenbank, Land und Zeitraum.
Abbildung 2Earn-Out-Nutzung und Käuferrenditen: vier Stichproben, ein Muster
| Studie | Übernahmen, Land, Zeitraum | Earn-Out-Anteil | Wo Earn-Outs genutzt wurden | Rendite der Käufer | Was sie nicht zeigt |
|---|---|---|---|---|---|
| Kohers und Ang (2000) | 938 abgeschlossene Earn-Out-Übernahmen in SDC, US-Zielunternehmen (etwa 18 % mit ausländischem Käufer), 1984 bis Mitte 1996 | Von den Autoren nicht angegeben; Cain u. a. beziffern ihn auf 5,6 % | Nicht börsennotierte Zielunternehmen, Technologie und Dienstleistung, branchenfremde Übernahmen, kleinere Käufer | Nicht börsennotierte Zielunternehmen, Ankündigungstag: 1,348 % mit Earn-Out gegenüber 0,867 % bei Barzahlung und 0,868 % bei Aktien (Unterschied signifikant auf dem 10- und 5-Prozent-Niveau); keine abnormale Entwicklung über 3 Jahre | Zahlung und Bindung stammen aus 110 Übernahmen, für die Bindung ohne Vergleichsgruppe |
| Datar u. a. (2001) | 39.706 abgeschlossene Übernahmen in der SDC-Datei mit offengelegtem Wert, Zielunternehmen aus 157 Ländern, 1990 bis 1997 | 4,1 %; etwa 7 % der nicht börsennotierten und unter 1 % der börsennotierten Zielunternehmen | Nicht börsennotierte Zielunternehmen und Tochtergesellschaften, branchenfremde Übernahmen, Dienstleistung, Branchen mit wenigen Übernahmen | Nicht untersucht | Die Autoren erwarten einen höheren wahren Anteil; Befragung mit Antworten von 27 Käufern |
| Cain u. a. (2011) | 990 Earn-Out-Übernahmen durch börsennotierte US-Käufer, 1994 bis 2003 | 3,9 %, von 3,1 % 1994 auf 6,8 % 2003 | 74 % nicht börsennotierte Zielunternehmen, 23 % Tochtergesellschaften, unter 2 % börsennotiert | Nicht untersucht | Vertragsbedingungen für 447 bis 535 Übernahmen ausgewertet; erwartete Zahlung für 127 Verträge mit Vorjahreszahlen simuliert |
| Barbopoulos und Sudarsanam (2012) | 4.788 angekündigte Übernahmen börsennotierter britischer Käufer, 1986 bis 2008 | 26,1 % (1.251 Übernahmen) | Nicht börsennotierte Zielunternehmen und Tochtergesellschaften, diversifizierende Übernahmen, Branchen mit hohem immateriellem Anteil | Fünftagesrendite 1,48 % gegenüber 1,07 % ohne Earn-Out; bei nicht börsennotierten Zielunternehmen 1,49 % gegenüber 1,22 %, nicht signifikant; keine langfristige Überrendite in Kalenderzeit-Portfolios | Nur börsennotierte Käufer; die „optimale“ Nutzung hinter den langfristigen Gewinnen ist innerhalb der Stichprobe klassifiziert |
| Dahlen (2024), Übersicht | 64 Aufsätze, 1970 bis 2023 | Keine Stichprobe | Börsenstatus und Branche des Zielunternehmens sind die robusten Einflussgrößen | Liest die Studien als positiv bei der Ankündigung und langfristig; die Forschung konzentriert sich auf kurzfristige Renditen | Kosten, Streitquoten und tatsächliche Zahlungen sind weitgehend nicht gemessen |
Bei breiten Tabellen horizontal wischen oder scrollen.
Quelle: Kohers und Ang (2000), Journal of Business 73(3), S. 451, 454, 456, 461 bis 466 und 472 bis 475; Datar u. a. (2001), Journal of Law, Economics, and Organization 17(1), S. 201, 207, 213, 216 und 217; Cain u. a. (2011), Journal of Accounting and Economics 51(1–2), S. 153, 155, 163 und 164; Barbopoulos und Sudarsanam (2012), Journal of Banking and Finance 36(3), S. 683, 685, 688, 689 und 691; Dahlen (2024), Management Review Quarterly, PDF-S. 1, 3, 22 und 30. Renditen sind abnormale Renditen um die Ankündigung, wie jede Studie sie definiert.
Quelle und Evidenz
Jede Zeile nennt eine Aussage zu dieser Abbildung, ihre Quelle und die Art ihrer Prüfung.
- A A gegen die gedruckte Seite der Primärquelle geprüftB Primärquelle, nur TextebeneC belastbare SekundärquelleD berichtet The sample: 938 completed earn-out takeovers in SDC from 1 January 1984 to 30 June 1996, US targets, 620 private and 275 divested subsidiaries; about 18% with foreign acquirers (pp. 451, 454): "completed takeovers using earnouts over the period from January 1, 1984, to June 30, 1996"; "In total, 938 mergers using earnouts as a means of payment are reported"; "620 of the 938 earnout deals involve private targets, while 275 of the total reflect the acquisition of divested subsidiaries"; "occurred between a U.S. target and an acquirer from another country"Kohers and Ang (2000)
- A A gegen die gedruckte Seite der Primärquelle geprüftB Primärquelle, nur TextebeneC belastbare SekundärquelleD berichtet In logit models of private and subsidiary deals, earn-out odds are almost 70% higher for high-tech targets, about 86% higher for service firms, about 72% higher for private targets than subsidiaries and about 30% lower within an industry; smaller acquirers and relatively large targets use them more (pp. 456, 457): "the odds of using earnouts in high-tech acquisitions are almost 70% higher"; "the odds of earnout use are about 86% higher in takeovers of service firms"; "by about 72% when the target is a privately held firm as opposed to a divested subsidiary"; "are about 30% less than that in diversification takeovers"; "smaller acquiring firms are more likely to employ earnouts than are larger companies"; "larger private targets and subsidiary targets, relative to their acquirers, have a higher likelihood of being paid with earnout payments"Kohers and Ang (2000)
- A A gegen die gedruckte Seite der Primärquelle geprüftB Primärquelle, nur TextebeneC belastbare SekundärquelleD berichtet Announcement returns: 1.356% on day 0 for 449 bidders; for private targets 1.348% with an earn-out against 0.867% for cash and 0.868% for stock, significant at the 10% level against cash (p = .0727) and the 5% level against stock (p = .0493) (the difference tests carry no stated sidedness; the one-sided note to Table 4, p. 463, covers each group's own t-statistics); larger for earn-outs in high-asymmetry private deals over two days (Table 6, p. 465, read on the page image: high-tech 2.56% against 1.01%, service 2.85% against 0.89%); no difference for divested subsidiaries (pp. 461 to 466): "the average abnormal return on day 0, the original merger announcement date, is 1.356%"; "the average abnormal return for the earnout subsample is 1.348%"; "significantly greater than the reaction to cash offers at the 10% level"; "significantly larger than that for stock offers at the 5% level"; "in high-tech takeovers, bidders using earnouts experience larger abnormal returns than bidders that chose either cash or stock"; "show no differences in the CARs for mergers using earnout contracts as opposed to cash or stock"Kohers and Ang (2000)
- A A gegen die gedruckte Seite der Primärquelle geprüftB Primärquelle, nur TextebeneC belastbare SekundärquelleD berichtet Over three years in calendar-time portfolios, acquirers using earn-outs show no abnormal performance, so the announcement gain is not reversed (pp. 473 to 475): "the ex ante benefits of earnouts are not reversed in the long run"; "no significant abnormal postmerger performance for acquirers using earnouts"Kohers and Ang (2000)
- A A gegen die gedruckte Seite der Primärquelle geprüftB Primärquelle, nur TextebeneC belastbare SekundärquelleD berichtet In 39,706 completed SDC acquisitions from 1990 to 1997, 4.1% carried a reported earn-out, about 7% of private and under 1% of public targets; the true share is likely far higher (pp. 213, 216, 217): "The final sample contains 39,706 acquisitions, including targets in 157 countries"; "The overall percentage of transactions involving reported earnouts is 4.1%"; "is likely to be far higher than the percentage produced by this analysis of the SDC database"; "approximately 7% of acquisitions of private companies utilize earnouts, compared to less than 1%"Datar, Frankel and Wolfson (2001)
- A A gegen die gedruckte Seite der Primärquelle geprüftB Primärquelle, nur TextebeneC belastbare SekundärquelleD berichtet 990 earn-outs among 25,213 acquisitions by US public acquirers from 1994 to 2003 (3.9%), rising from 3.1% to 6.8%; the authors put Kohers and Ang's rate at 5.6%; targets 74% private, 23% subsidiaries, under 2% public (p. 153): "Of this set, SDC identifies 990, or 3.9%, that include an earnout as part of the acquisition agreement"; "completed by publicly traded U.S. corporations between 1994 and 2003"; "the 5.6% observed in Kohers and Ang (2000)"; "the rate of earnout use has increased over the sample period from 3.1% in 1994 to 6.8% in 2003"; "fewer than 2% of the target companies are publicly traded"; "predominantly private companies (74%) and subsidiaries of public companies (23%)"Cain, Denis and Denis (2011)
- A A gegen die gedruckte Seite der Primärquelle geprüftB Primärquelle, nur TextebeneC belastbare SekundärquelleD berichtet A Monte Carlo of 127 contracts with prior-year data, drawing performance from a distribution centred on the prior-year level (no growth), puts the expected payment at 13.8% of transaction value on average (median 6.0%, Table 6, p. 164, read on the page image) against the SDC-recorded 32.7% for all deals; about 19% expect zero; the SDC figures are an upper bound in most acquisitions (pp. 163, 164): "assuming a normal distribution with a mean equal to the pre-acquisition performance level"; "the expected earnout payment is equal to $2.4 million and constitutes 13.8% of the total transaction value"; "the SDC-reported earnout contracts represented an average amount of $22.3 million, or 32.7% of transaction value"; "these numbers appear to represent an upper bound, rather than an expectation of the potential earnout payoffs in most acquisitions"; "about 19% of our sample firms exhibit an expected earnout payoff of zero"Cain, Denis and Denis (2011)
- A A gegen die gedruckte Seite der Primärquelle geprüftB Primärquelle, nur TextebeneC belastbare SekundärquelleD berichtet UK sample: 4,788 bids by LSE-listed acquirers announced 1986 to 2008, 26% with an earn-out, far above US rates, linked to the larger share of private targets in UK deals; 1,045 of the 1,251 earn-out targets private (Table 6, p. 688, read on the page image); contracts average about two years (pp. 679, 682, 683): "takeover bids announced by UK firms between 01/01/1986 and 31/12/2008"; "the acquirer is a UK company listed on the London Stock Exchange"; "4788 bids remain in the sample"; "The remaining M&A activity (i.e. 26%) involves earnouts as indicated by SDC"; "This is a much higher proportion of earnout use than in the US"; "on a much larger scale than in the US"; "the average length of the earnout contract is approximately 2-years"Barbopoulos and Sudarsanam (2012)
- A A gegen die gedruckte Seite der Primärquelle geprüftB Primärquelle, nur TextebeneC belastbare SekundärquelleD berichtet Older and larger acquirers use earn-outs less; unlisted targets are far more likely to be bought with one; some evidence for diversifying deals; intangible-rich industries have high predicted use (p. 687): "older and larger acquirers tend to make less use of earnout"; "unlisted targets are substantially more likely to be acquired using earnout than listed targets"; "There is some evidence that earnout is more likely in diversifying acquisitions"Barbopoulos and Sudarsanam (2012)
- A A gegen die gedruckte Seite der Primärquelle geprüftB Primärquelle, nur TextebeneC belastbare SekundärquelleD berichtet Five-day announcement returns: 1.48% for earn-out bids against 1.07%, significant; for private targets 1.49% against 1.22%, not significant, at the median earn-out bids beat cash bids (0.87% against 0.40%) and marginally trailed mixed offers (0.87% against 1.01%); no incremental value in cross-border deals (pp. 688 to 690): "overall earnout bids yield significantly higher returns than non-earnout bids, i.e. 1.48% versus 1.07%"; "earnout bids perform better than non-earnout bids (mean of 1.49% vs. 1.22%) but the difference is"; "earnout bids significantly outperform cash bids (median of 0.87% vs. 0.40%)"; "marginally underperform mixed offers (median of 0.87% vs. 1.01%)"; "in CBA, the use of earnout generates no incremental value relative to non-earnout"Barbopoulos and Sudarsanam (2012)
- A A gegen die gedruckte Seite der Primärquelle geprüftB Primärquelle, nur TextebeneC belastbare SekundärquelleD berichtet Long run: the authors claim post-acquisition gains, but in calendar-time portfolios earn-out acquirers do not outperform in any of years one to three; only model-optimal use earns 0.51% a month in year one, exhausted by year two; BHAR regressions show gains for correct use (pp. 678, 691, 692): "enhances acquirer value during the announcement and post-acquisition periods"; "earnout acquirers do not outperform non-earnout acquirers in any of the three periods"; "optimal use of earnout generates a significant 0.51% return in the first year"; "the value benefits of optimal earnout use are exhausted by year 2"; "bidders making the correct use of earnout in a deal"Barbopoulos and Sudarsanam (2012)
- A A gegen die gedruckte Seite der Primärquelle geprüftB Primärquelle, nur TextebeneC belastbare SekundärquelleD berichtet The 'correct currency' classification behind the optimal-use results is an in-sample prediction from the paper's own logit model (p. 685, fn. 25): "We note that the ‘prediction’ is in-sample ‘prediction’ and not out-of-sample"Barbopoulos and Sudarsanam (2012)
- A A gegen die gedruckte Seite der Primärquelle geprüftB Primärquelle, nur TextebeneC belastbare SekundärquelleD berichtet A systematic review of 64 earn-out papers from 1970 to 2023 in three streams: motives, implications and contract structure (PDF p. 1): "mapping the scattered research landscape by analyzing 64 papers published between 1970 and 2023"Dahlen (2024)
- A A gegen die gedruckte Seite der Primärquelle geprüftB Primärquelle, nur TextebeneC belastbare SekundärquelleD berichtet Listing status and target industry are the robust determinants; research on implications is skewed to short-term returns; costs are neither classified nor quantified; the share of earn-outs ending in court is unmeasured; actual payouts have not been followed up since Kohers and Ang; value-destroying target behaviour such as cut R&D and acquirer type such as private equity are open; the review reports, from studies not held here, a rise in North American use to as much as 15%, dated before the financial crisis on PDF p. 2 and to the 2010s (a spike, up to 15%) in footnote 5 on PDF p. 6, 27% of UK and 7% of German transactions in an international sample, and a Germany-focused survey in which more than half of respondents use earn-outs in more than half of their deals (PDF pp. 2, 3, 6, 7, 30): "Robust results have been reported for listing status and the industry of the target"; "the scholarly interest in this area is skewed towards short-term abnormal returns"; "no research has attempted either a classification of the costs involved or a quantification of the respective costs"; "Researchers could begin by measuring the share of earnout deals negotiated in court due to legal disputes"; "little scholarly attention has been paid to the actual payout of earnouts"; "no subsequent studies have followed up on their work"; "whether targets engage in (long-term) value-destroying behavior (e.g., decreasing R&D spending)"; "as well as the type of acquirer (e.g., private equity)"; "this share increased to 15% before the financial crisis"; "Bates et al. (2018) report a spike in earnout use in the 2010s, up to 15% of transactions"; "27% of transactions in the UK involved earnouts, whereas only 7% of transactions in Germany involved an earnout"; "More than half of the respondents stated that they use earnouts in more than half of their transactions"Dahlen (2024)
- A A gegen die gedruckte Seite der Primärquelle geprüftB Primärquelle, nur TextebeneC belastbare SekundärquelleD berichtet The review's own reading: earn-out deals yield positive short- and long-term abnormal returns (citing Barbopoulos and Sudarsanam among others); two studies attempt to measure retention, one finding earn-out fair value at the maximum payout where the parties aim to retain managers, the other, with a related study, higher announcement returns where deals can retain managers; one study of earn-outs and synergies, on Chinese deals, finds a significantly positive, U-shaped relation with earn-out size (PDF p. 22, region from Table 2): "Overall, earnout deals yield positive short-term and long-term abnormal returns"; "only two studies attempt to measure this effect"; "earnout fair value meets the maximum possible earnout payout when the parties attempt to retain managers"; "when earnout deals are capable of retaining managers (or founders), they yield higher abnormal returns during the announcement period"; "only He and Chen (2022) have focused on earnouts in this context"; "they find a significantly positive relationship that follows a U-shaped pattern depending on the earnout size"Dahlen (2024)
Aus dem Beitrag
Go-to-Market-Strategie
Was ist ein Earn-Out? Der Preisteil, der sich erst beweisen muss
Ein Earn-Out zahlt Teile des Kaufpreises erst, wenn das gekaufte Unternehmen Ziele erreicht. Häufig bei schwer bewertbaren Firmen, heikel bei Integration.
Den Beitrag lesenDiese Abbildung gehört zu einem Essay: Die Zahlen stehen hier, das Argument dort.
Zitieren oder einbetten
Verwandte Abbildungen
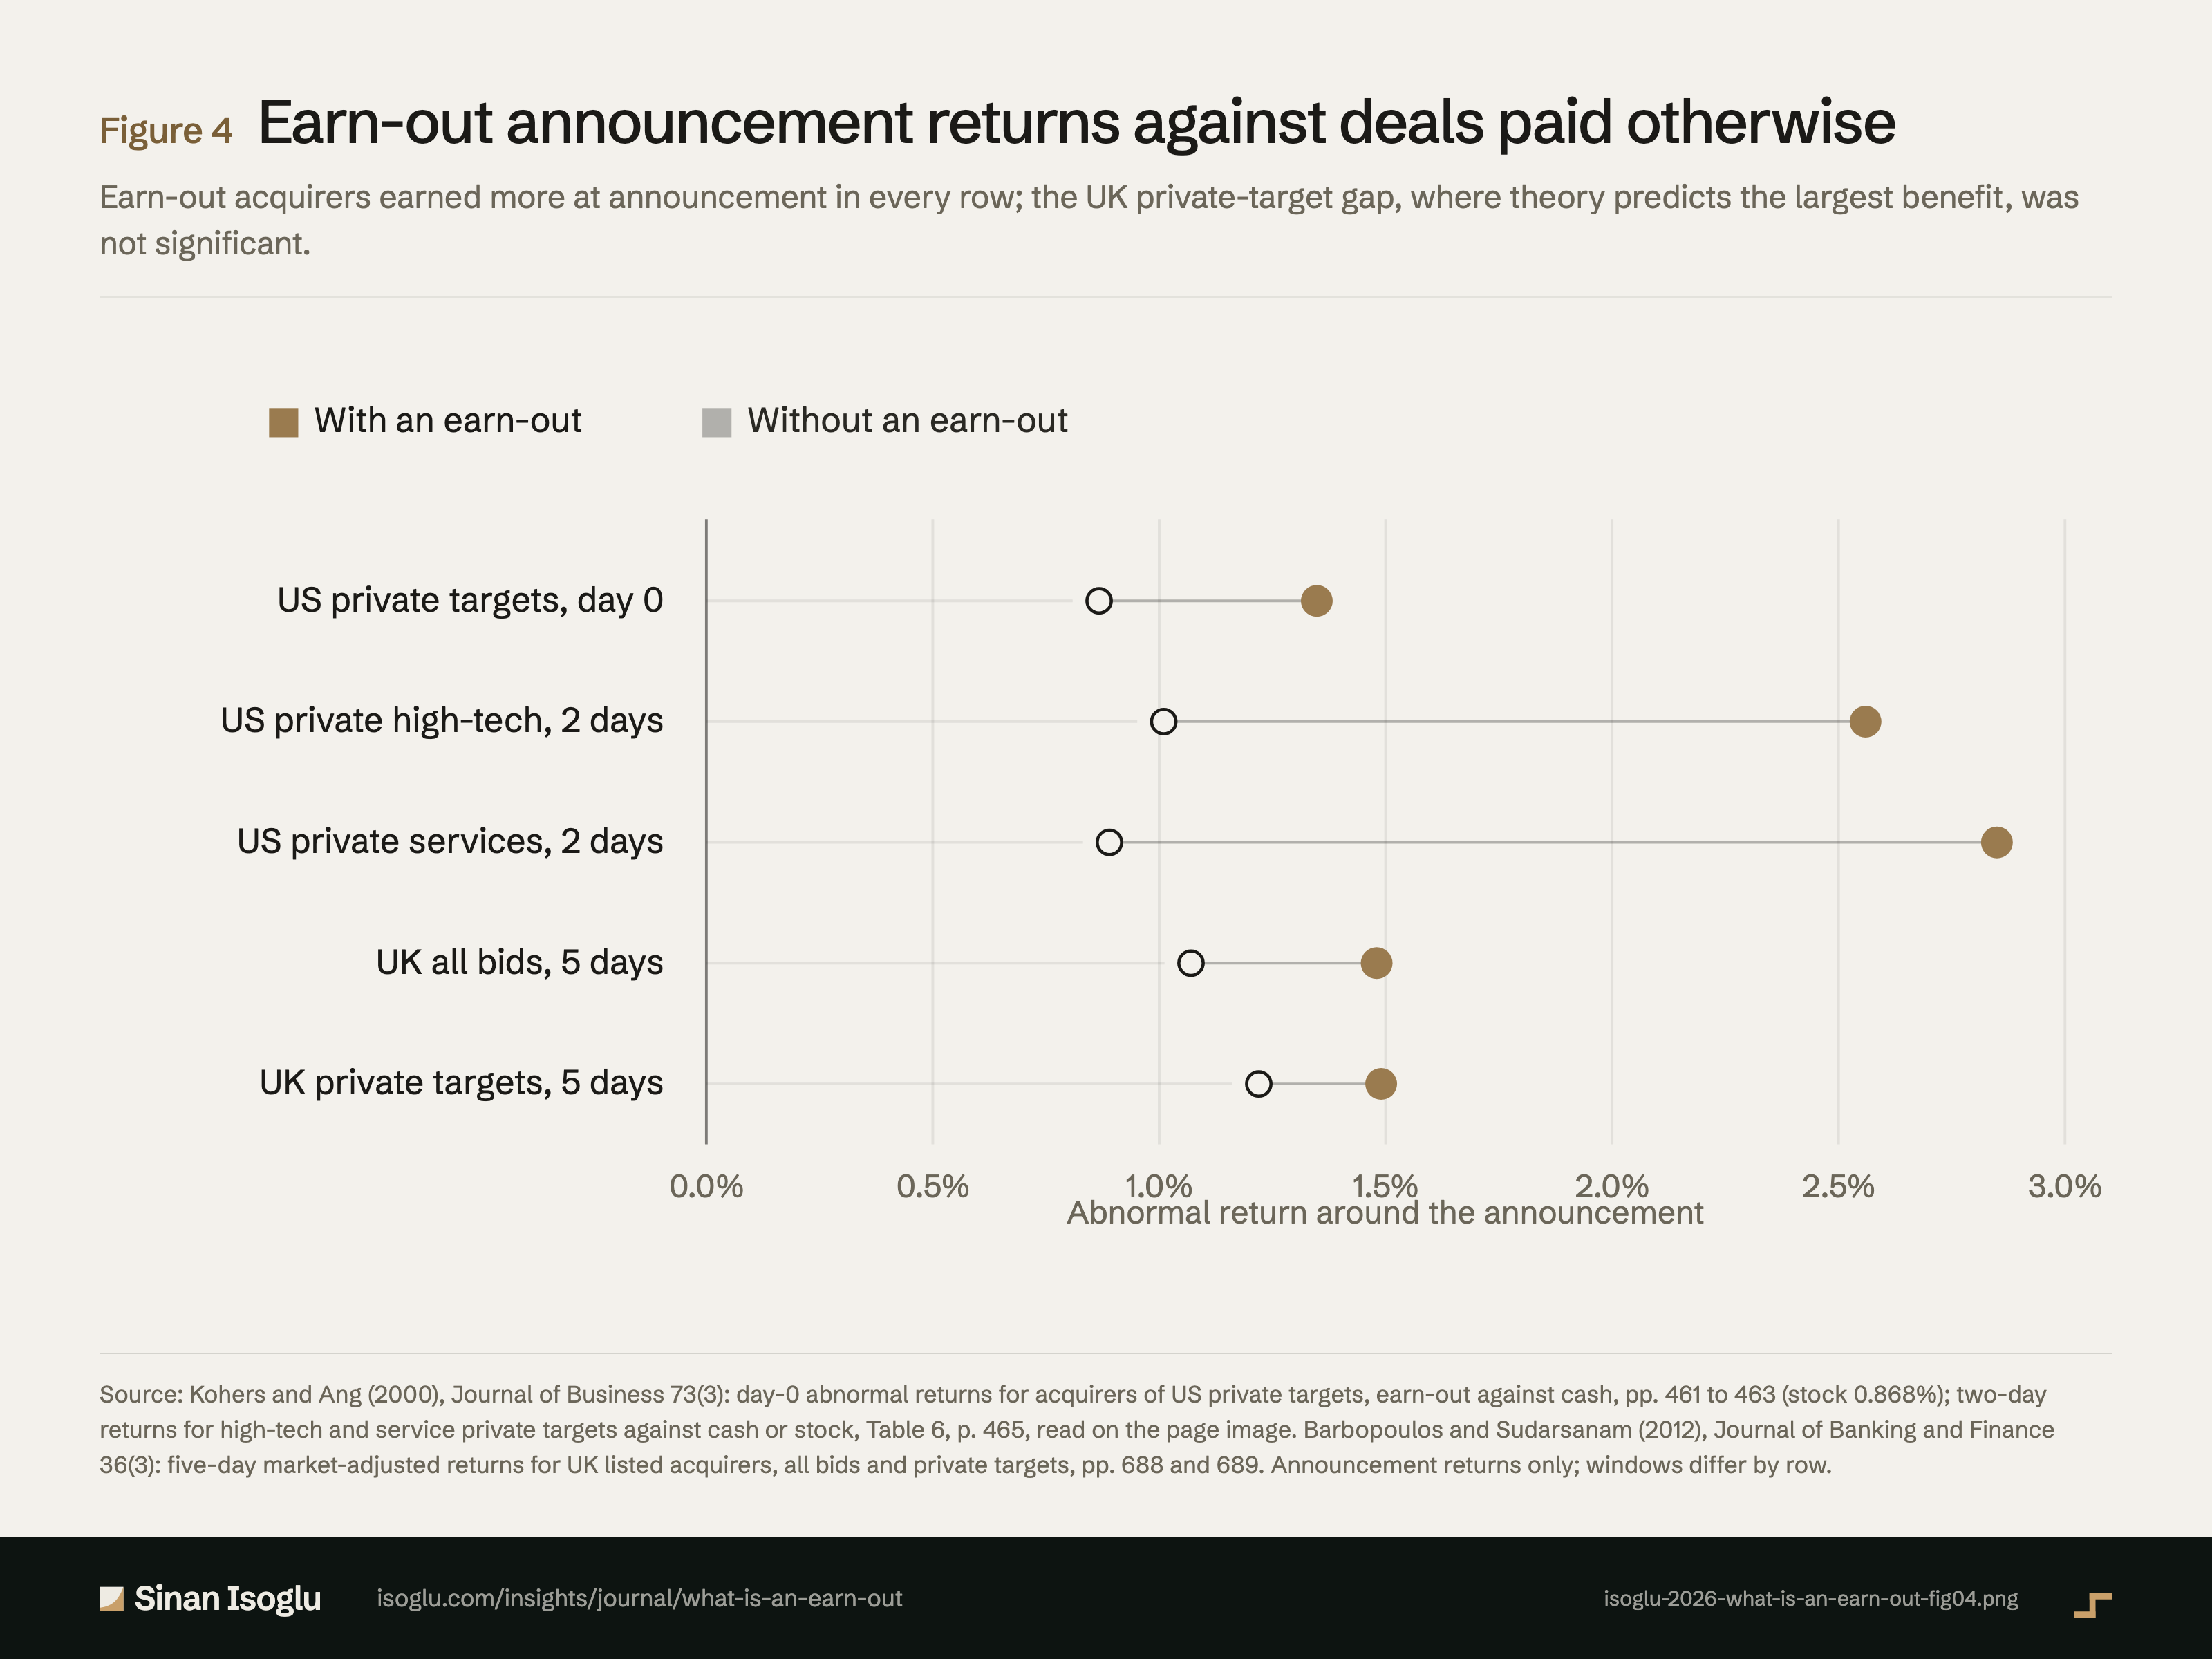
Abbildung 4Grafik
Earn-Out-Ankündigungsrenditen gegenüber anders bezahlten Übernahmen
Was ist ein Earn-Out? Der Preisteil, der sich erst beweisen muss
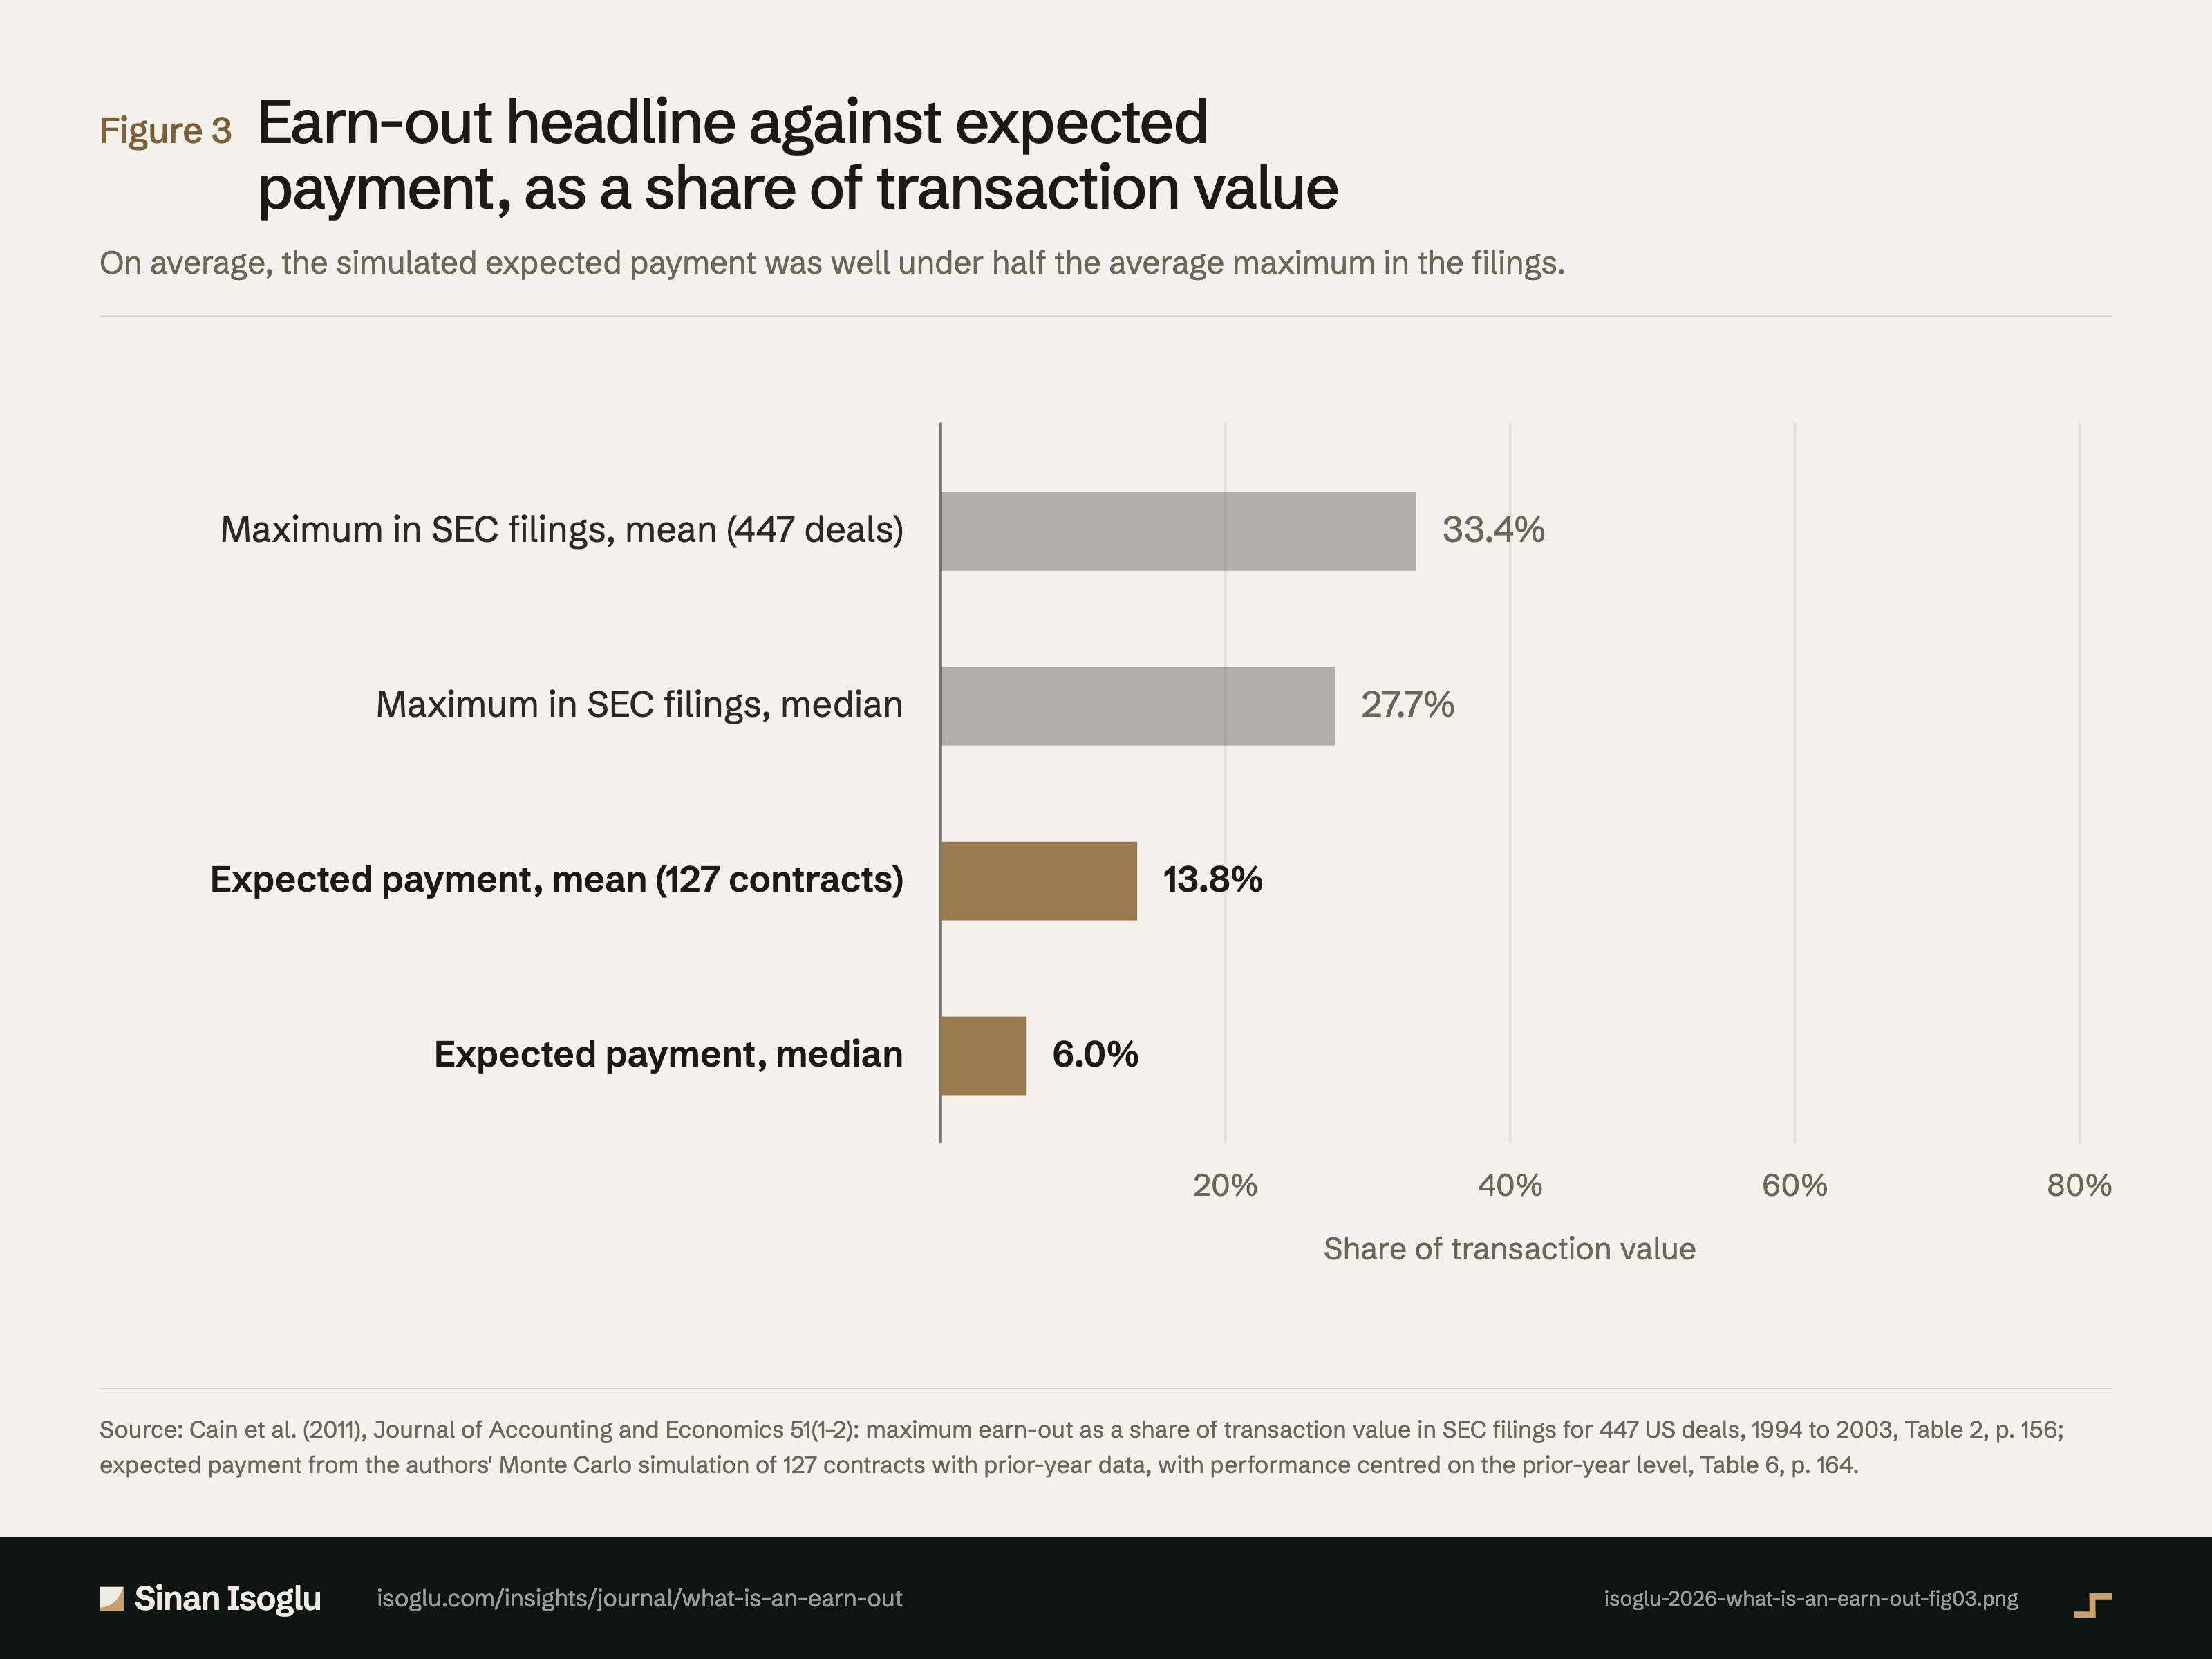
Abbildung 3Grafik
Earn-Out-Nominalbetrag gegenüber erwarteter Zahlung, als Anteil am Transaktionswert
Was ist ein Earn-Out? Der Preisteil, der sich erst beweisen muss
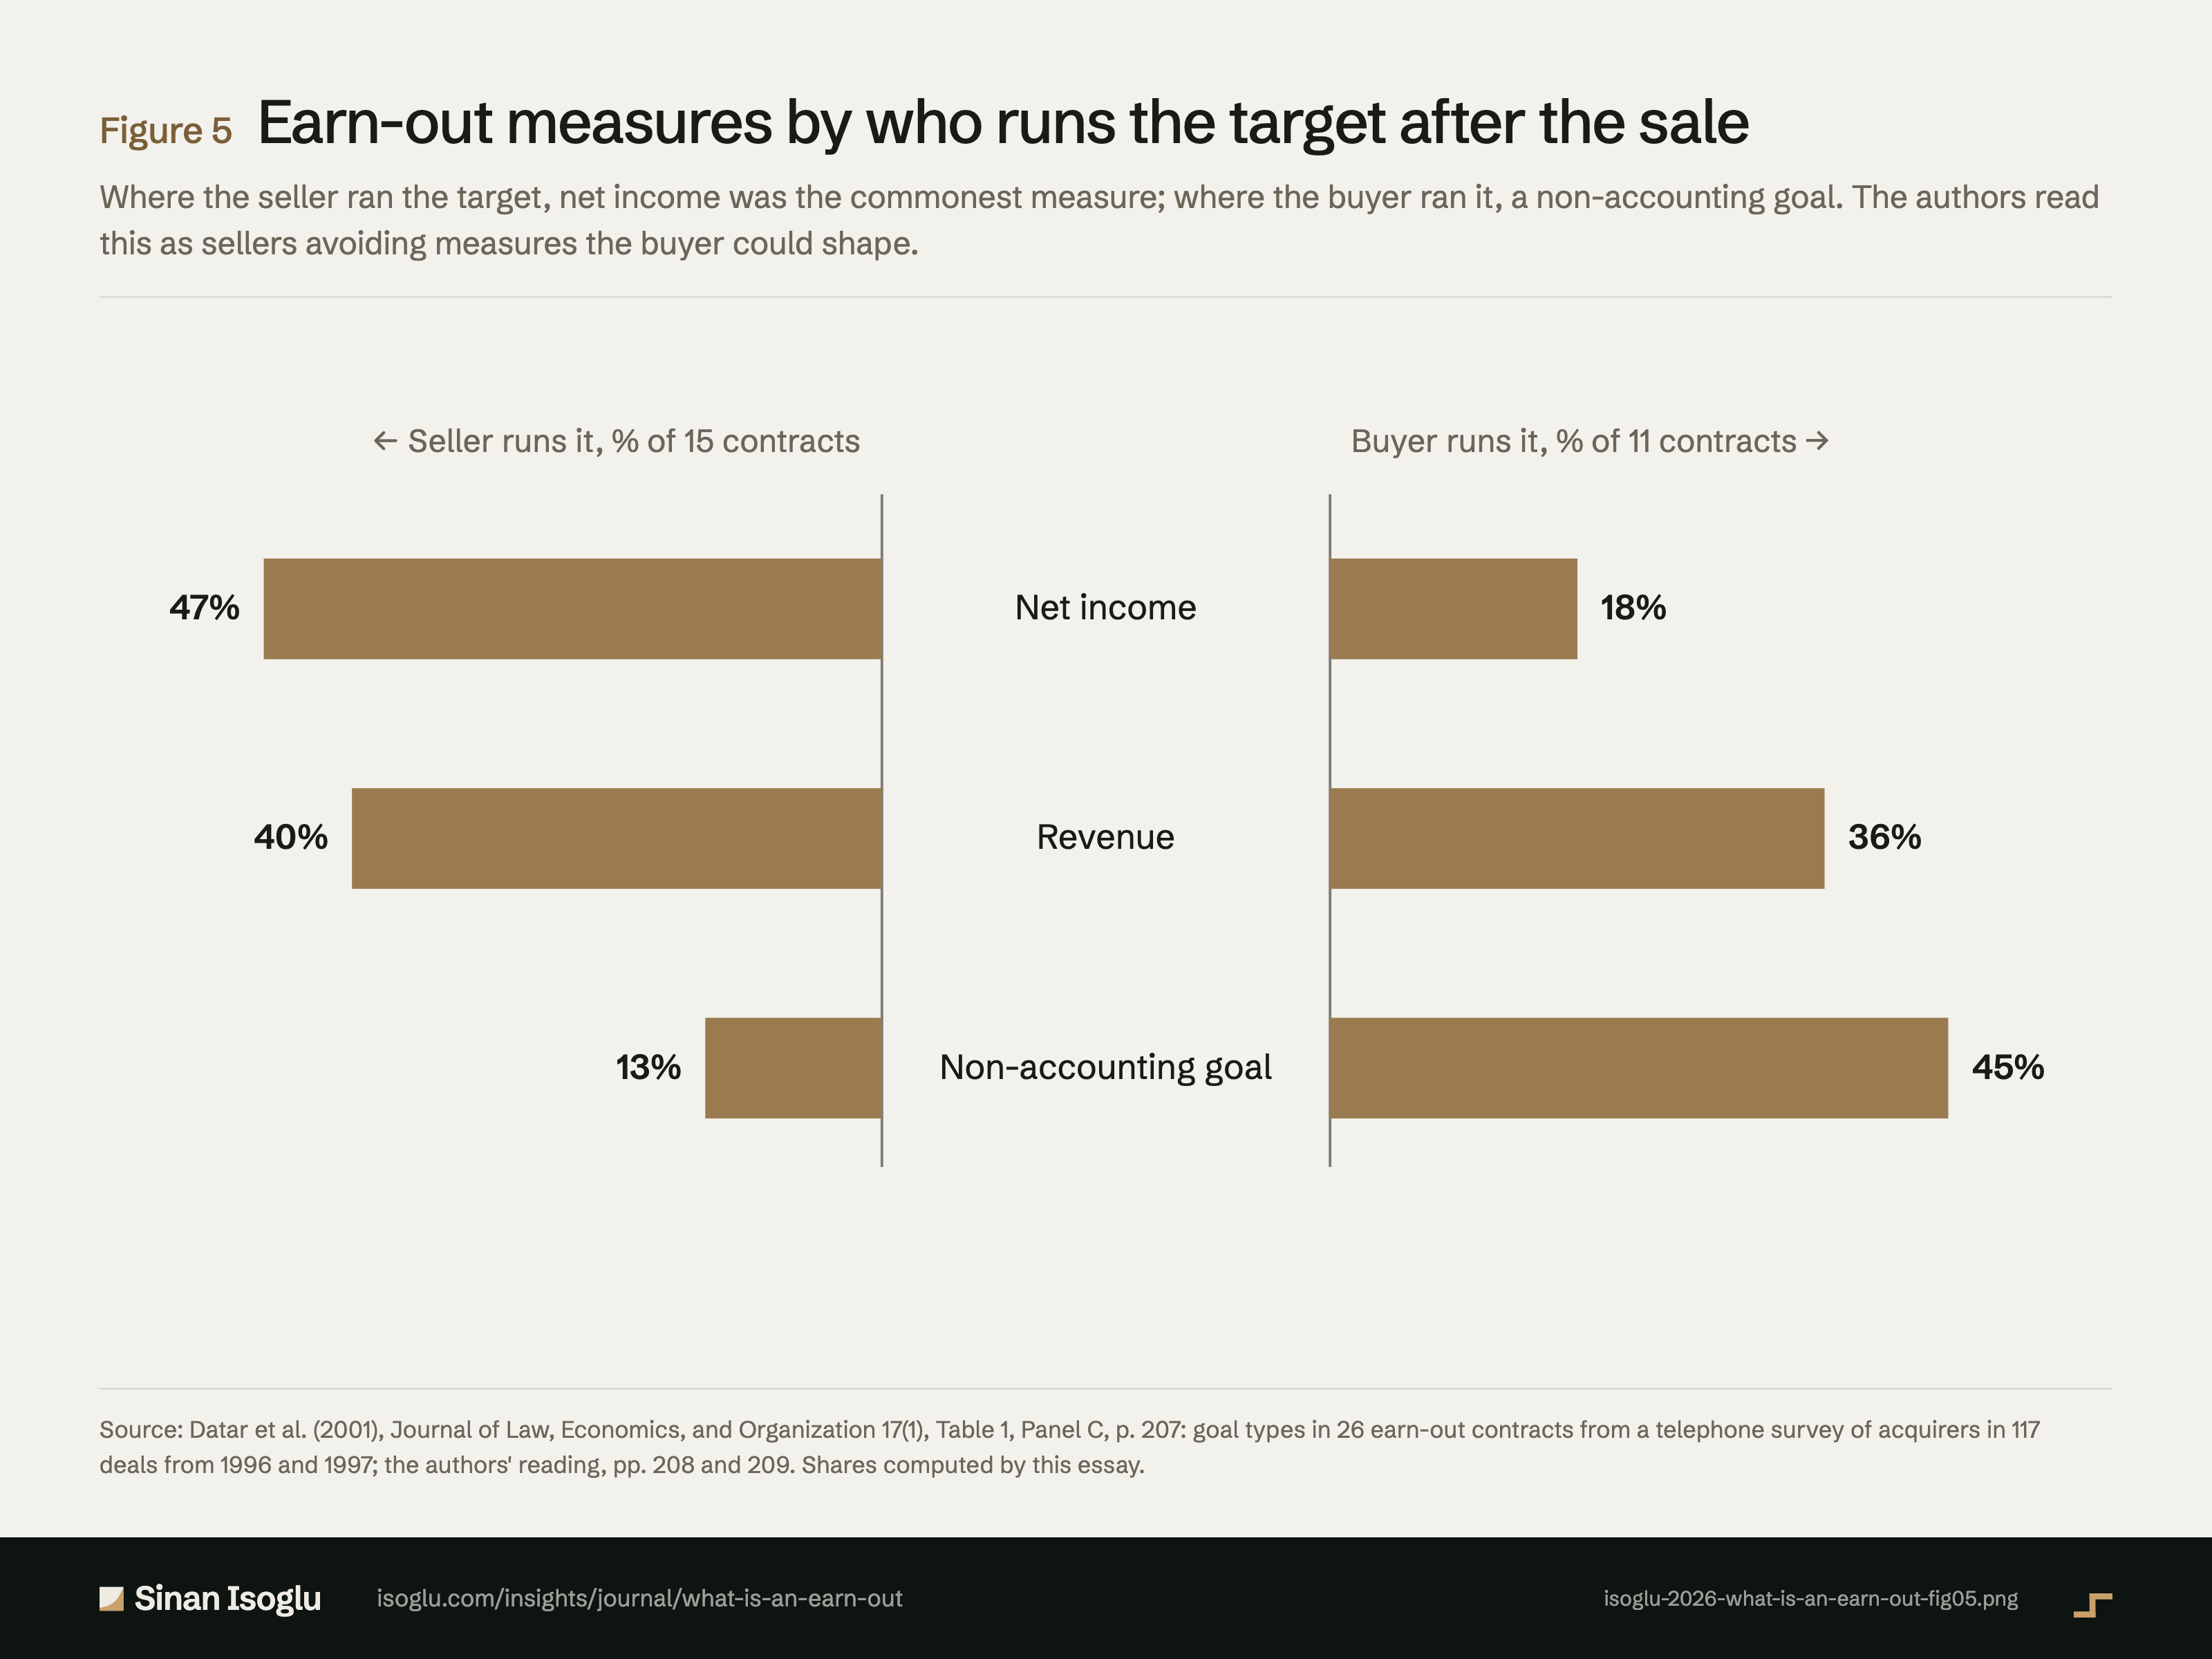
Abbildung 5Grafik
Earn-Out-Bemessungsgrößen danach, wer das Zielunternehmen nach dem Verkauf führt
Was ist ein Earn-Out? Der Preisteil, der sich erst beweisen muss
Kontakt
Schicken Sie die Frage, an der Sie arbeiten.
Forschung, ein Gastvortrag oder eine Frage aus der Praxis.