Figure 3From “What AI did to cost of goods sold is not visible in the line everyone quotes.”
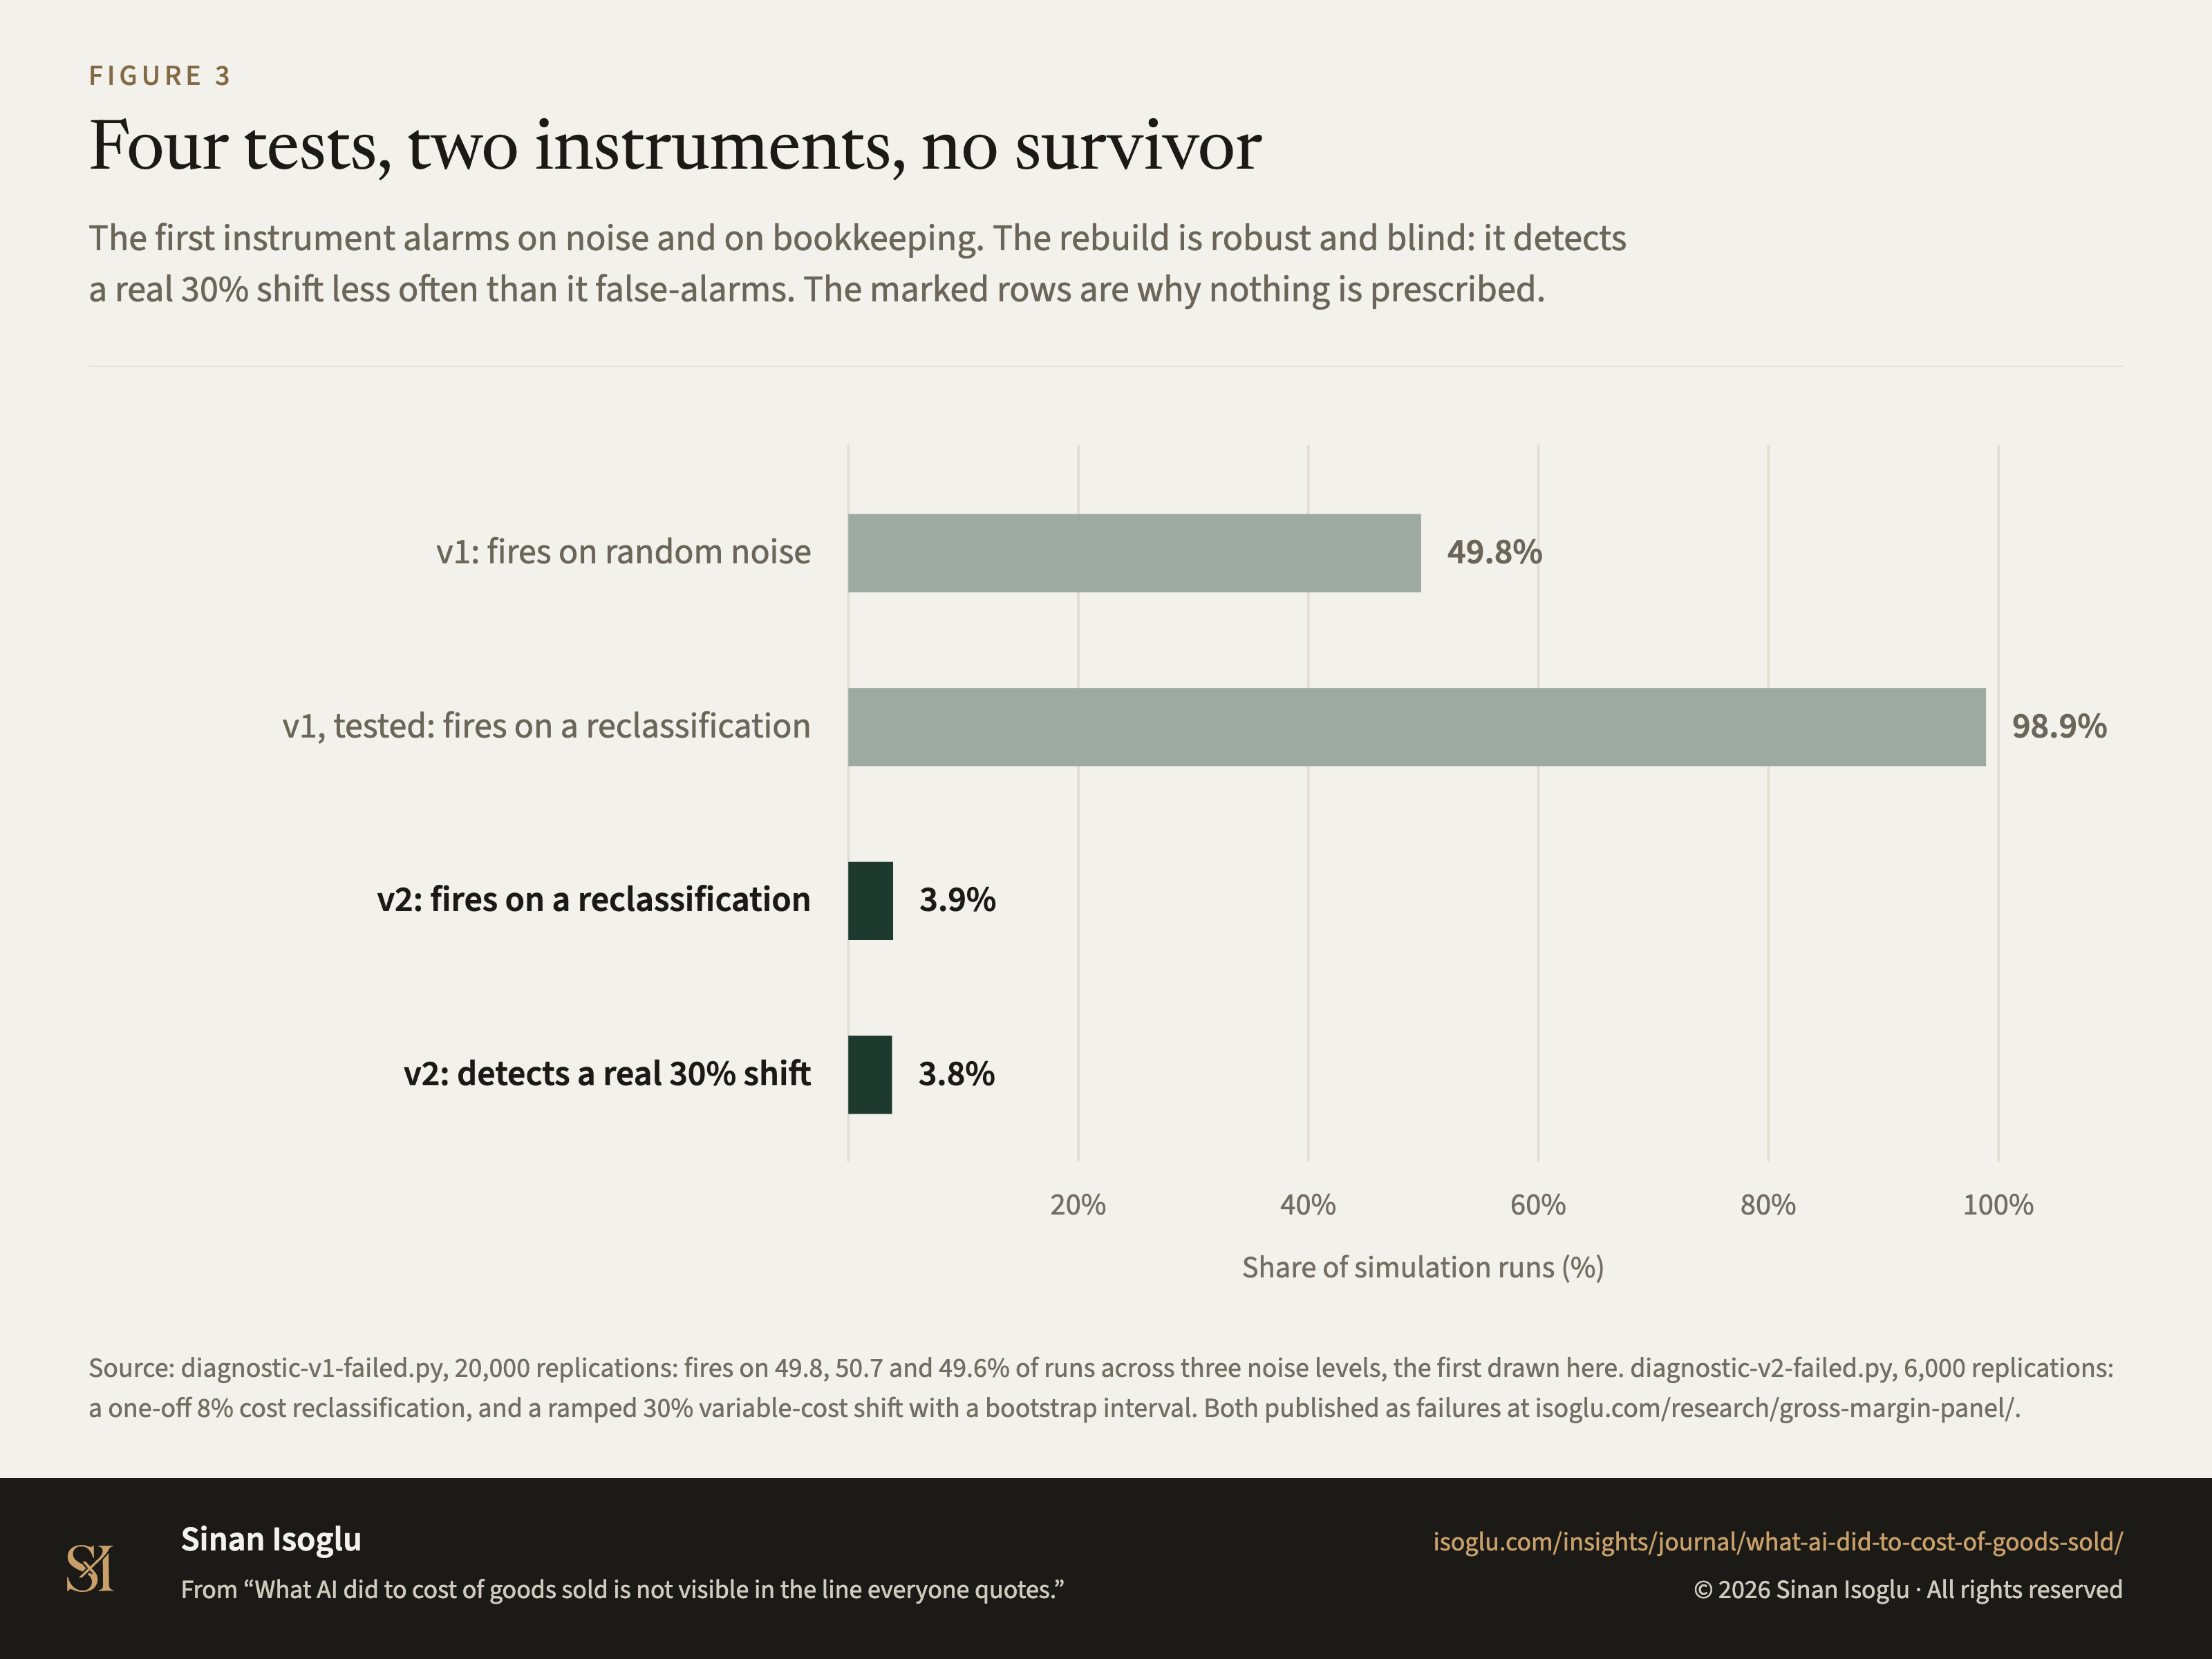
Four tests, two instruments, no survivor
The first instrument alarms on noise and on bookkeeping. The rebuild is robust and blind: it detects a real 30% shift less often than it false-alarms. The marked rows are why nothing is prescribed.
Figure 3Four tests, two instruments, no survivor
Source: diagnostic-v1-failed.py, 20,000 replications: fires on 49.8, 50.7 and 49.6% of runs across three noise levels, the first drawn here. diagnostic-v2-failed.py, 6,000 replications: a one-off 8% cost reclassification, and a ramped 30% variable-cost shift with a bootstrap interval. Both published as failures at isoglu.com/research/gross-margin-panel/.
From the essay
Revenue operations & AI
What AI did to cost of goods sold is not visible in the line everyone quotes.
Two camps argue about AI and software margins from survey data. The audited filings agree with neither, and could not have settled it anyway.
Read the essayThis exhibit belongs to an essay: the numbers live here, the argument lives there.
Cite or embed
Related exhibits
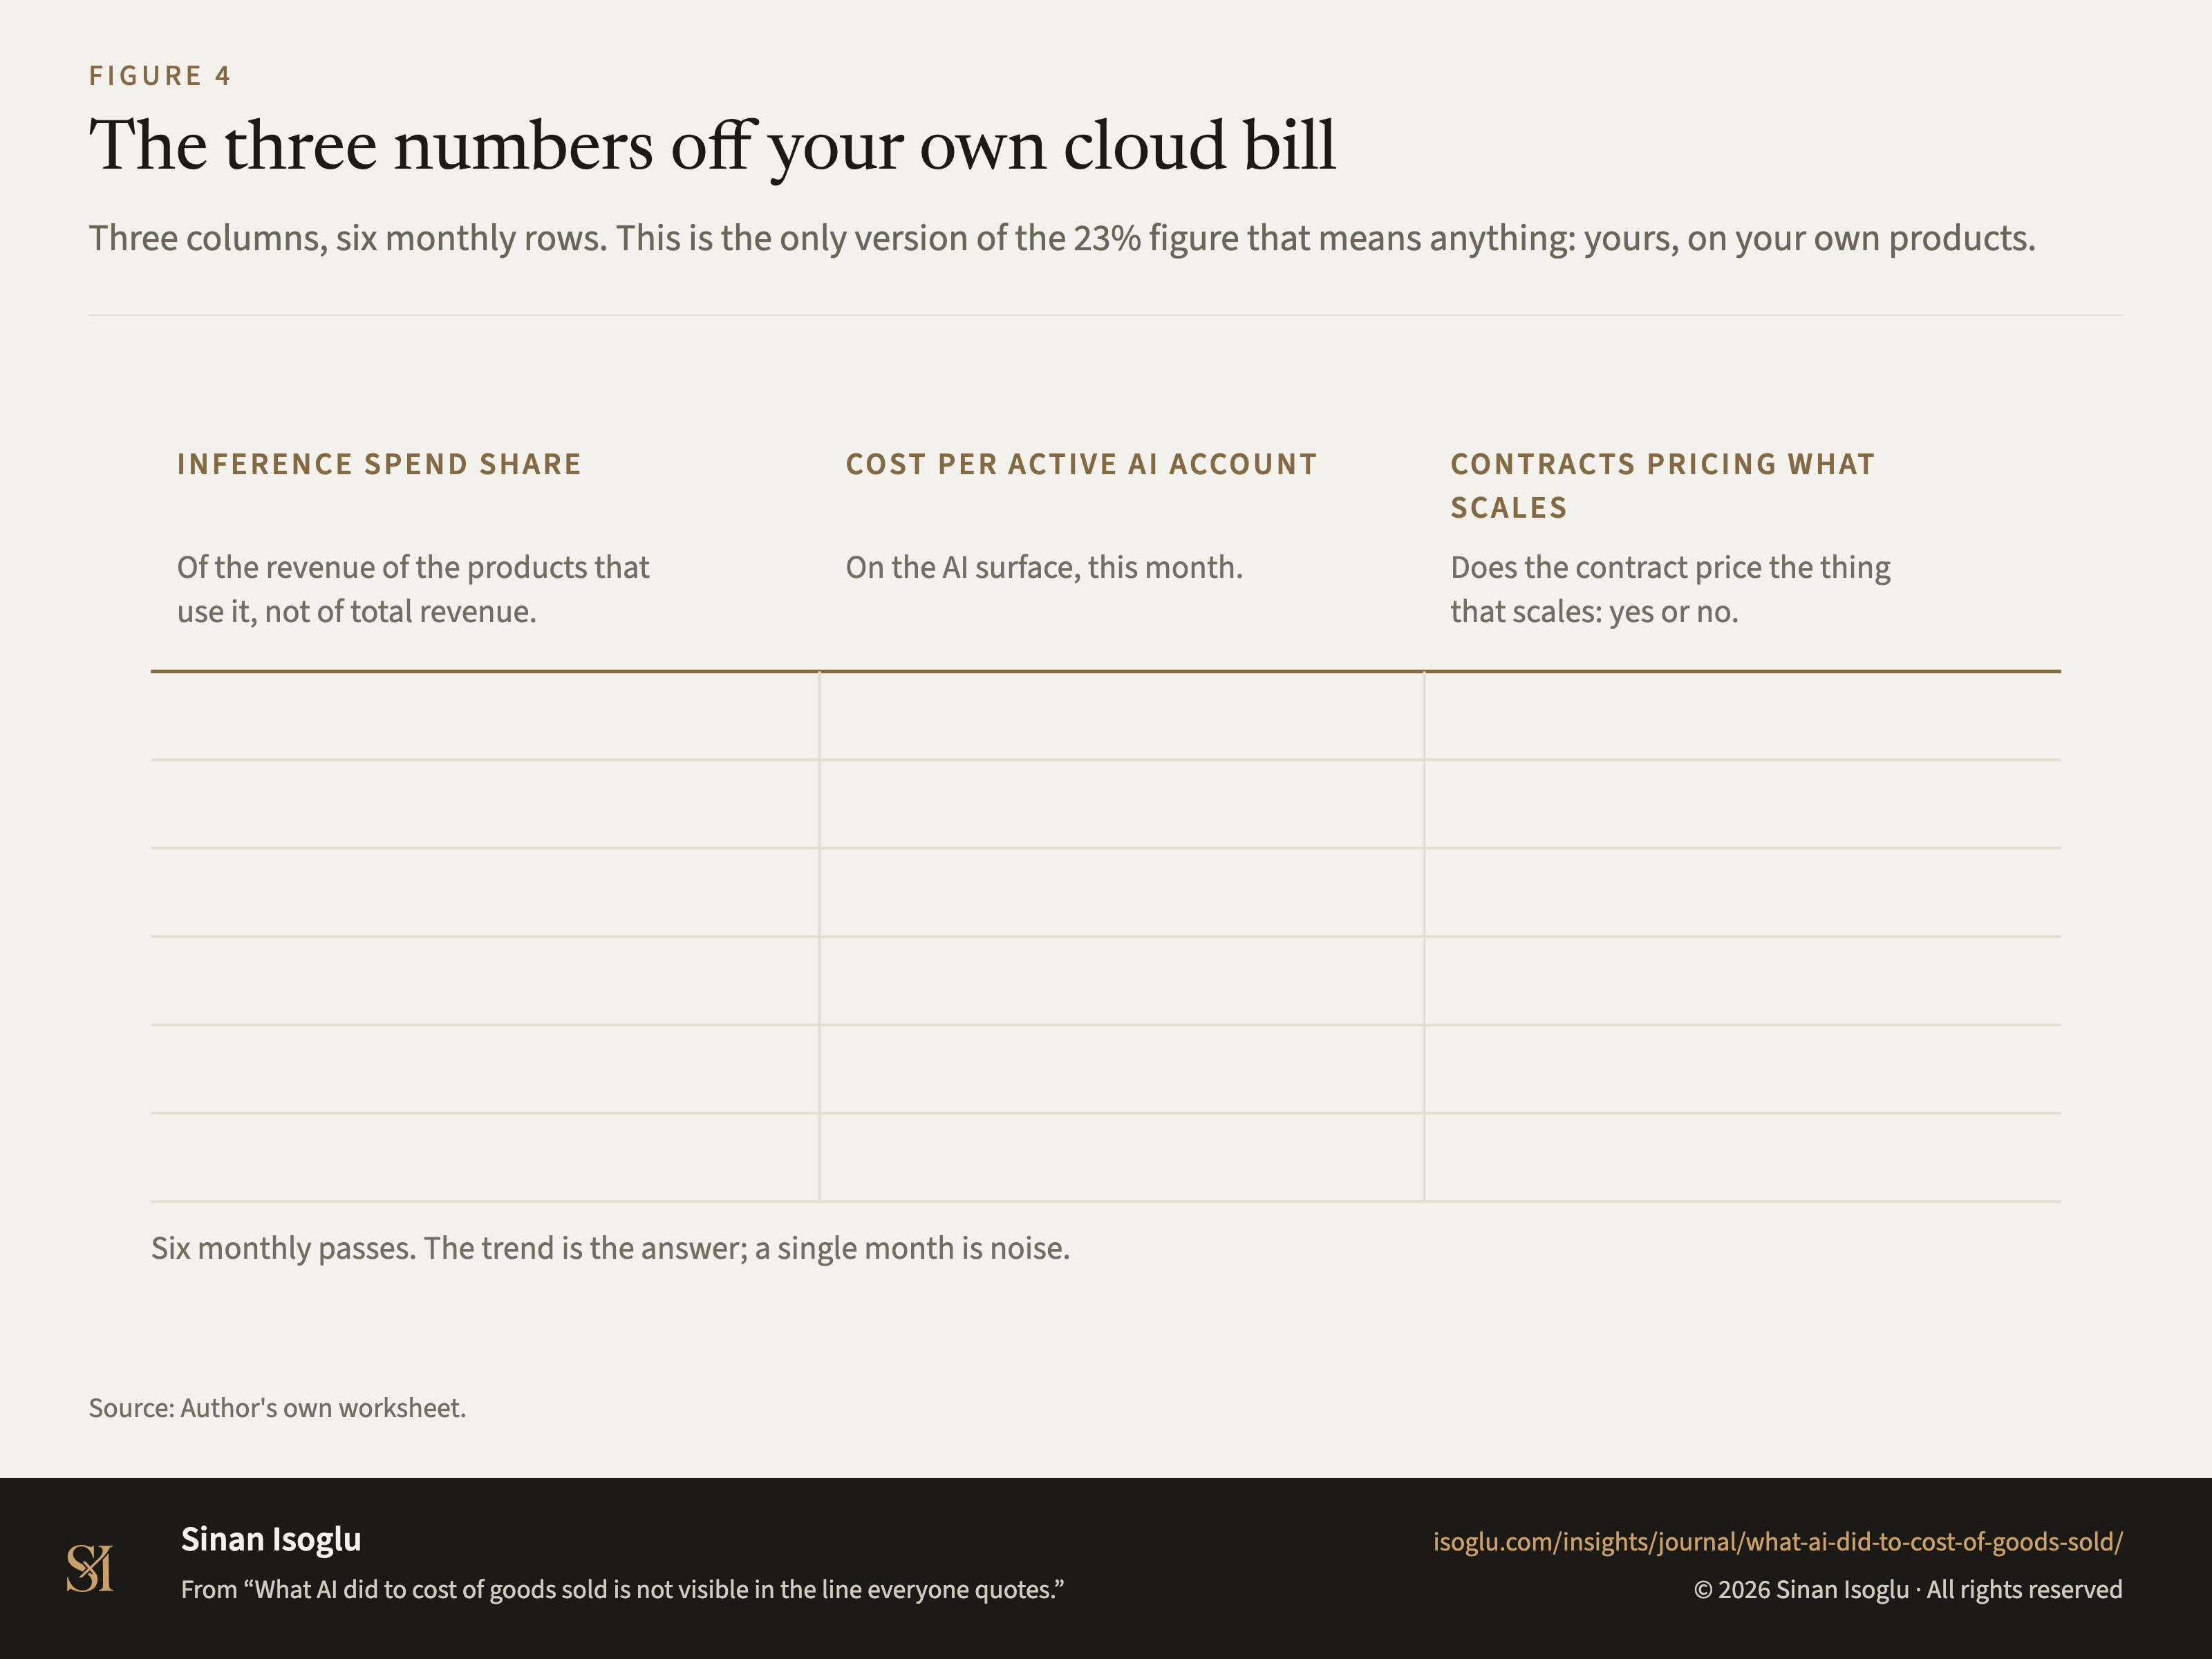
Figure 4Figure
The three numbers off your own cloud bill
What AI did to cost of goods sold is not visible in the line everyone quotes.
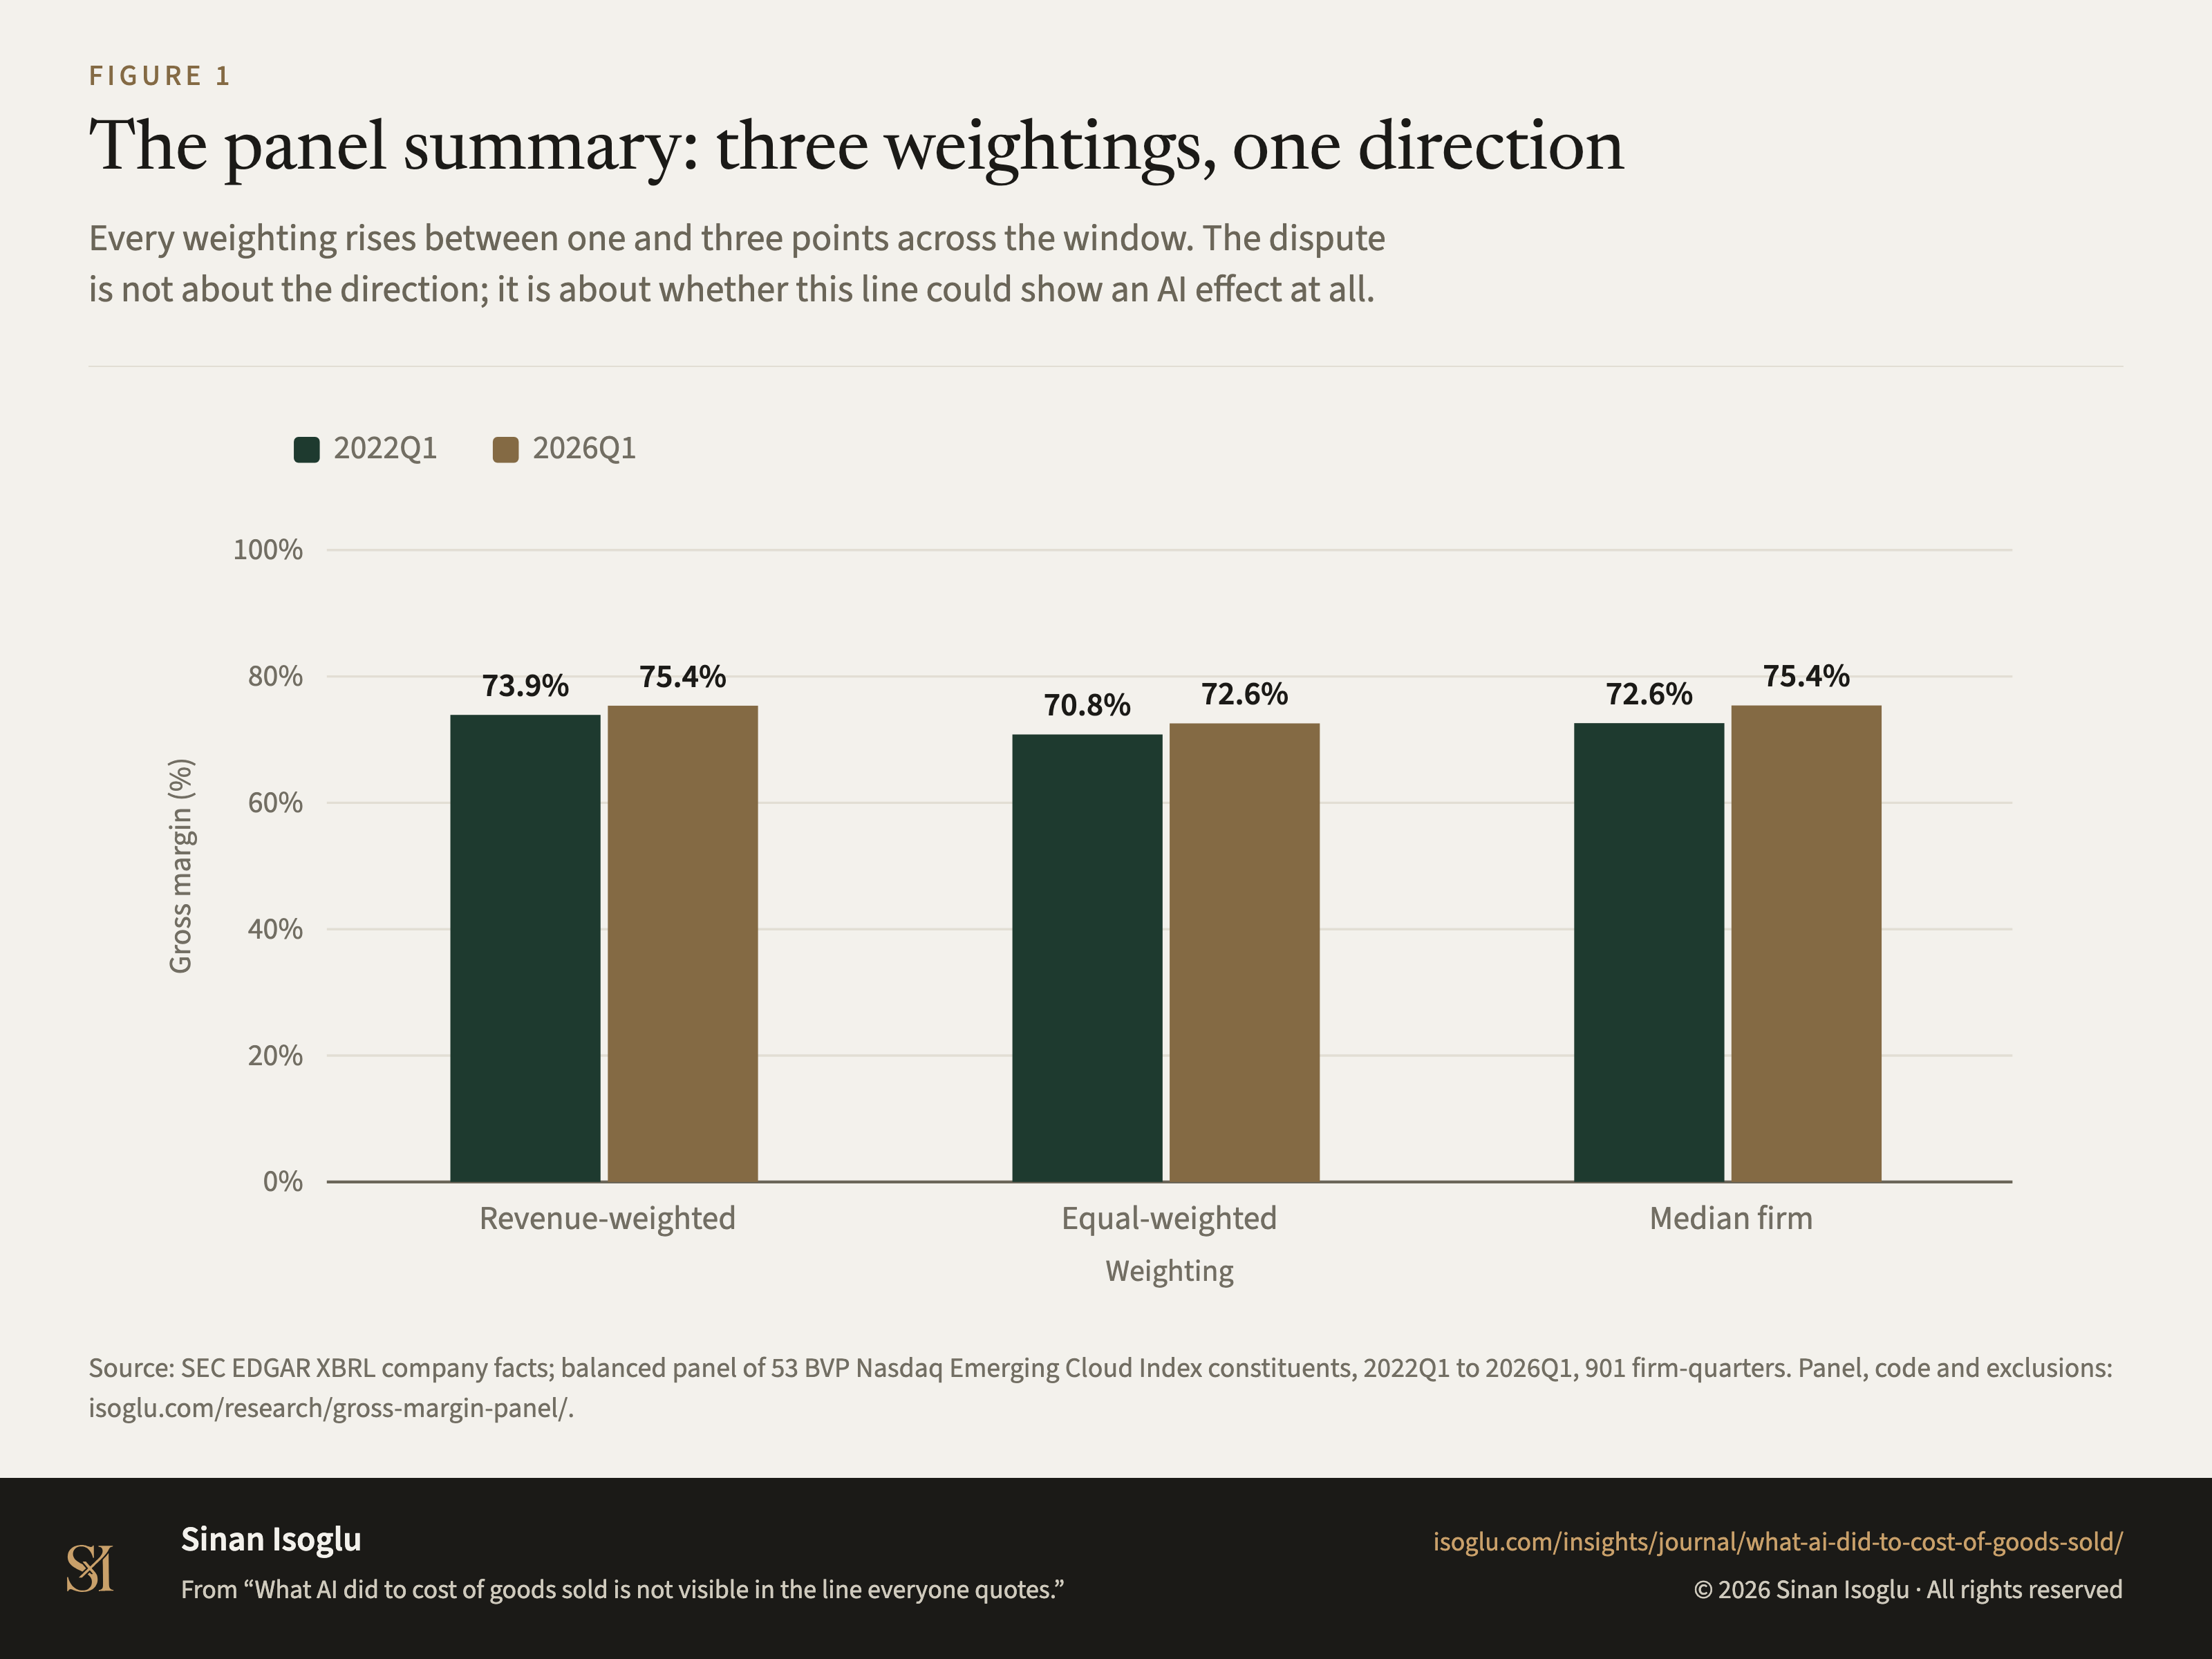
Figure 1Figure
The panel summary: three weightings, one direction
What AI did to cost of goods sold is not visible in the line everyone quotes.
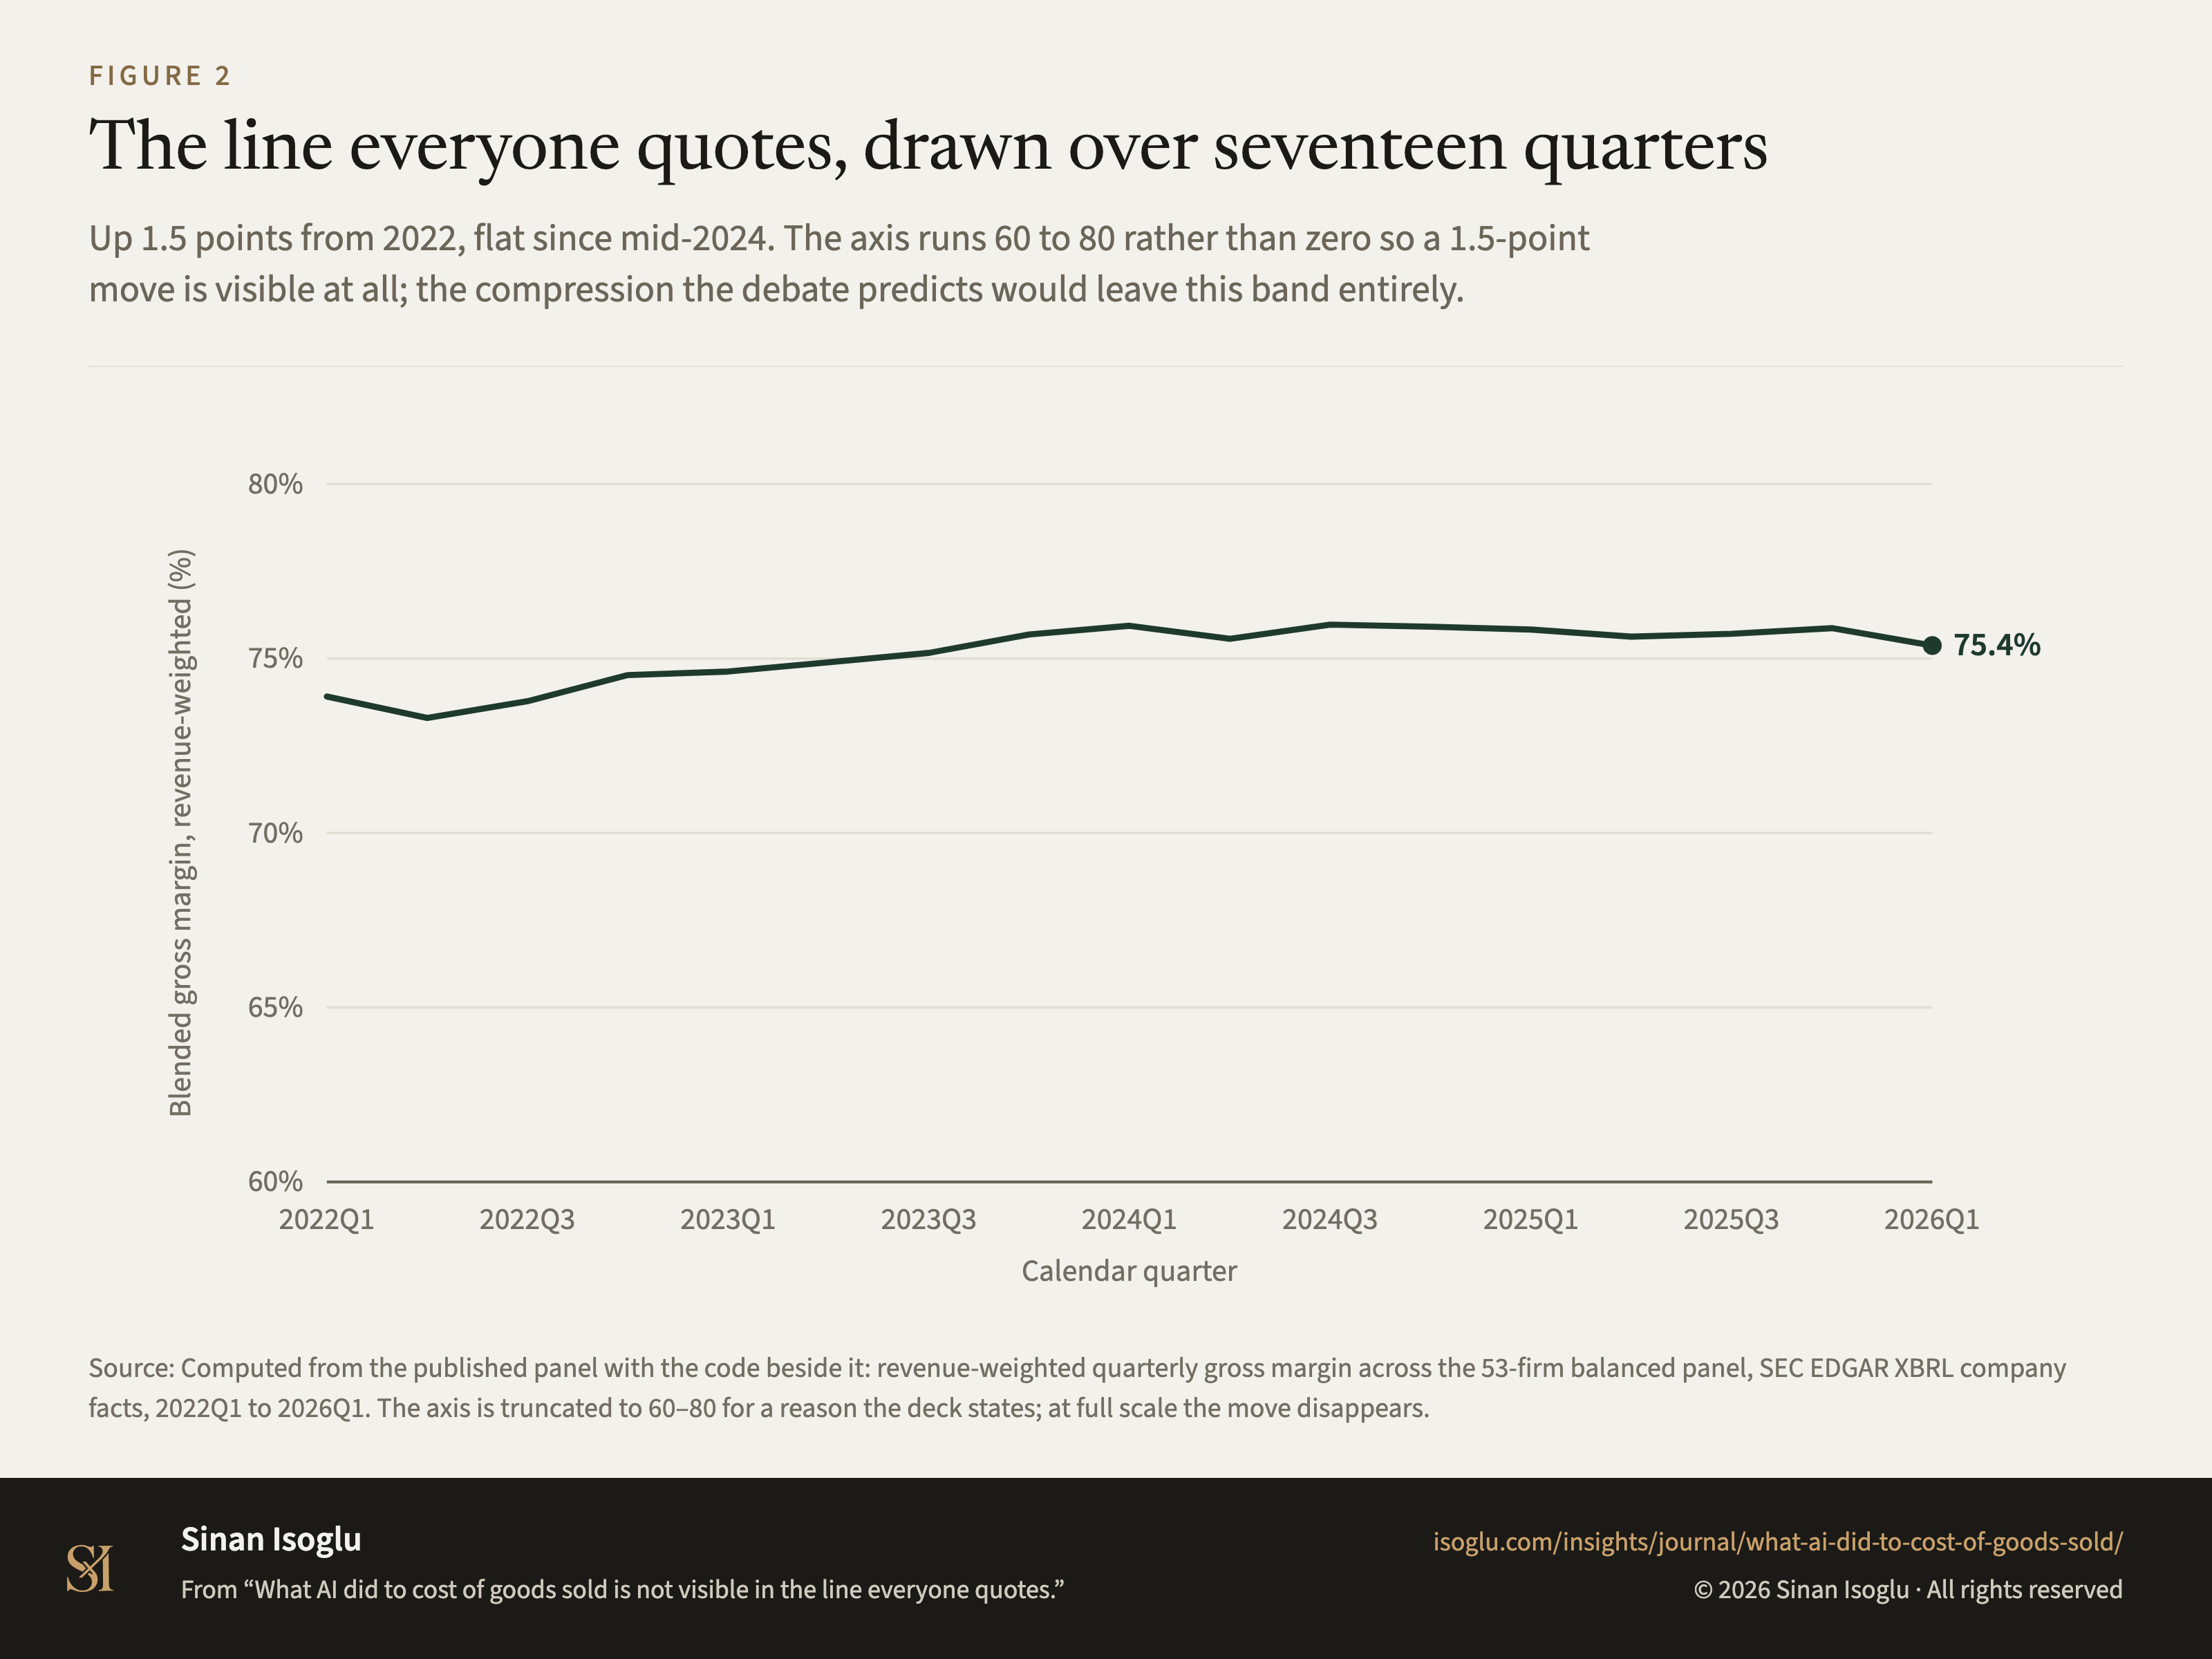
Figure 2Figure
The line everyone quotes, drawn over seventeen quarters
What AI did to cost of goods sold is not visible in the line everyone quotes.
Contact
Bring the question you're working on.
Research, a guest lecture, or a commercial question.