← Every exhibit
Table 2From “Van Westendorp is a survey boundary, not a price”
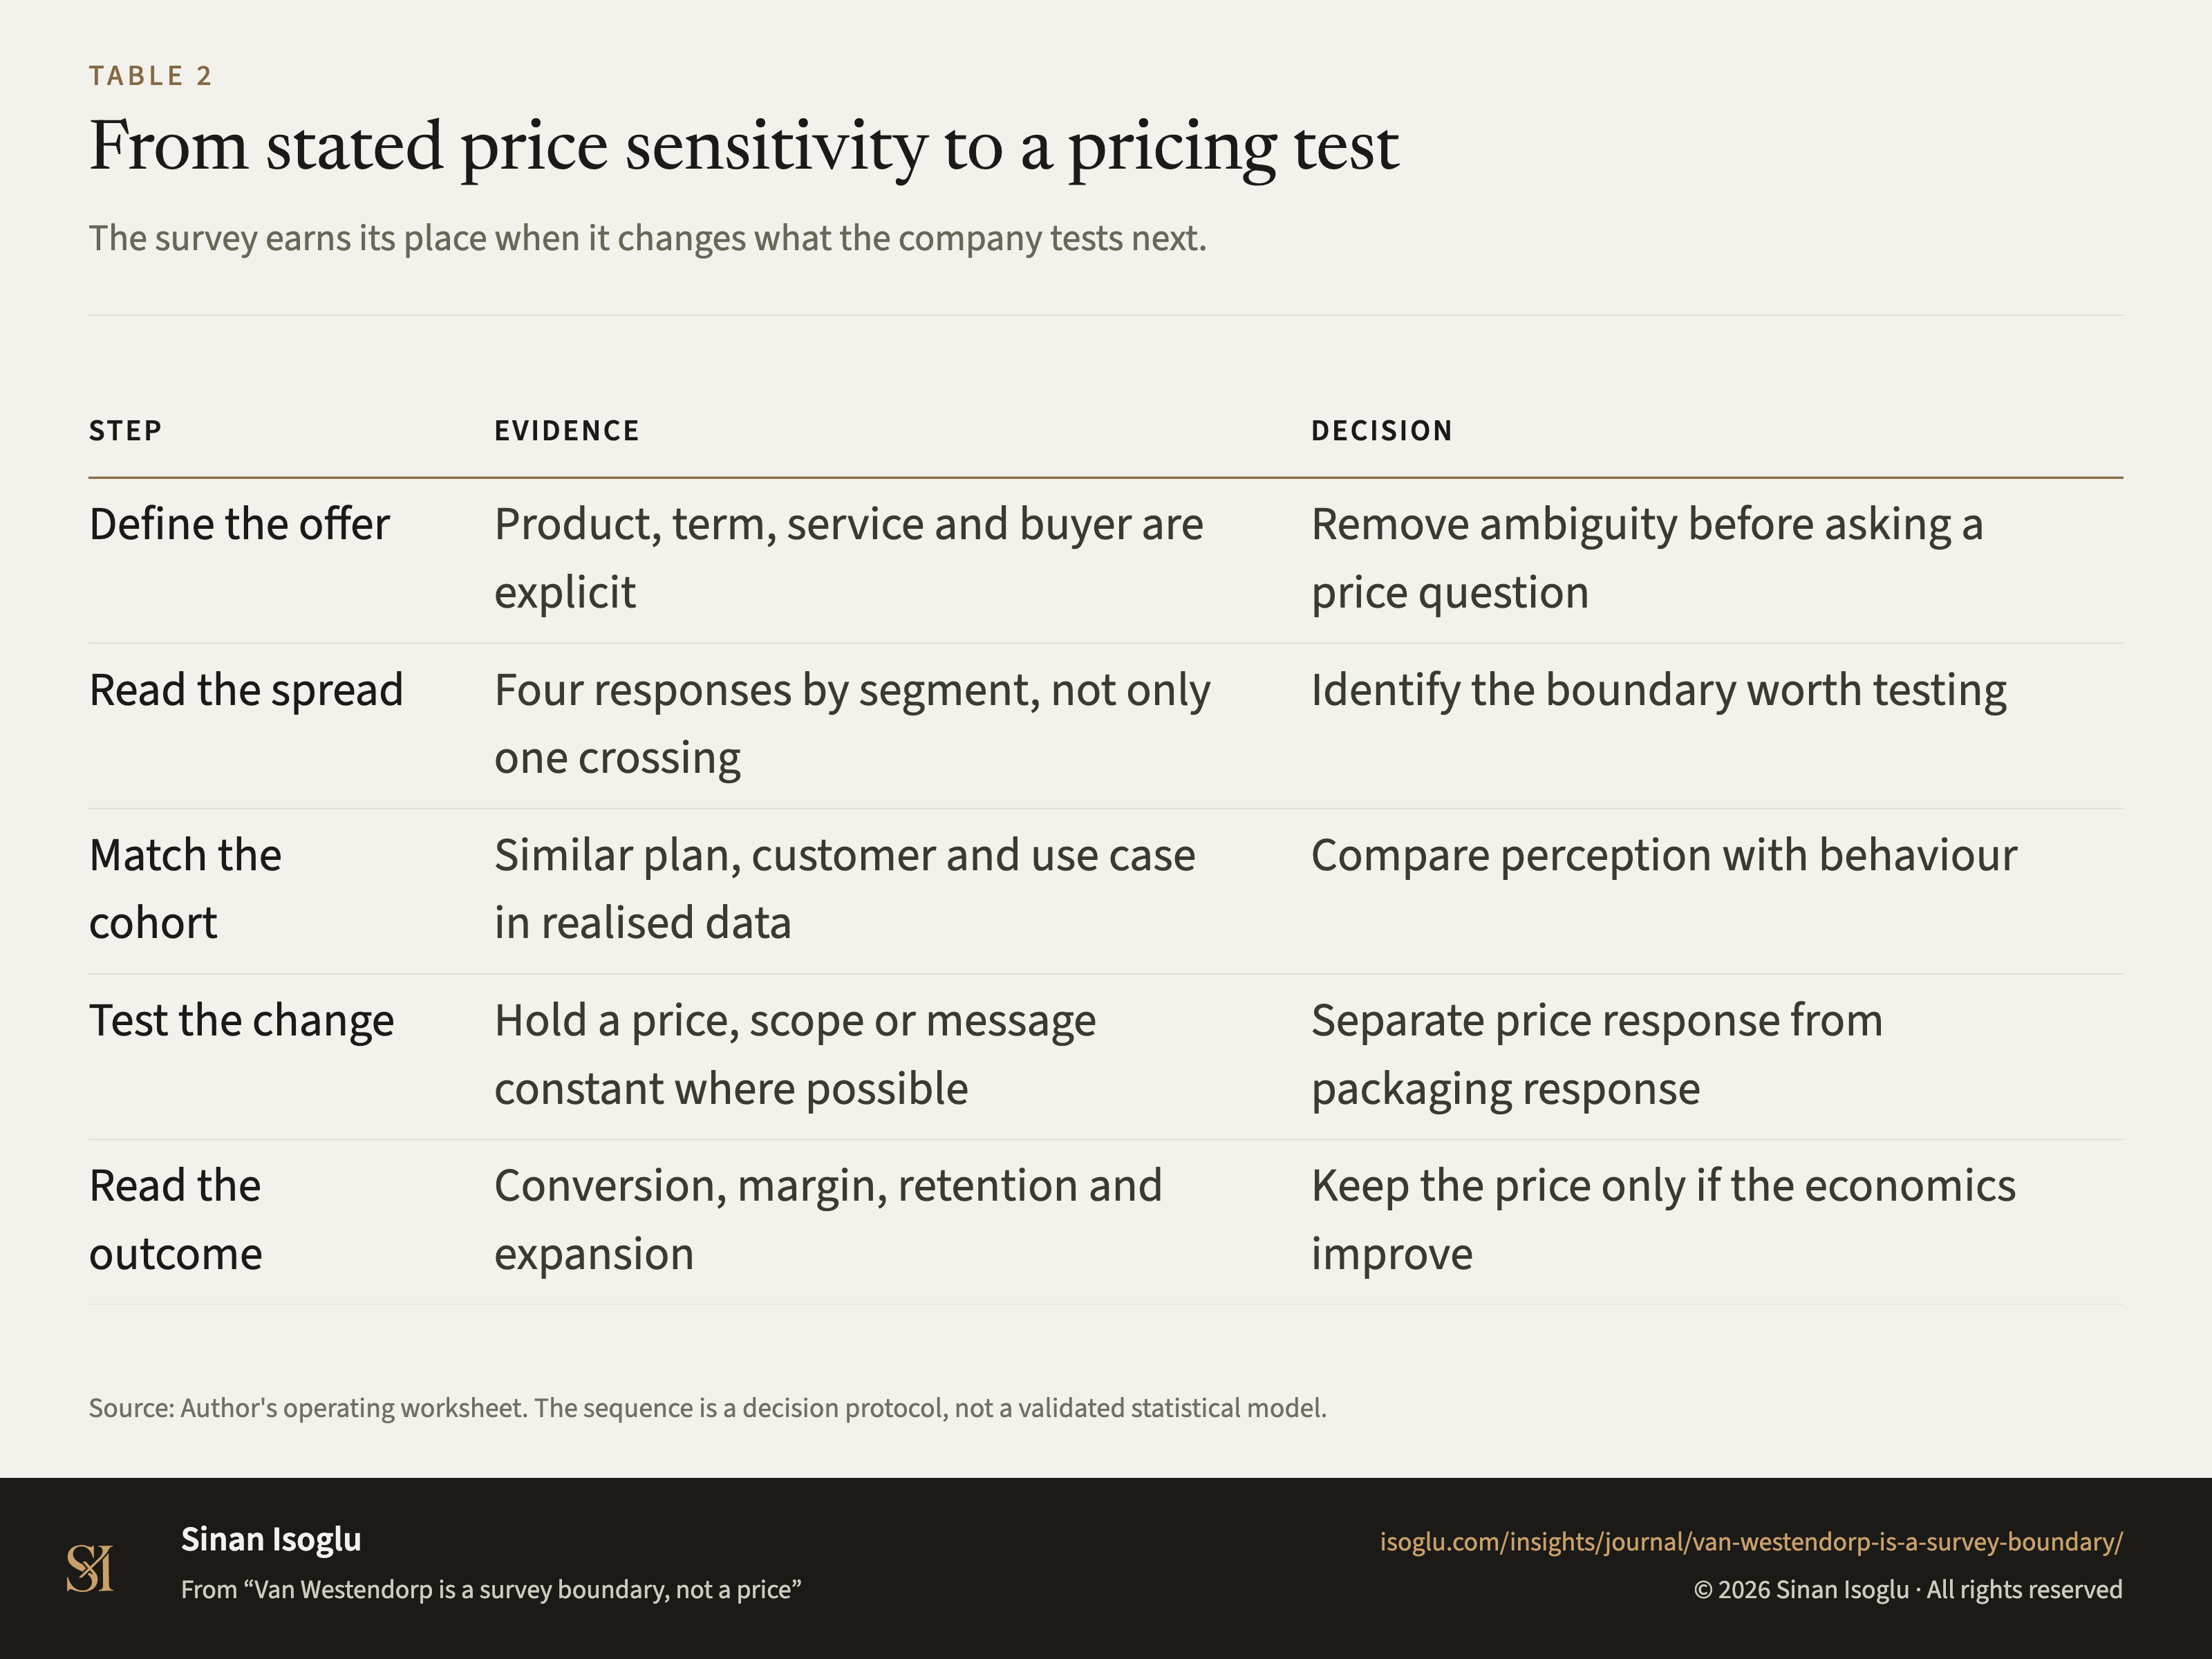
From stated price sensitivity to a pricing test
The survey earns its place when it changes what the company tests next.
Table 2From stated price sensitivity to a pricing test
| Step | Evidence | Decision |
|---|---|---|
| Define the offer | Product, term, service and buyer are explicit | Remove ambiguity before asking a price question |
| Read the spread | Four responses by segment, not only one crossing | Identify the boundary worth testing |
| Match the cohort | Similar plan, customer and use case in realised data | Compare perception with behaviour |
| Test the change | Hold a price, scope or message constant where possible | Separate price response from packaging response |
| Read the outcome | Conversion, margin, retention and expansion | Keep the price only if the economics improve |
Swipe or scroll horizontally if the table is wider than your screen.
Source: Author's operating worksheet. The sequence is a decision protocol, not a validated statistical model.
PNG4:3, 1600 × 1200, with the title, the source line and the attribution set in the image isoglu-2026-van-westendorp-is-a-survey-boundary-fig02.png
From the essay
Pricing & revenue architecture
Van Westendorp is a survey boundary, not a price
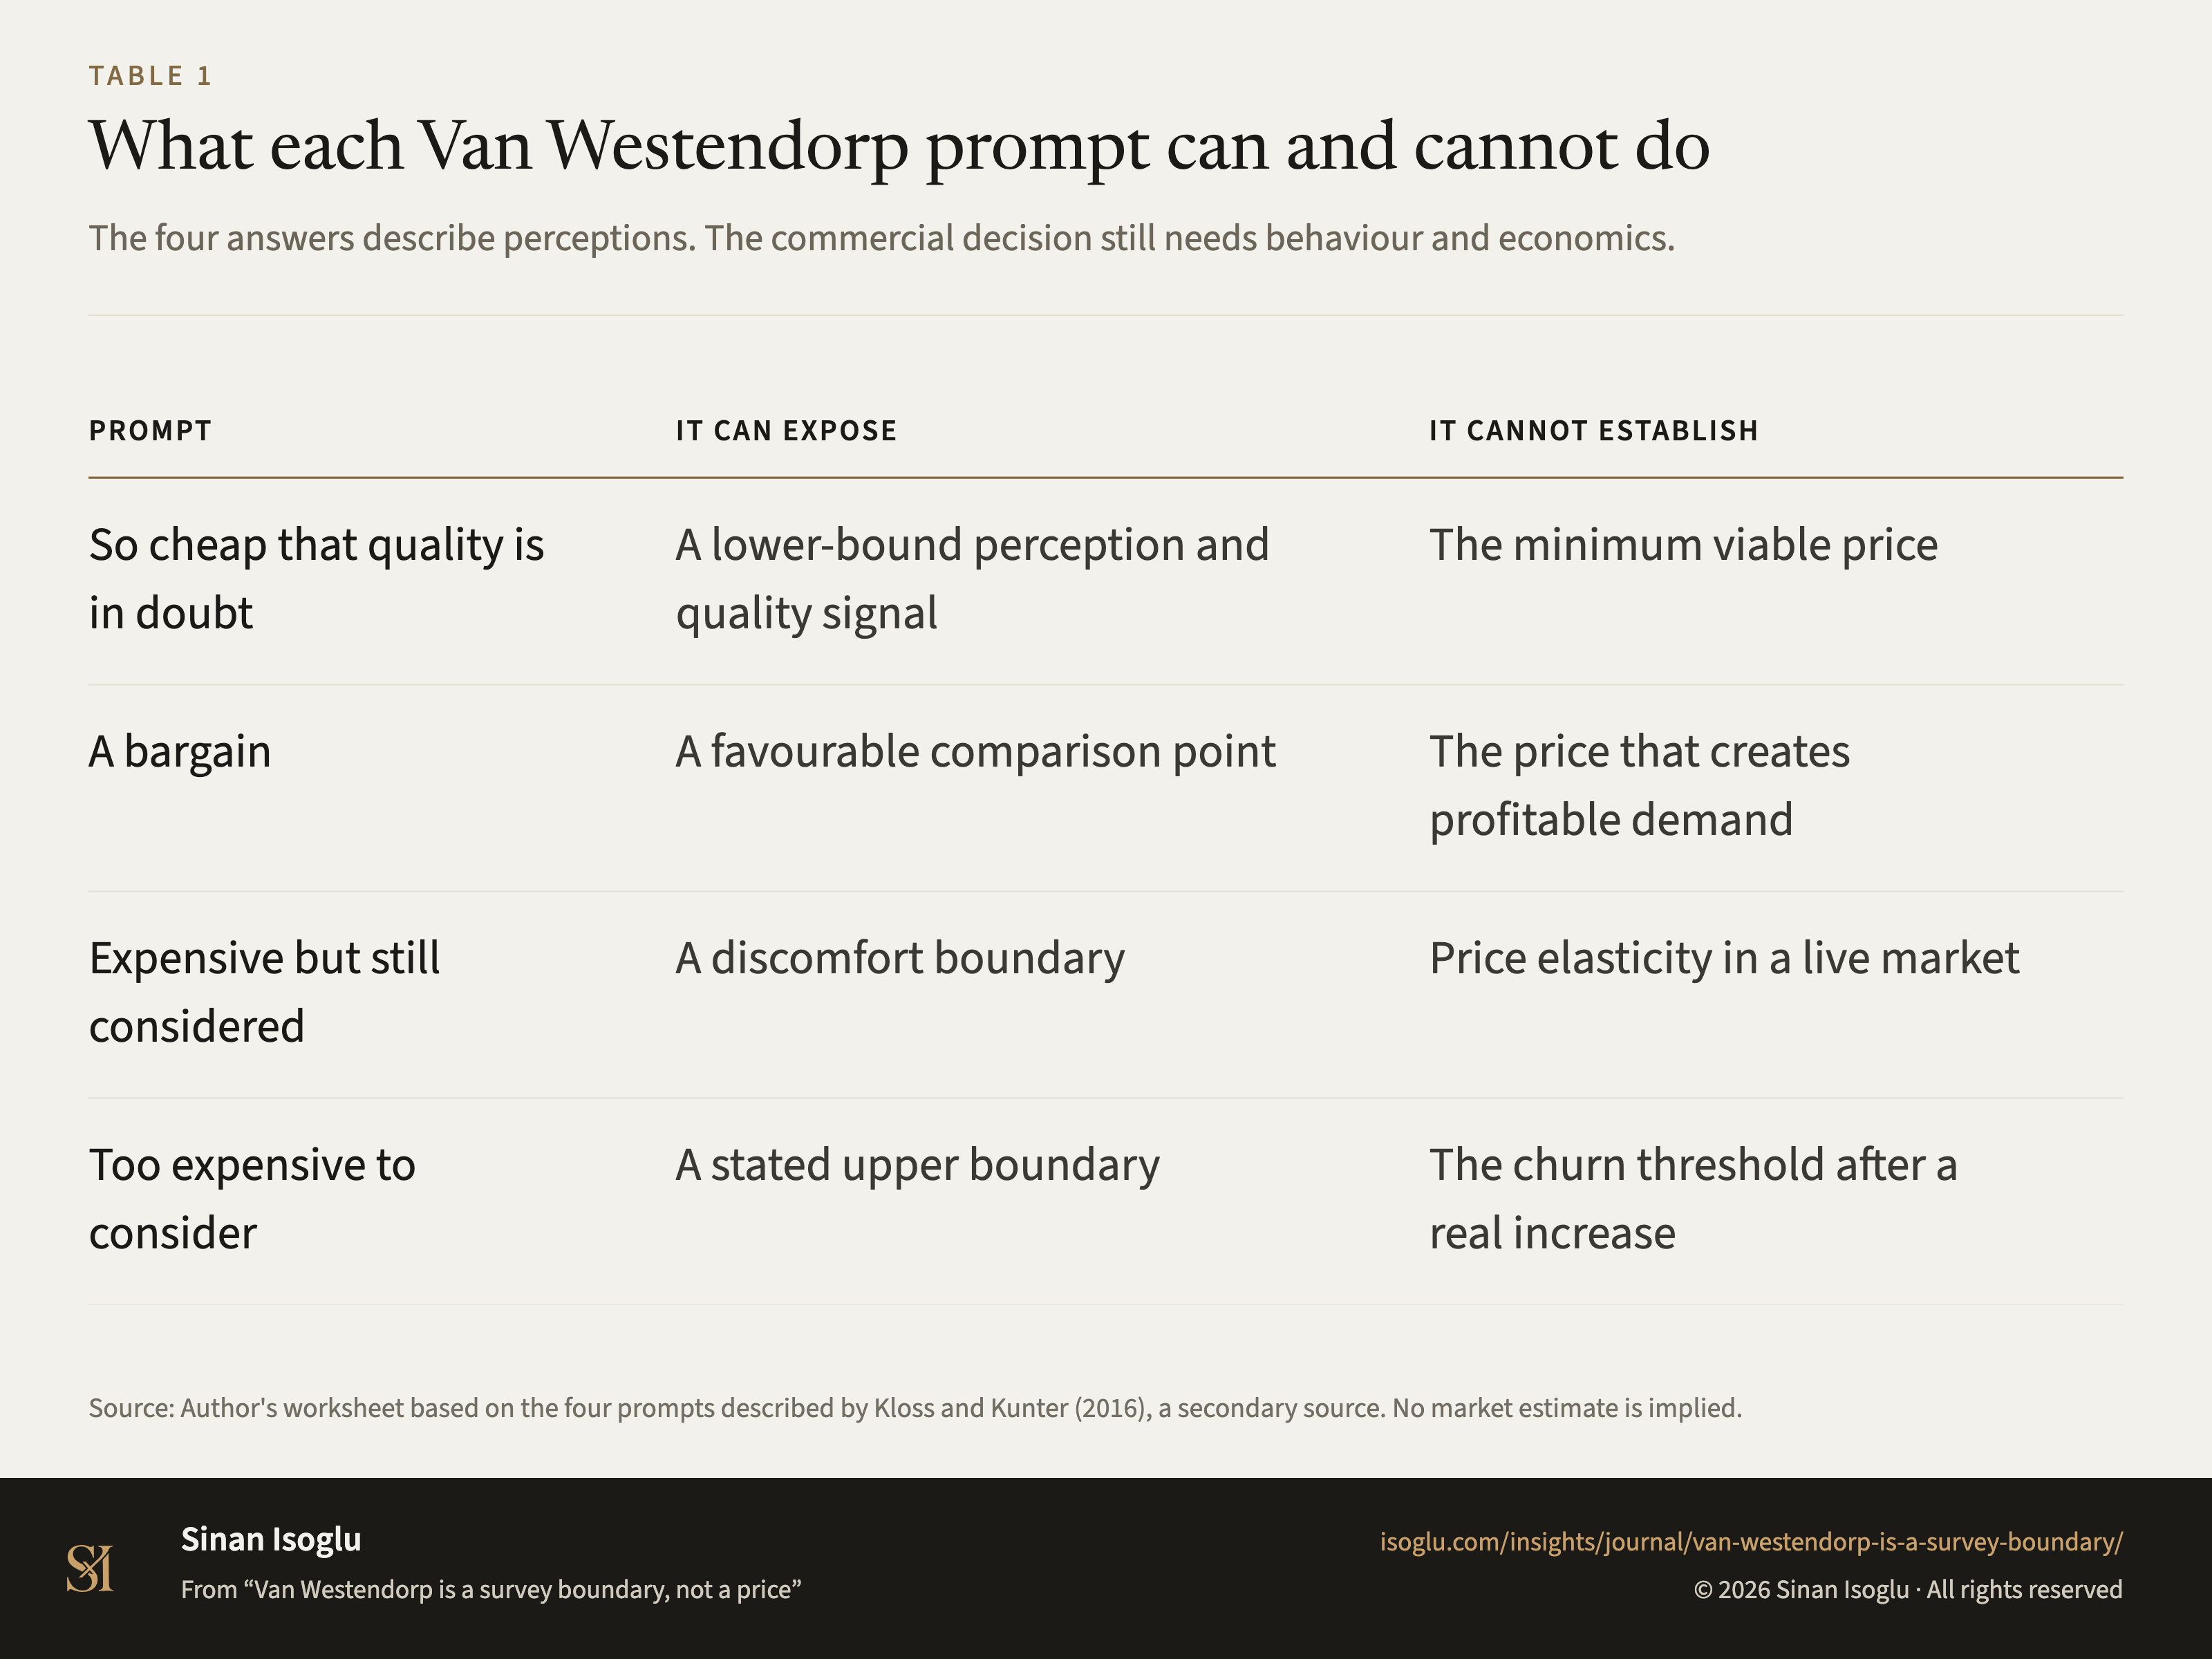
Van Westendorp can map how respondents describe price discomfort. It cannot replace observed demand, a reference-price record or a decision about value.
Read the essayThis exhibit belongs to an essay: the numbers live here, the argument lives there.
Cite or embed
Contact
Bring the question you're working on.
Research, a guest lecture, or a commercial question.