Table 1From “The megadeal wave meets the size effect”
The megadeal evidence is a regime map
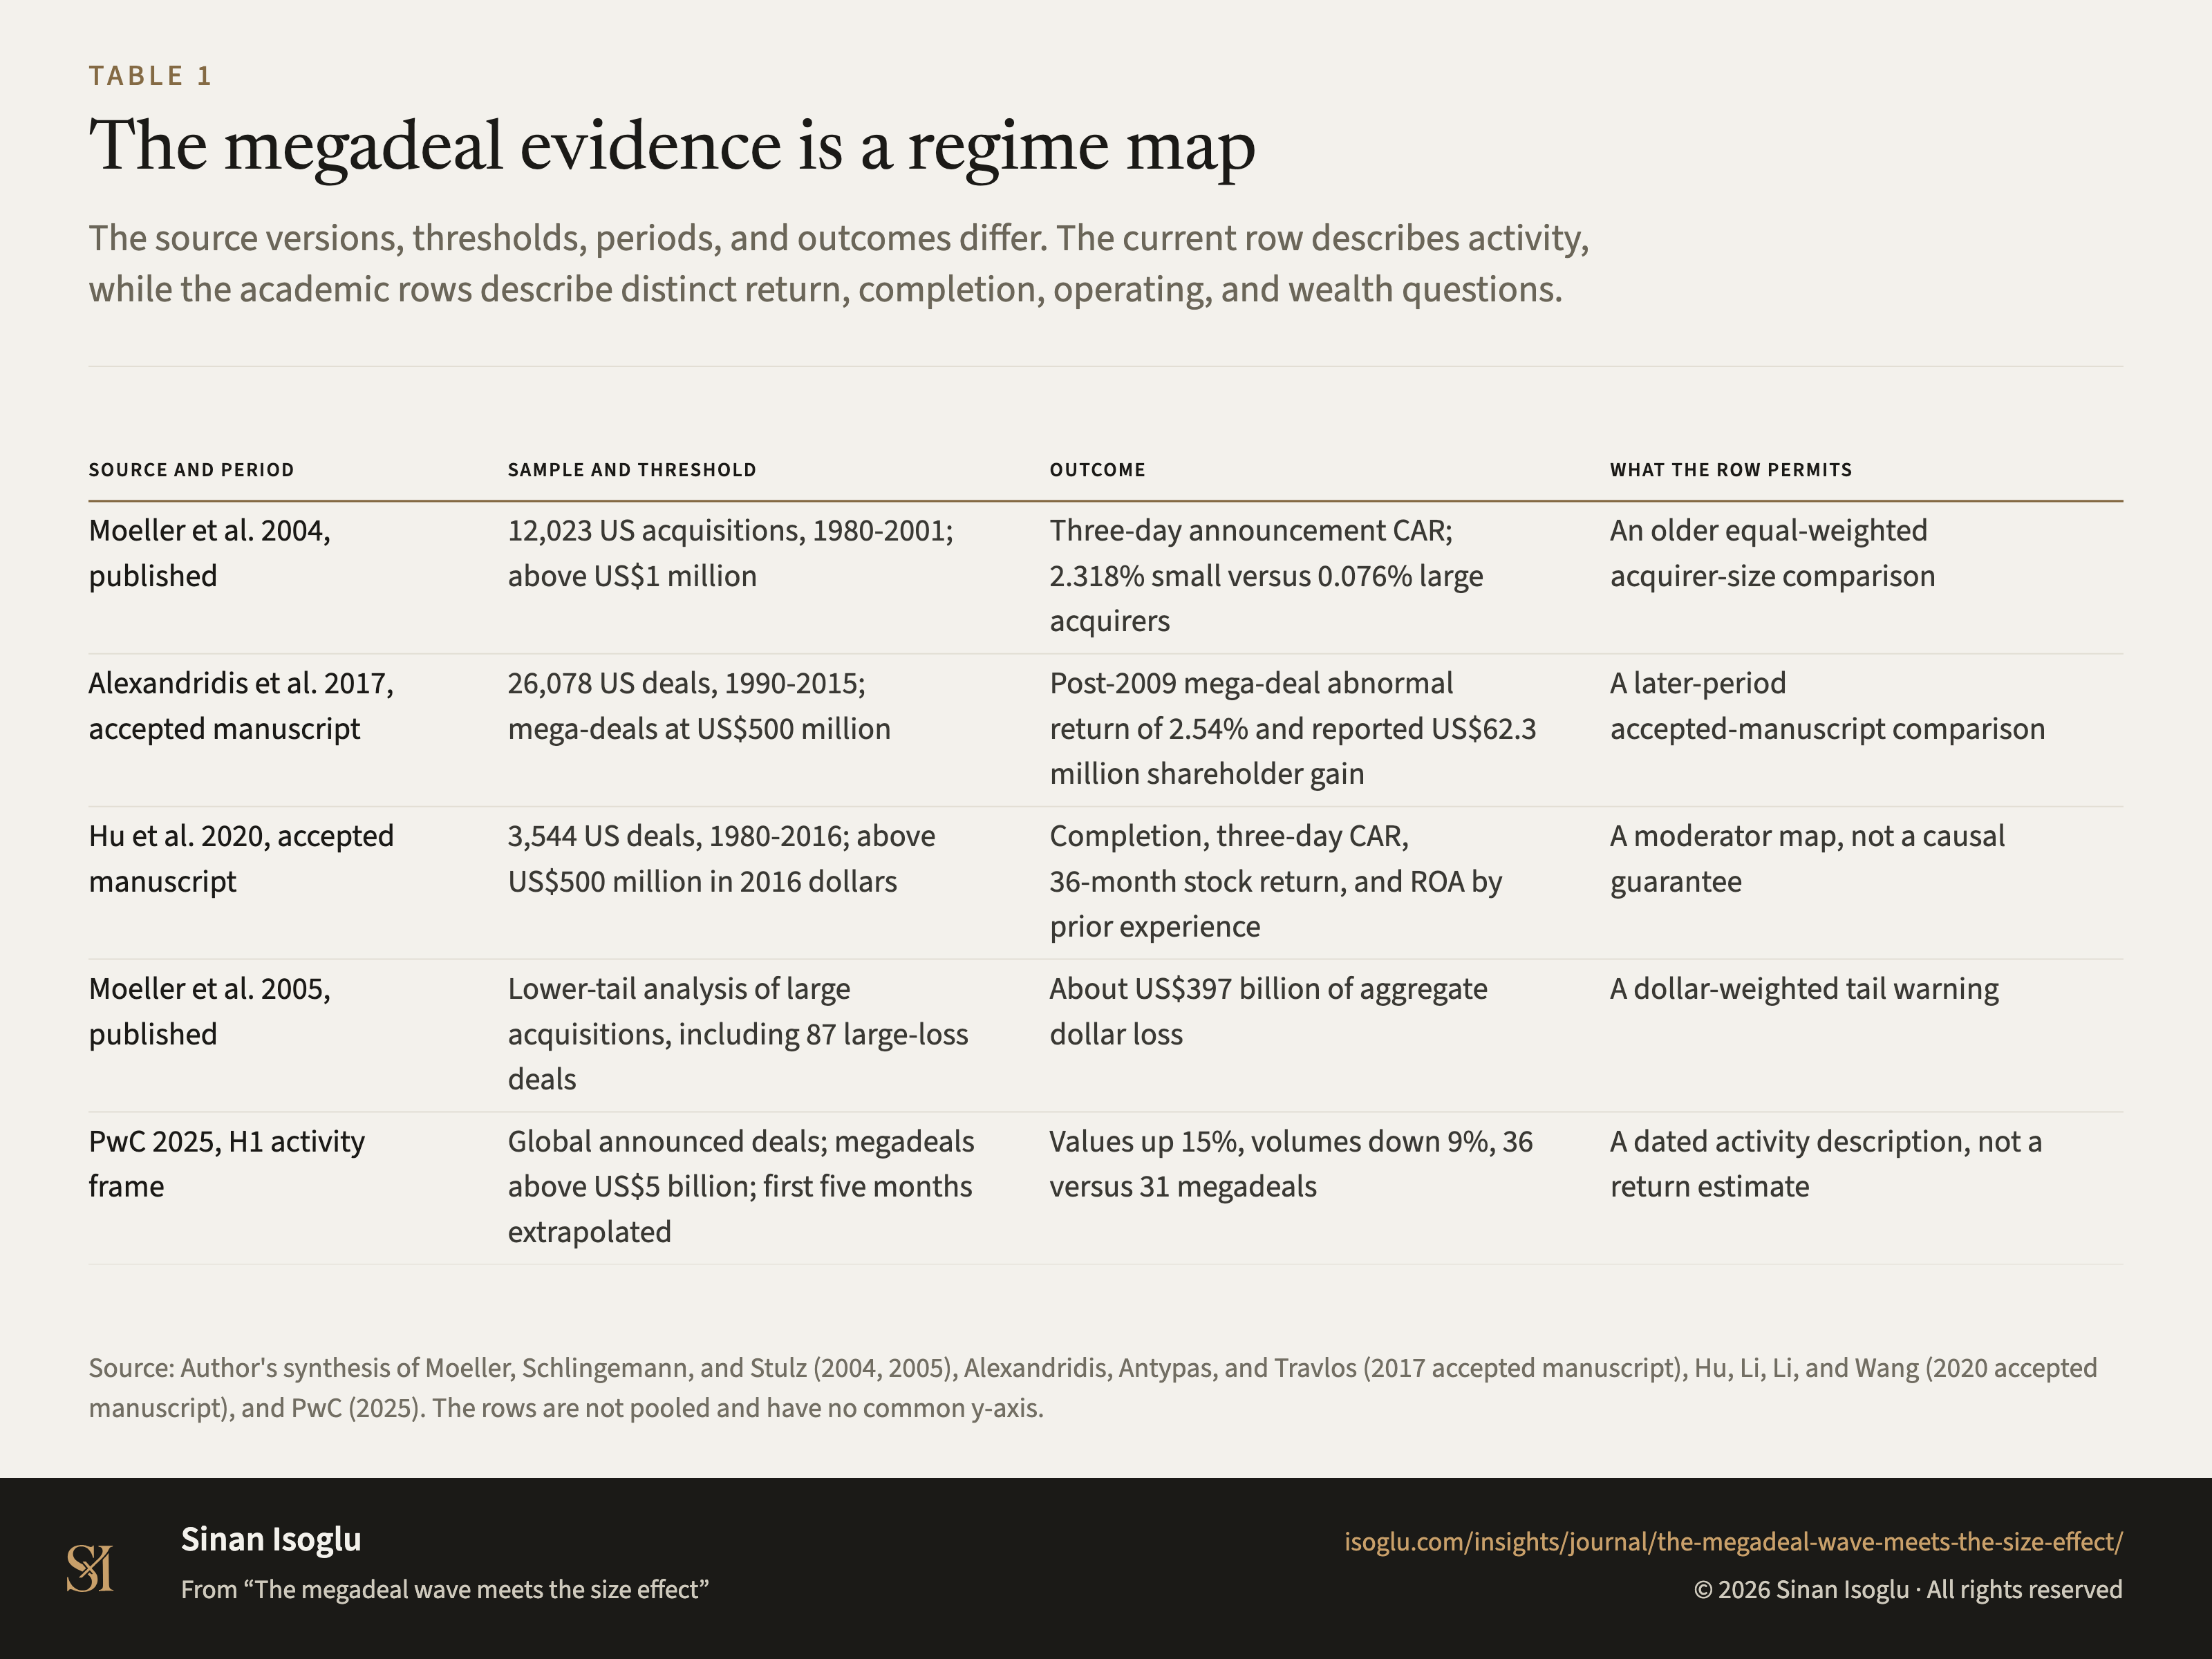
The source versions, thresholds, periods, and outcomes differ. The current row describes activity, while the academic rows describe distinct return, completion, operating, and wealth questions.
Table 1The megadeal evidence is a regime map
| Source and period | Sample and threshold | Outcome | What the row permits |
|---|---|---|---|
| Moeller et al. 2004, published | 12,023 US acquisitions, 1980-2001; above US\$1 million | Three-day announcement CAR; 2.318% small versus 0.076% large acquirers | An older equal-weighted acquirer-size comparison |
| Alexandridis et al. 2017, accepted manuscript | 26,078 US deals, 1990-2015; mega-deals at US\$500 million | Post-2009 mega-deal abnormal return of 2.54% and reported US\$62.3 million shareholder gain | A later-period accepted-manuscript comparison |
| Hu et al. 2020, accepted manuscript | 3,544 US deals, 1980-2016; above US\$500 million in 2016 dollars | Completion, three-day CAR, 36-month stock return, and ROA by prior experience | A moderator map, not a causal guarantee |
| Moeller et al. 2005, published | Lower-tail analysis of large acquisitions, including 87 large-loss deals | About US\$397 billion of aggregate dollar loss | A dollar-weighted tail warning |
| PwC 2025, H1 activity frame | Global announced deals; megadeals above US\$5 billion; first five months extrapolated | Values up 15%, volumes down 9%, 36 versus 31 megadeals | A dated activity description, not a return estimate |
Swipe or scroll horizontally if the table is wider than your screen.
Source: Author's synthesis of Moeller, Schlingemann, and Stulz (2004, 2005), Alexandridis, Antypas, and Travlos (2017 accepted manuscript), Hu, Li, Li, and Wang (2020 accepted manuscript), and PwC (2025). The rows are not pooled and have no common y-axis.
Source and evidence
Each line names a claim related to this exhibit, its source, and how it was checked.
- A P03-C1 Moeller, Schlingemann and Stulz, verbatim: "We examine a sample of 12,023 acquisitions by public firms from 1980 to 2001", where "The equally weighted abnormal announcement return is 1.1%, but acquiring-firm shareholders lose $25.2 million on average upon announcement", and "The announcement return for acquiring-firm shareholders is roughly two percentage points higher for small acquirers"Moeller, Schlingemann & Stulz. (2004)
- B P03-C2 The accepted manuscript of Alexandridis, Antypas, and Travlos reports a post-2009 mega-deal comparison with a 2.54% abnormal return and a reported US$62.3 million shareholder gainAlexandridis, Antypas & Travlos. (2017, accepted manuscript)
- B P03-C3 The accepted manuscript of Hu, Li, Li, and Wang studies 3,544 US deals above US$500 million in 2016 dollars and separates completion, three-day CAR, 36-month stock return, and ROA by prior experienceHu, Li, Li & Wang. (2020, accepted manuscript)
- A P03-C4 Moeller, Schlingemann, and Stulz document concentration of large dollar losses, including 87 large-loss deals accounting for about US$397 billion in the lower-tail analysisMoeller, Schlingemann & Stulz. (2005)
- B P03-C5 PwC reports that between the compared H1 2024 and H1 2025 first-five-month periods, deal values increased 15%, volumes decreased 9%, and megadeals numbered 36 versus 31PwC. (2025)
- B P03-C6 PwC's H1 2025 frame is descriptive and bounded by its global announced-deal method, first-five-month extrapolation, and greater-than-US$5-billion megadeal thresholdPwC. (2025)
Grades: A, verified against the printed page of the primary source · B, primary source, text layer only · C, authoritative secondary · D, reported.
From the essay
Growth that compounds
The megadeal wave meets the size effect
Large deals are back in the market. Older size evidence, newer mega-deal research, and 2025 activity data answer three different questions.
Read the essayThis exhibit belongs to an essay: the numbers live here, the argument lives there.
Cite or embed
Related exhibits
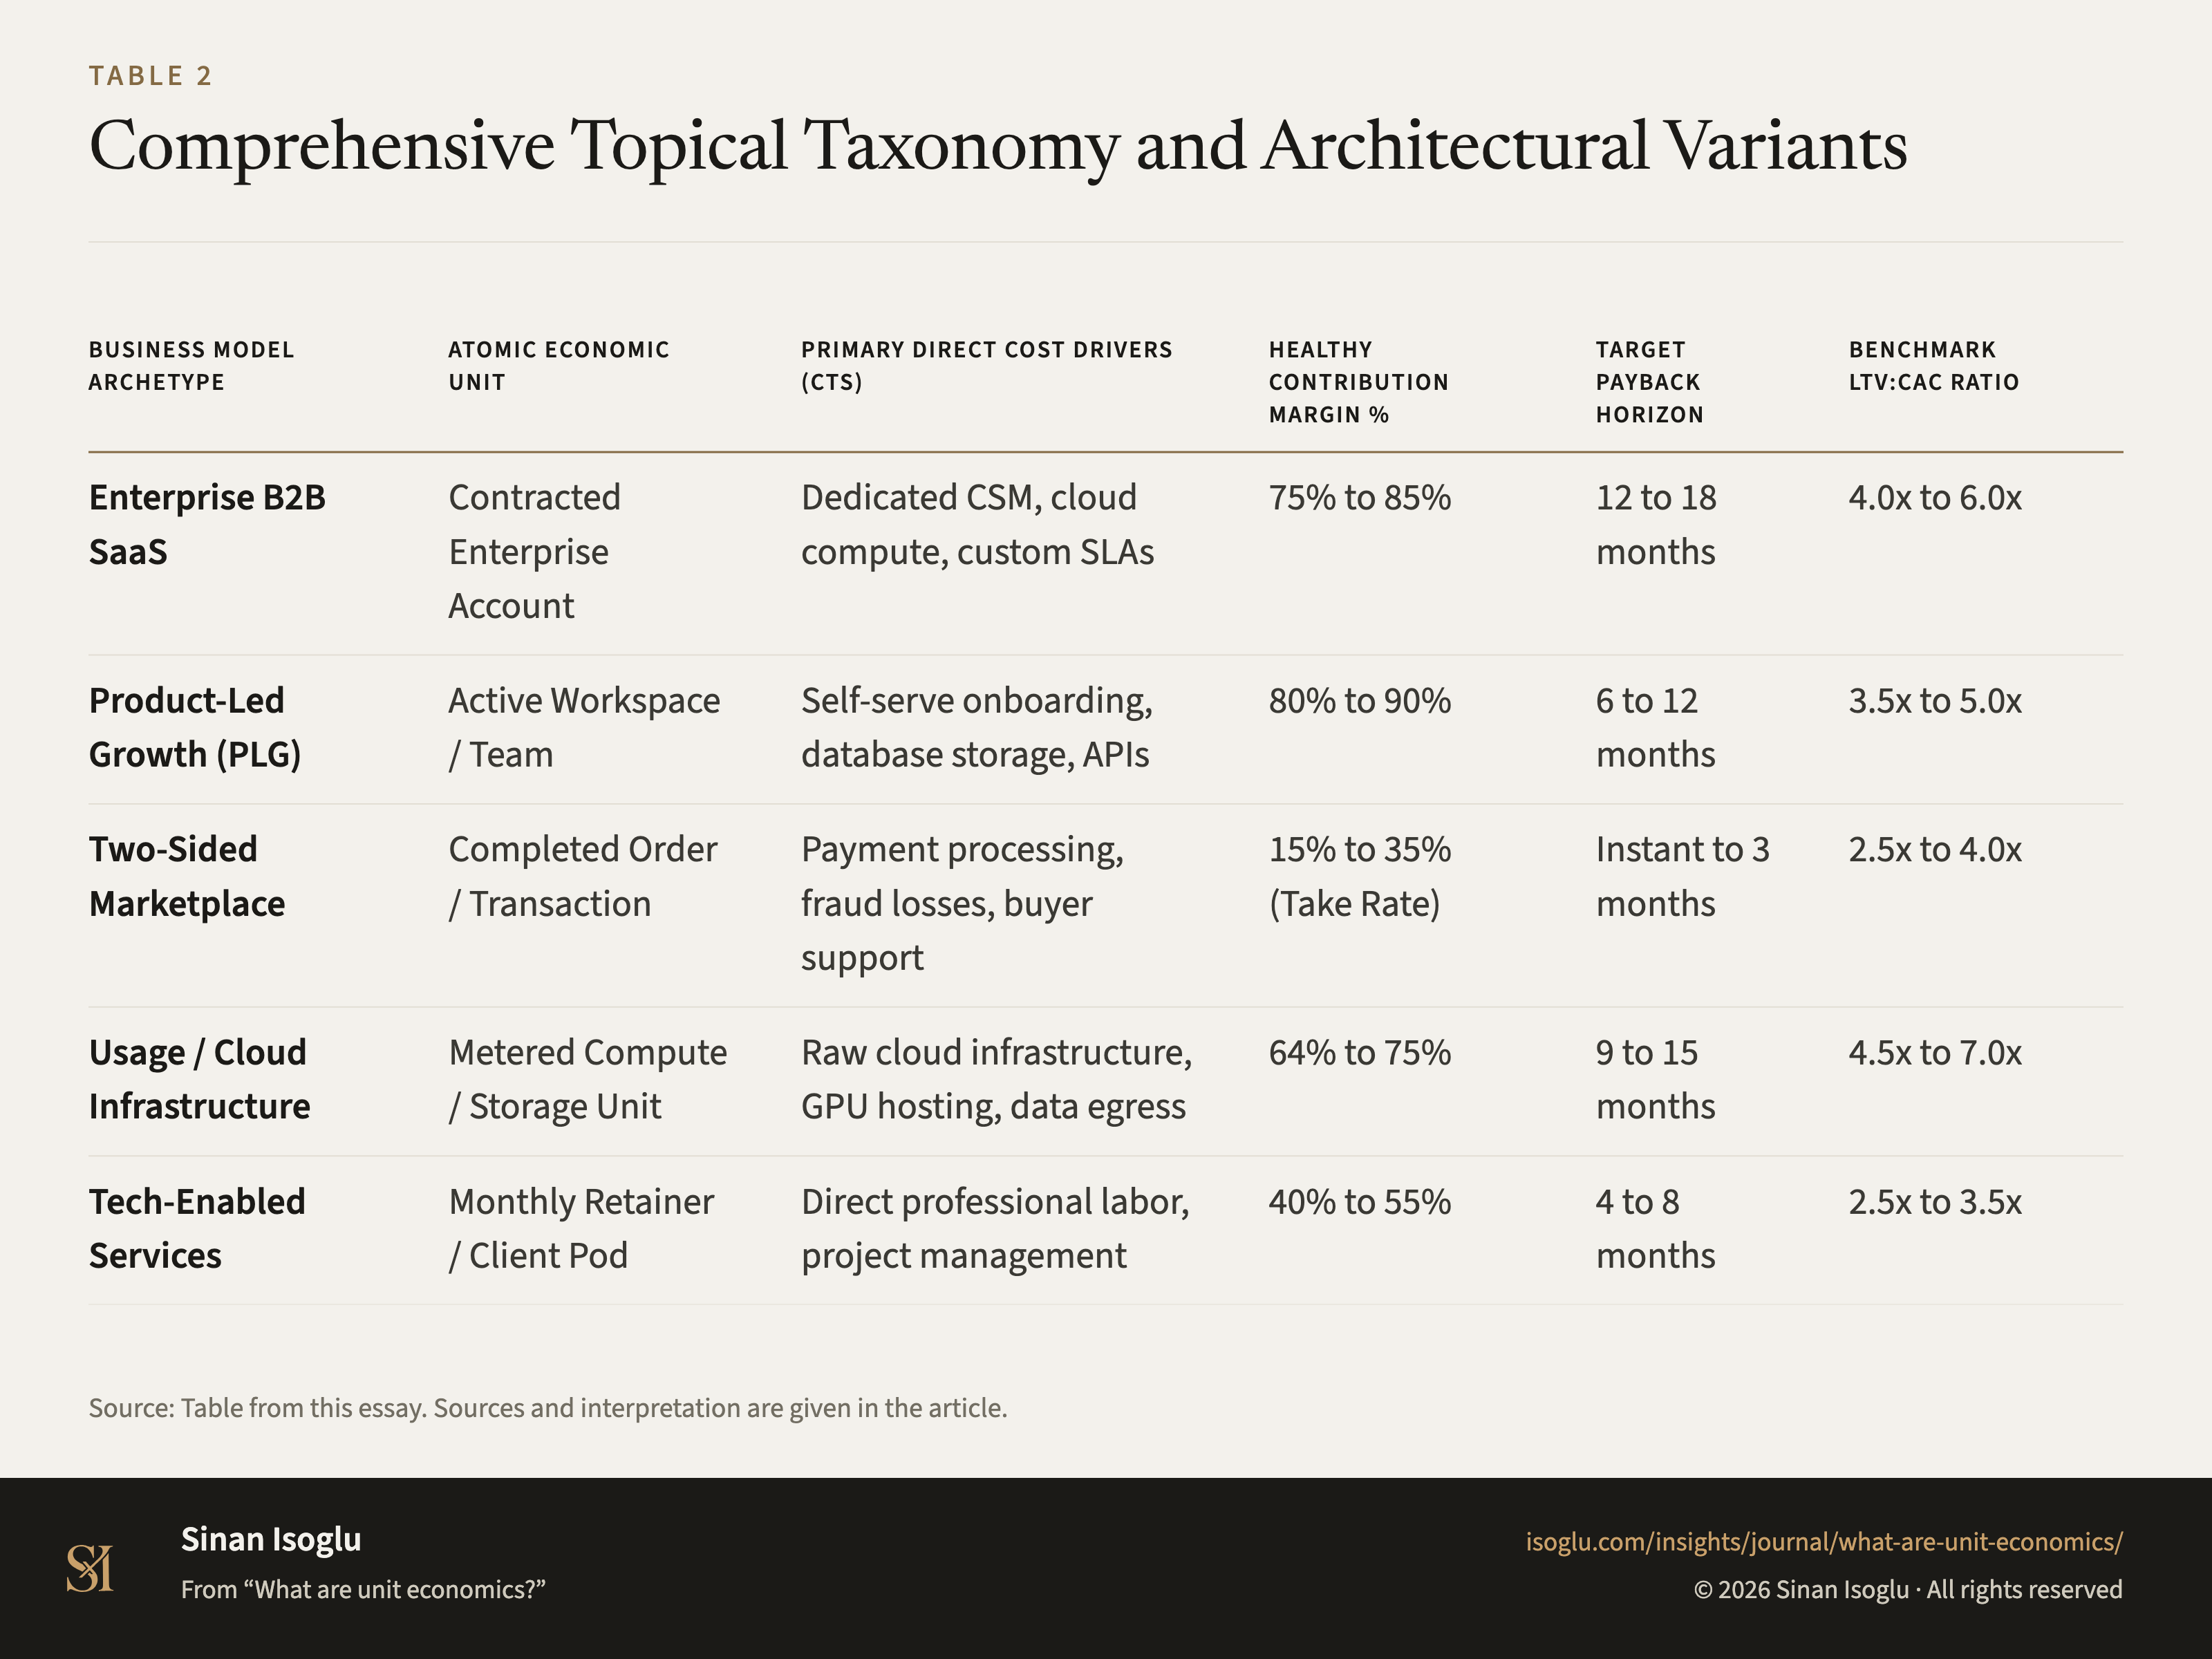
Table 1Table
How do unit economics differ by operating model?
What are unit economics?
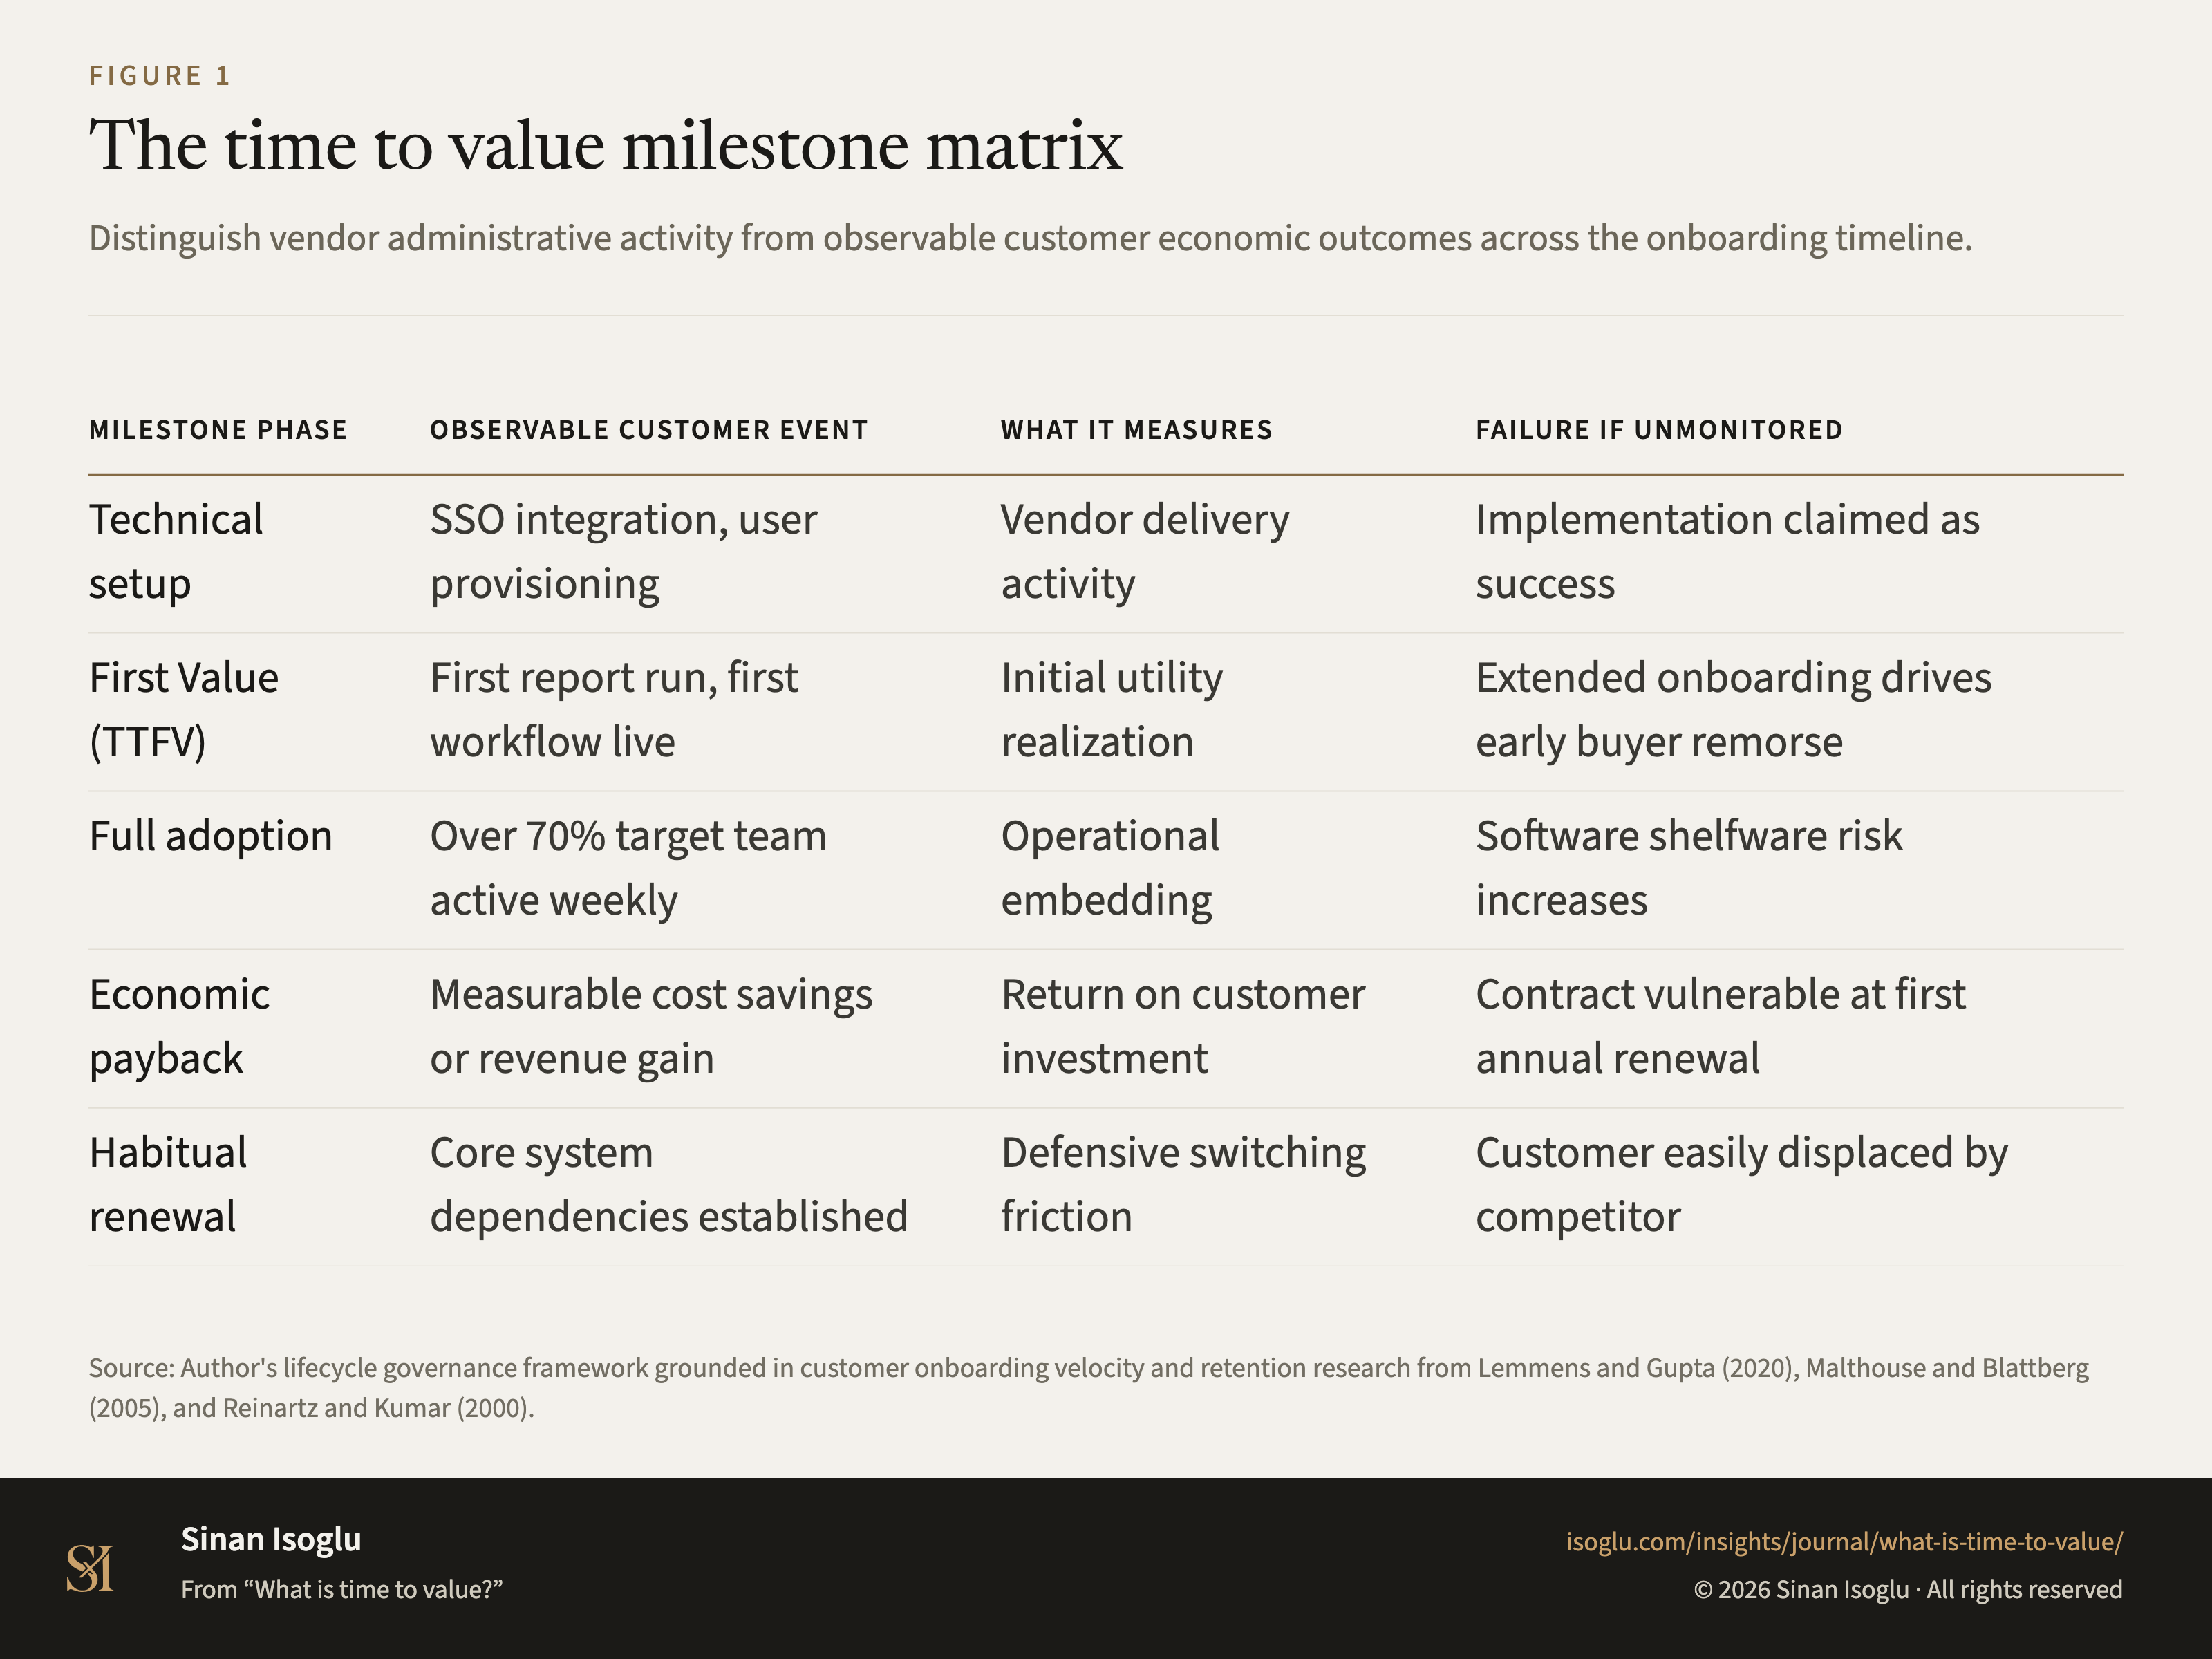
Figure 1Figure
The time to value milestone matrix
What is time to value?
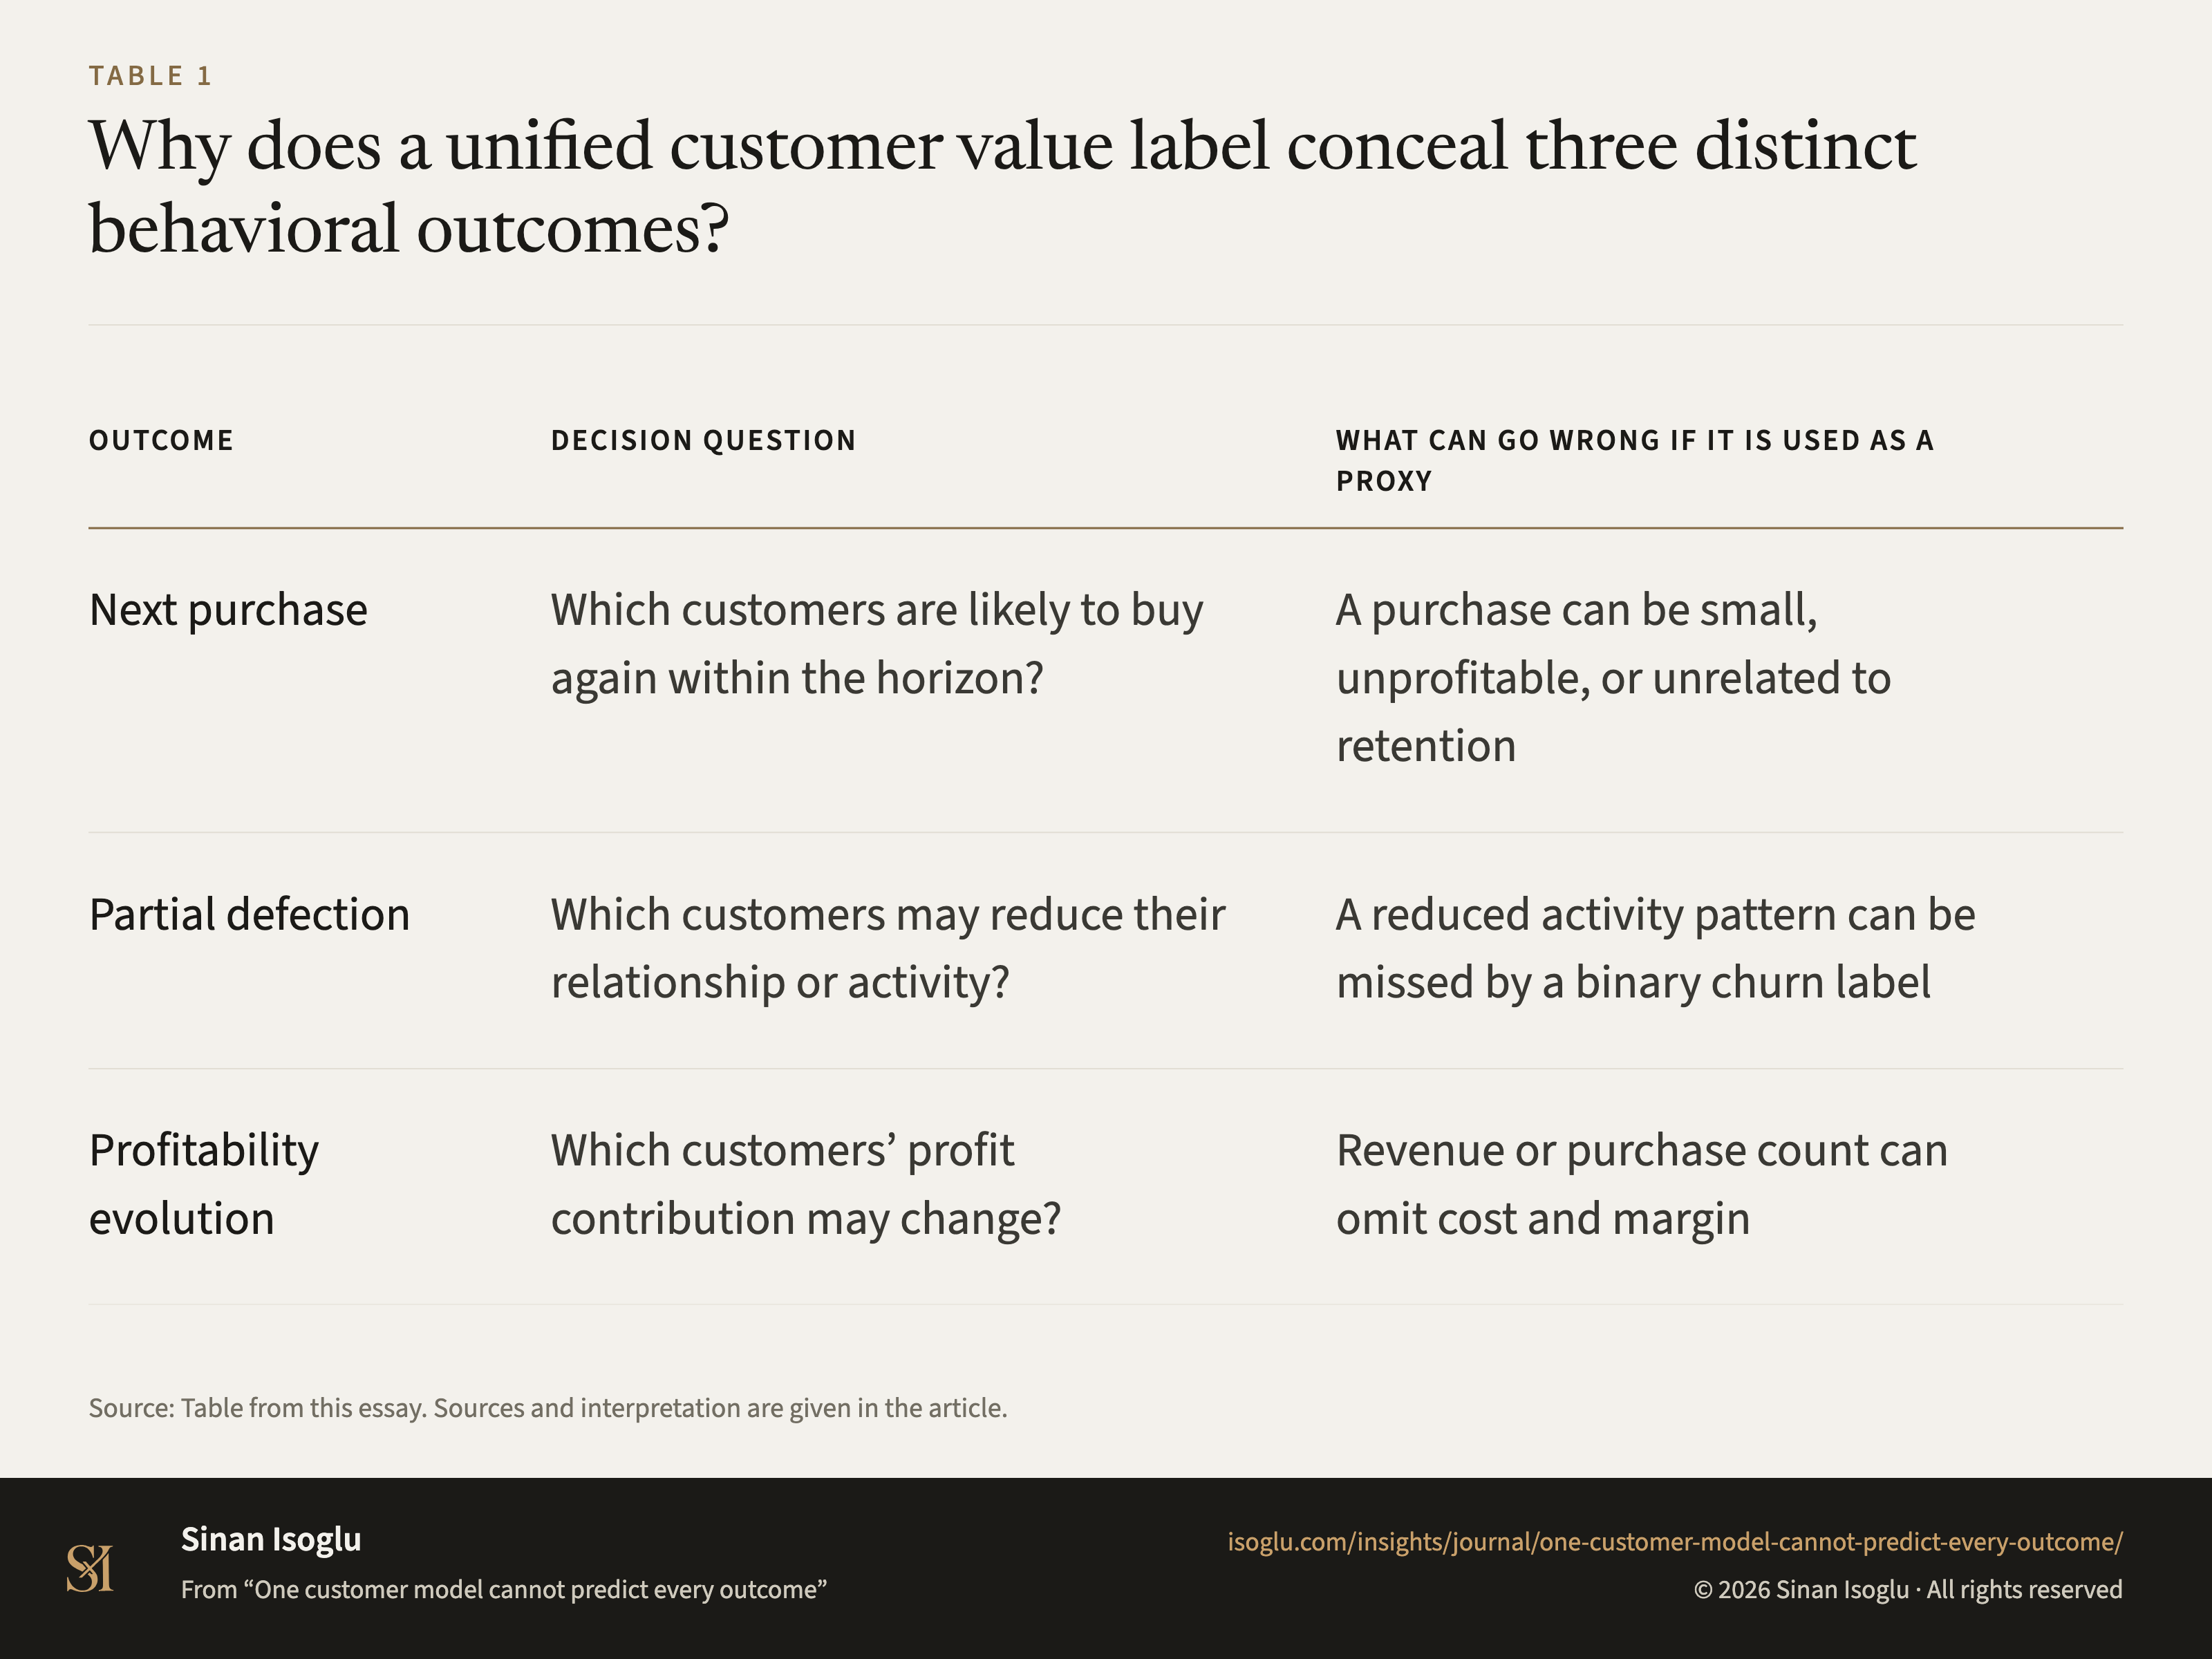
Table 1Table
Why does a unified customer value label conceal three distinct behavioral outcomes?
One customer model cannot predict every outcome
Contact
Bring the question you're working on.
Research, a guest lecture, or a commercial question.