Figure 1From “What is time to value?”
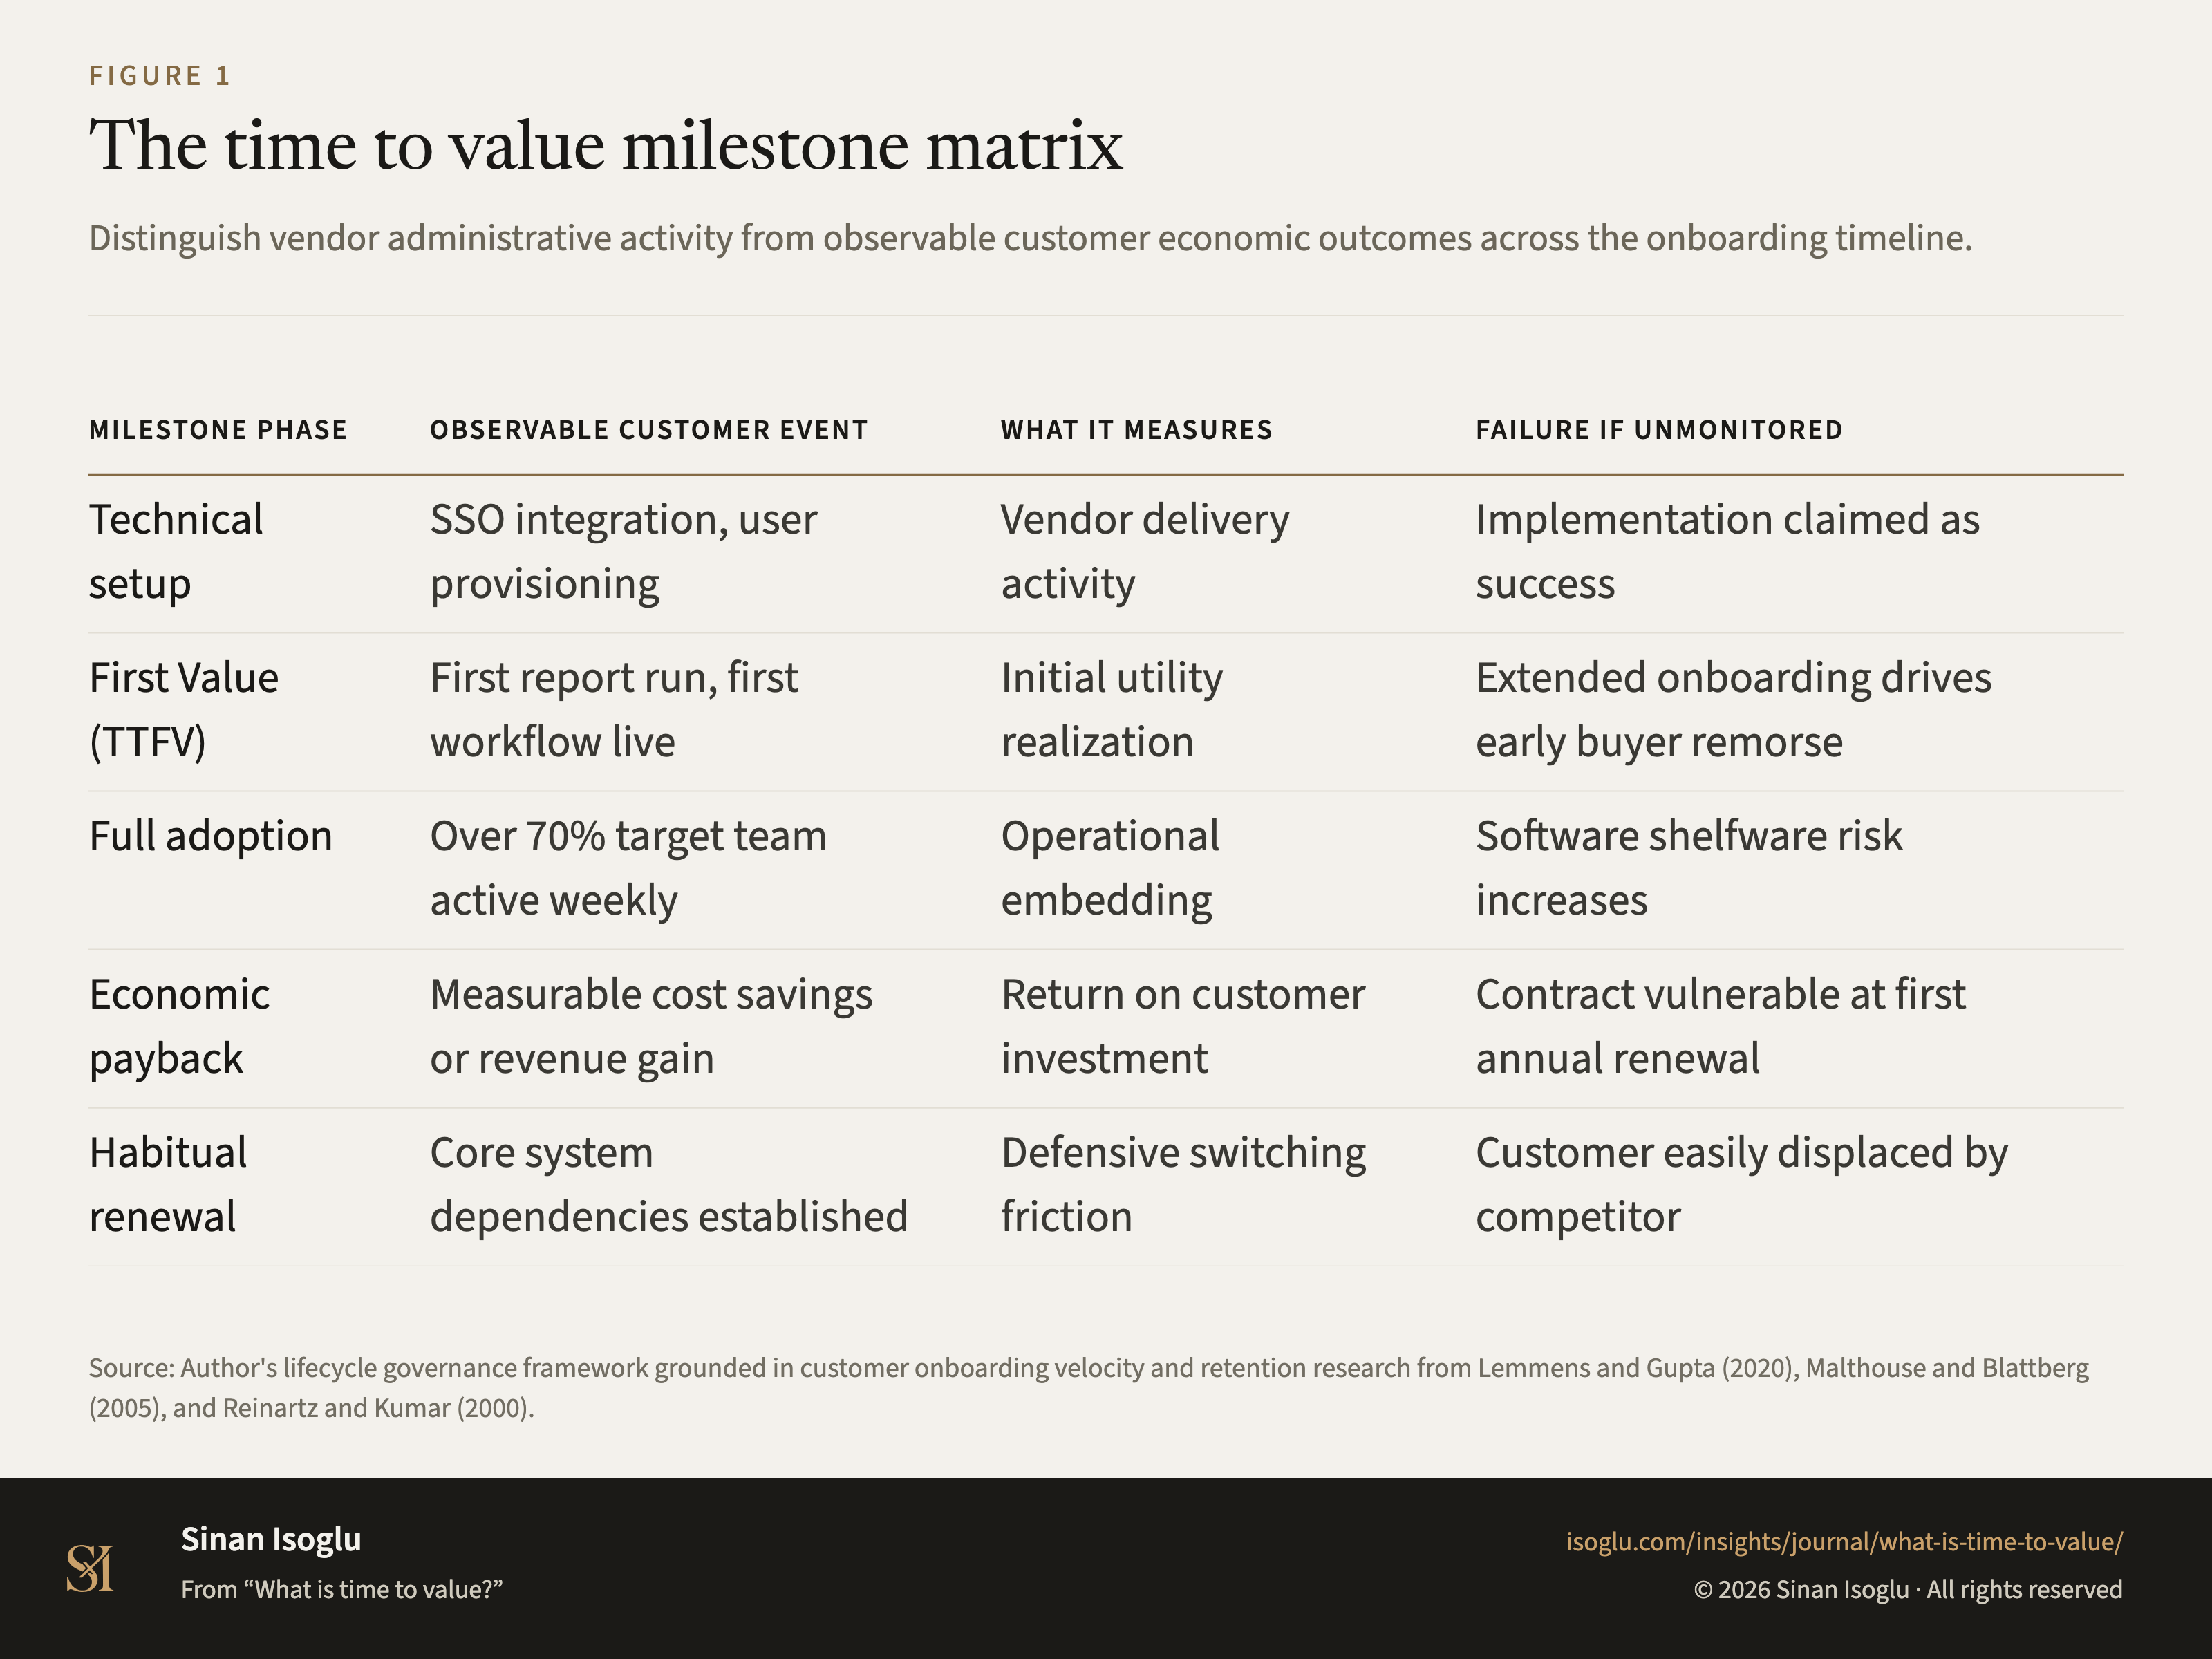
The time to value milestone matrix
Distinguish vendor administrative activity from observable customer economic outcomes across the onboarding timeline.
Figure 1The time to value milestone matrix
| Milestone phase | Observable customer event | What it measures | Failure if unmonitored |
|---|---|---|---|
| Technical setup | SSO integration, user provisioning | Vendor delivery activity | Implementation claimed as success |
| First Value (TTFV) | First report run, first workflow live | Initial utility realization | Extended onboarding drives early buyer remorse |
| Full adoption | Over 70% target team active weekly | Operational embedding | Software shelfware risk increases |
| Economic payback | Measurable cost savings or revenue gain | Return on customer investment | Contract vulnerable at first annual renewal |
| Habitual renewal | Core system dependencies established | Defensive switching friction | Customer easily displaced by competitor |
Swipe or scroll horizontally if the table is wider than your screen.
Source: Author's lifecycle governance framework grounded in customer onboarding velocity and retention research from Lemmens and Gupta (2020), Malthouse and Blattberg (2005), and Reinartz and Kumar (2000).
From the essay
Growth that compounds
What is time to value?
Time to value measures the elapsed duration from purchase to observable customer benefit. Distinguish technical completion from value realization.
Read the essayThis exhibit belongs to an essay: the numbers live here, the argument lives there.
Cite or embed
Contact
Bring the question you're working on.
Research, a guest lecture, or a commercial question.