Figure 5From “Porter's five forces: industry explains less than the firm does”
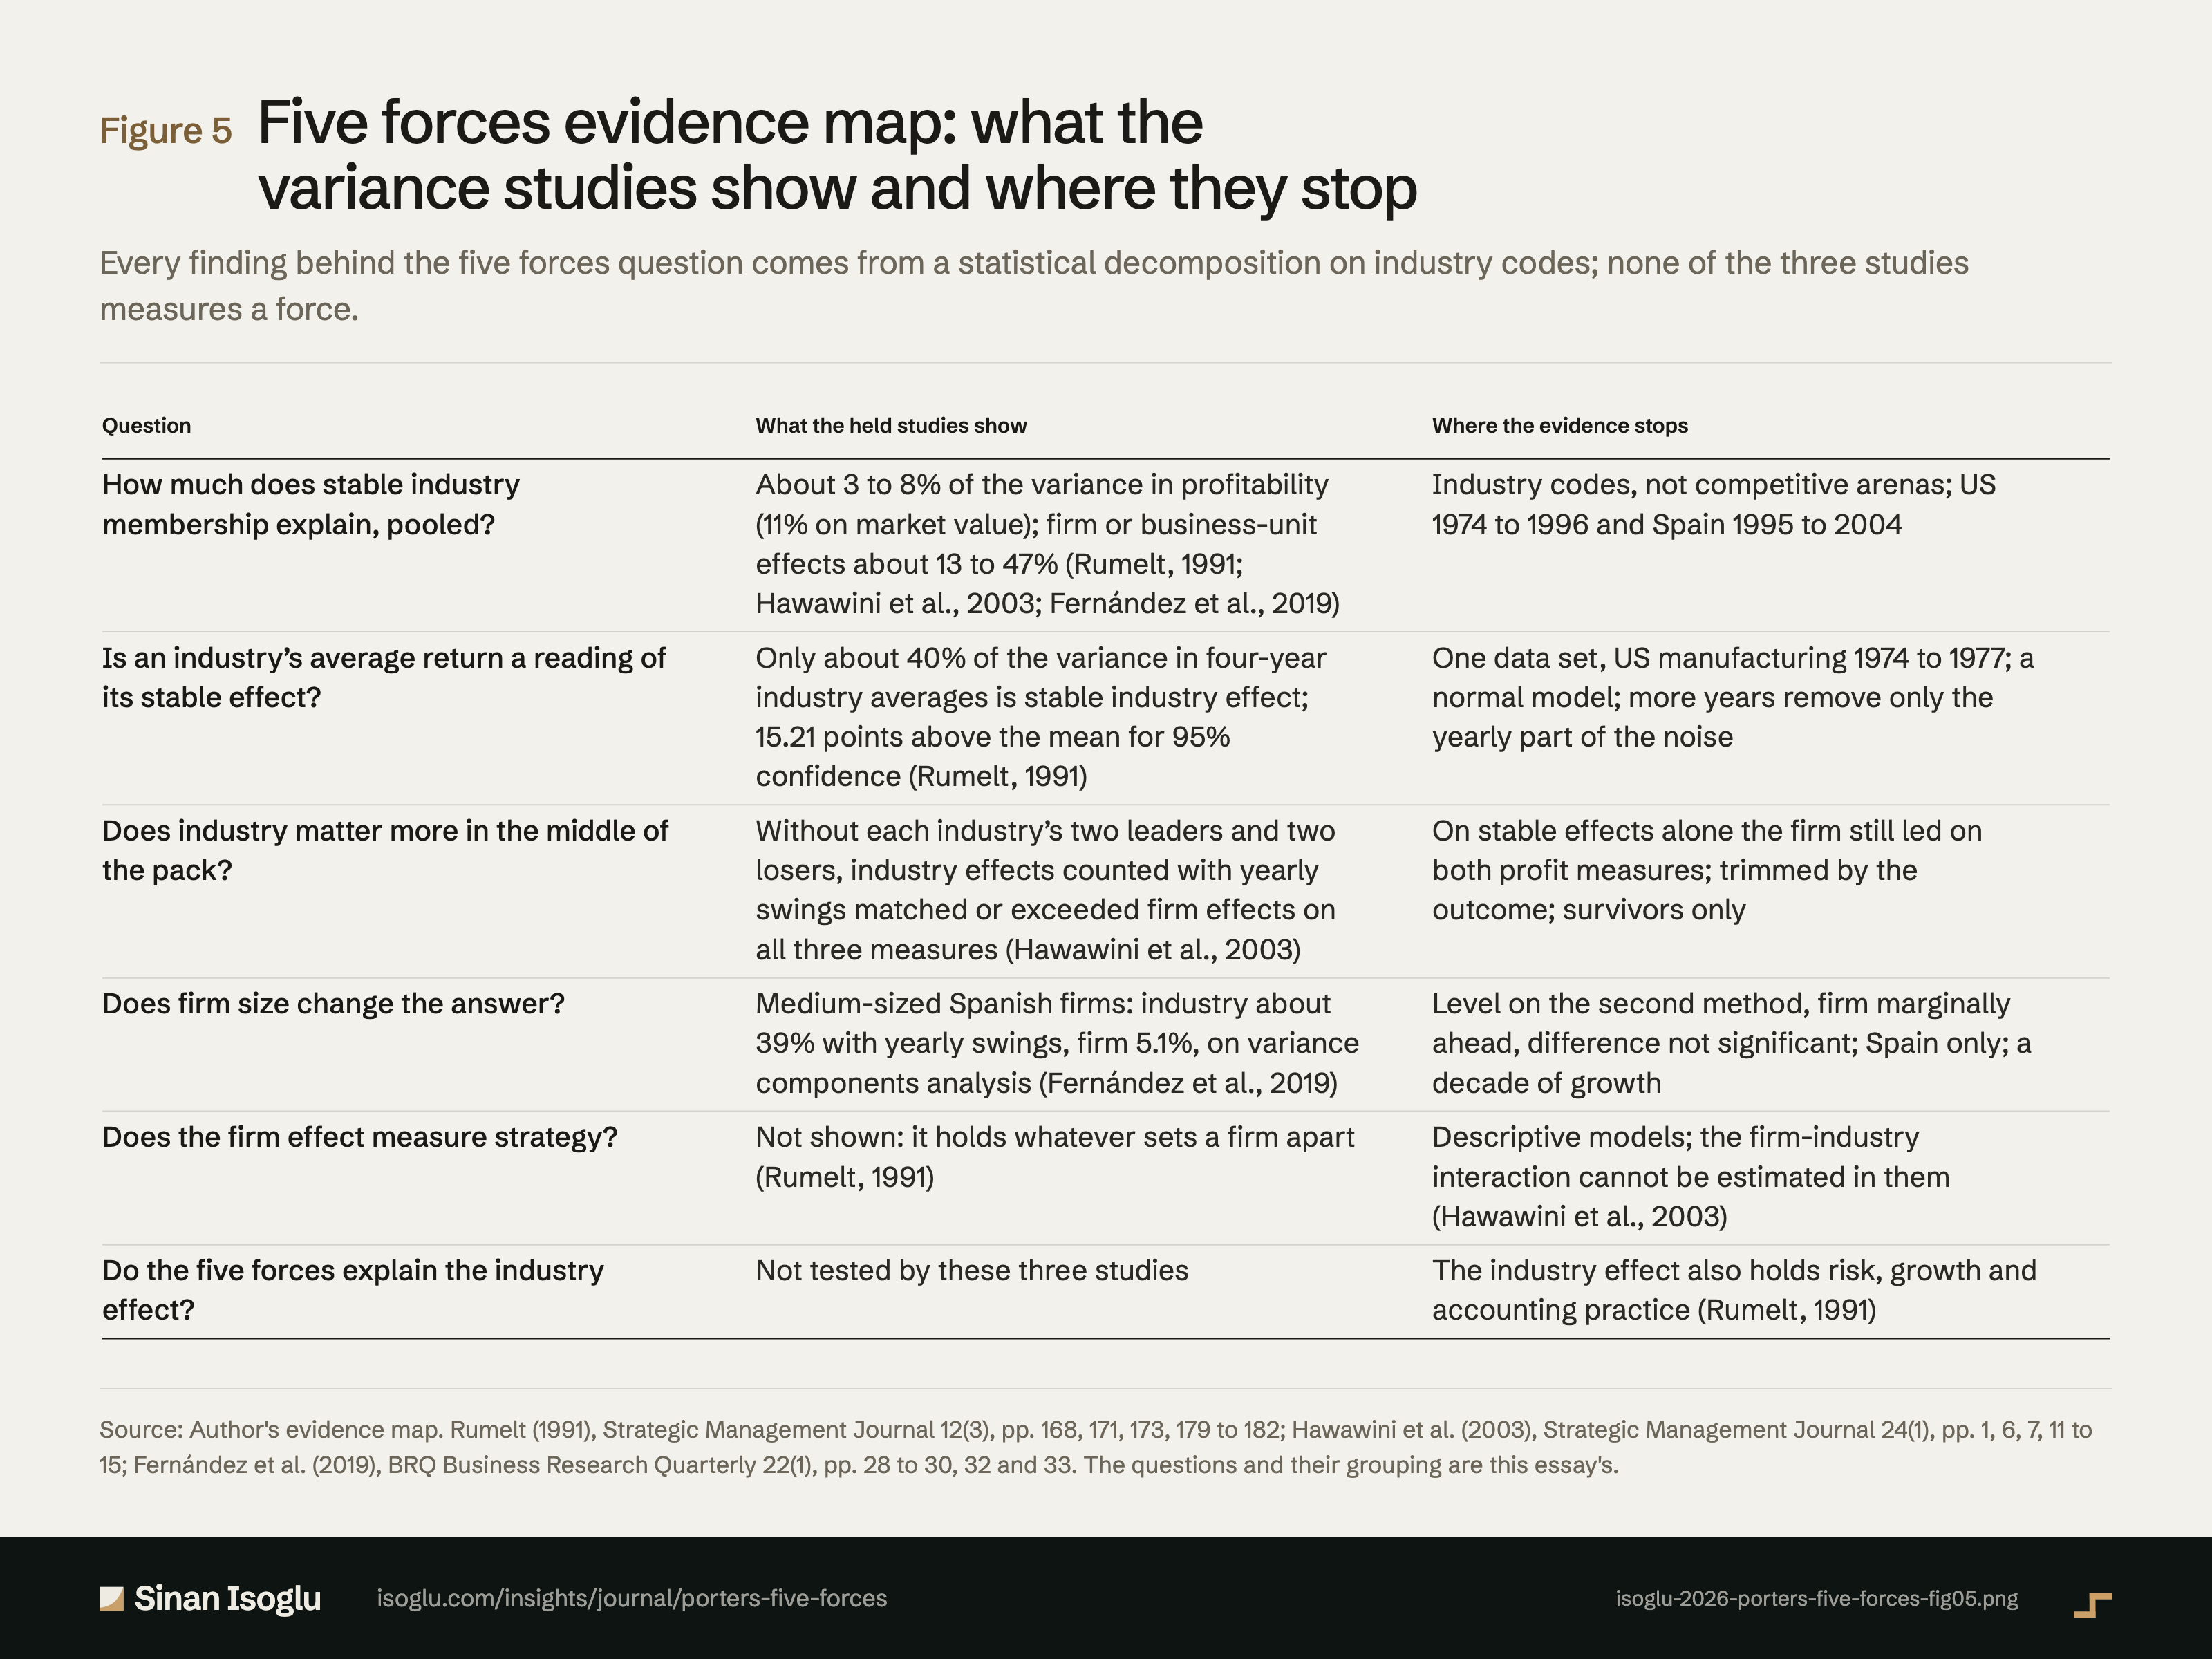
Five forces evidence map: what the variance studies show and where they stop
Every finding behind the five forces question comes from a statistical decomposition on industry codes; none of the three studies measures a force.
Figure 5Five forces evidence map: what the variance studies show and where they stop
| Question | What the held studies show | Where the evidence stops |
|---|---|---|
| How much does stable industry membership explain, pooled? | About 3 to 8% of the variance in profitability (11% on market value); firm or business-unit effects about 13 to 47% (Rumelt, 1991; Hawawini et al., 2003; Fernández et al., 2019) | Industry codes, not competitive arenas; US 1974 to 1996 and Spain 1995 to 2004 |
| Is an industry's average return a reading of its stable effect? | Only about 40% of the variance in four-year industry averages is stable industry effect; 15.21 points above the mean for 95% confidence (Rumelt, 1991) | One data set, US manufacturing 1974 to 1977; a normal model; more years remove only the yearly part of the noise |
| Does industry matter more in the middle of the pack? | Without each industry's two leaders and two losers, industry effects counted with yearly swings matched or exceeded firm effects on all three measures (Hawawini et al., 2003) | On stable effects alone the firm still led on both profit measures; trimmed by the outcome; survivors only |
| Does firm size change the answer? | Medium-sized Spanish firms: industry about 39% with yearly swings, firm 5.1%, on variance components analysis (Fernández et al., 2019) | Level on the second method, firm marginally ahead, difference not significant; Spain only; a decade of growth |
| Does the firm effect measure strategy? | Not shown: it holds whatever sets a firm apart (Rumelt, 1991) | Descriptive models; the firm-industry interaction cannot be estimated in them (Hawawini et al., 2003) |
| Do the five forces explain the industry effect? | Not tested by these three studies | The industry effect also holds risk, growth and accounting practice (Rumelt, 1991) |
Swipe or scroll horizontally if the table is wider than your screen.
Source: Author's evidence map. Rumelt (1991), Strategic Management Journal 12(3), pp. 168, 171, 173, 179 to 182; Hawawini et al. (2003), Strategic Management Journal 24(1), pp. 1, 6, 7, 11 to 15; Fernández et al. (2019), BRQ Business Research Quarterly 22(1), pp. 28 to 30, 32 and 33. The questions and their grouping are this essay's.
Source and evidence
Each line names a claim related to this exhibit, its source, and how it was checked.
- A A verified against the printed page of the primary sourceB primary source, text layer onlyC authoritative secondaryD reported Partition of business-unit returns, restricted model: sample A (B) 8 (4) percent stable industry, 1 (2) corporate, 46 (44) business unit, 8 (5) industry-year, 37 (45) residual; Table 4 for sample A: 8.28, 7.84, 0.80, 46.38, 36.70 (sum 100.00); Table 3 for sample B: 4.03, 5.38, 1.64, 44.17, 44.79; business-unit variance six (eleven) times the industry variance; Table 3 prints 36.87 for the sample A error, Table 4 36.70, which sums (pp. 178, 179): "8 (4) percent industry effects, 1 (2) percent corporate effects, 46 (44) percent business-unit effects, 8 (5) percent industry-year effects, and 37 (45) percent residual error"; "business-units differ from one another within industries much more than industries differ from one another"; "six times larger in sample A and eleven times larger in sample B"Rumelt (1991)
- A A verified against the printed page of the primary sourceB primary source, text layer onlyC authoritative secondaryD reported What the components contain: the industry effect is the total of all persistent industry-specific impacts, from competitive behaviour and conditions of entry to risk and accounting practice; business-unit effects are business-specific skills, resources, reputations, learning and patents, and possibly allocation errors, which a test did not support (pp. 173, 178): "reflect differing competitive behavior, conditions of entry, rates of growth, demand-capacity conditions, differing levels of risk, differing asset utilization rates, differing accounting practices"; "they are due to the presence of business-specific skills, resources, reputations, learning, patents, and other intangible contributions to stable differences among business-unit returns"; "These results do not support the view that allocation errors are an important source of heterogeneity"Rumelt (1991)
- A A verified against the printed page of the primary sourceB primary source, text layer onlyC authoritative secondaryD reported The model is descriptive: it offers no causal or structural explanation and deliberately sets causal mechanisms aside (pp. 169, 172): "it offers no causal or structural explanation for profitability differences across industries, years, corporations, or business-units"; "My intention here is to suppress concern with causal mechanisms and focus instead on the question of focus"Rumelt (1991)
- A A verified against the printed page of the primary sourceB primary source, text layer onlyC authoritative secondaryD reported Industry averages are noisy: about 40 percent of the variance among four-year industry average returns is stable industry effect, about another 40 percent business-unit effects that randomly combine in industry averages, the remaining fifth (sample A) industry-year and business-unit-year fluctuations, the only part more years would shrink (Table 5); conditional model with mean 0.4 times the distance above the mean and standard deviation 3.71 (p. 181, read on the page image); at 10 points the estimate is 1.08 standard deviations above zero, probability 0.14 that the effect is negative; 15.21 points needed for 95 percent confidence; on the normal approximation about one in forty, some six of 242 industries, would pass, an expectation, not a tally (pp. 168, 180 to 182): "only about 40 percent of the variance among industry returns is actually due to stable industry effects"; "industry returns are noisy estimates of the true industry effects"; "this estimate is only 1.08 standard deviations above zero"; "the observed industry average must be at least 15.21 percentage points above the mean"; "could be judged (95 percent confidence) to have positive industry effects"; "This portion would be smaller had the averages been taken over more than 4 years"; "Fewer than one in forty industry returns are high enough to pass this test"; "effects which randomly combine to affect industry averages"; "The remaining variance (one-fifth in sample A, one-eighth in sample B) is due to various industry-year and business-unit-year fluctuations"Rumelt (1991)
- A A verified against the printed page of the primary sourceB primary source, text layer onlyC authoritative secondaryD reported Limits the author states: four-digit FTC industries may be too broad; the variance of business-unit effects may differ between industries (p. 182): "industries are simply too broad to reveal the true strength of industry effects"; "some industries being much more heterogeneous than others"Rumelt (1991)
- A A verified against the printed page of the primary sourceB primary source, text layer onlyC authoritative secondaryD reported Full sample, Table 5: firm effects 27.1, 32.5 and 35.8 percent (EP/CE, TMV/CE, ROA); stable industry 6.5, 11.4 and 8.1; industry-year 4.2, 2.9 and 3.1; total industry 10.7, 14.3 and 11.2; stable firm effects more than four times stable industry effects for EP/CE and ROA (p. 11): "Total industry effects for EP/CE, TMV/CE and ROA are 10.7 percent, 14.3 percent, and 11.2 percent, respectively"; "the corresponding figures for stable firm effects are 27.1 percent, 32.5 percent, and 35.8 percent"; "stable firm effects dominate stable industry effects by a factor of more than four"Hawawini, Subramanian and Verdin (2003)
- A A verified against the printed page of the primary sourceB primary source, text layer onlyC authoritative secondaryD reported Middle of the pack, Table 8: industry effects (stable plus transient, as the authors compare them) 18.2 against firm 17.6 percent for EP/CE, 20.1 against 16.7 for ROA, 35.2 against 17.0 for TMV/CE; on stable industry effects alone 12.4 against 17.6 (EP/CE), 16.0 against 16.7 (ROA), 30.2 against 17.0 (TMV/CE); the transient component measures sensitivity to business cycles; firm-specific assets matter more only for the few leaders and losers (pp. 1, 7, 12, 13, 14): "overall industry effects (the sum of stable and transient industry effects) explain 35.2 percent in variation compared to only 17.0 percent for firm effects"; "In the case of EP/CE it is 18.2 percent for industry effects vs. 17.6 percent for firm effects and for ROA it is 20.1 percent against 16.7 percent"; "only for a few dominant value creators (leaders) and destroyers (losers) do firm-specific assets seem to matter significantly more than industry factors"; "Industry factors may have a large impact on the performance of the ‘also-ran’ firms, while for the industry leaders and losers it is firm factors that dominate"; "the transient component of industry effects measures the sensitivity of profitability to the impact of business cycles on the industry"Hawawini, Subramanian and Verdin (2003)
- A A verified against the printed page of the primary sourceB primary source, text layer onlyC authoritative secondaryD reported Limits the authors state: a statistical decomposition that does not identify sources; SIC may miss strategically relevant industries; large unexplained share; the industry-firm interaction cannot be estimated because firm is nested in industry; corporate and business effects cannot be separated, which may understate industry; 1,000 listed and possibly large firms (pp. 13 to 15): "this study performs a statistical decomposition and does not investigate the exact sources of these effects"; "the SIC system in some cases does not identify strategically relevant industries"; "a significant proportion of the performance variations observed is due to as yet completely unexplained factors"; "with the current model we cannot estimate this interaction because the firm factor is nested within the industry"; "the data do not allow us to distinguish between corporate- and business-level effects and hence may underestimate industry effects"; "a data set containing only 1000 listed firms that may potentially be large, and hence we should be cautious when seeking to generalize the results"Hawawini, Subramanian and Verdin (2003)
- A A verified against the printed page of the primary sourceB primary source, text layer onlyC authoritative secondaryD reported Pooled, Table 2: firm 12.71 percent, industry 3.35, year 0.48, industry-year 0.34, residual 83.12 (the printed total 156.82 is the small-firm total; the shares are of 211.14) (p. 29): "These show that the firm effect has the greatest explanatory power, while the industry effect is less important"; "a significant part of the variance of ROA is not explained by the model"Fernández et al. (2019)
- A A verified against the printed page of the primary sourceB primary source, text layer onlyC authoritative secondaryD reported By size, variance components analysis, Table 3: large firm 17.99, stable industry 0.00, industry-year 15.24; medium firm 5.07, industry 18.71, industry-year 20.29; small firm 13.62, industry 0.93, industry-year 0.53 percent; industry about 39 percent against 5.07 for medium firms (pp. 29, 30, 32): "In the case of large firms, the transient industry effect explains almost as much as the firm effect, but the stable component of the industry effect has no significance whatever"; "In the case of medium-sized firms, the importance of the industry effect is eight times that of the firm effect, and is almost equally split between its two components, stable and transient"; "approximately 39% of variance explained by the industry and industry-year effects and 5.07% by the firm effect"Fernández et al. (2019)
- A A verified against the printed page of the primary sourceB primary source, text layer onlyC authoritative secondaryD reported Second method (HLM, time fixed, no industry-year term), Tables 3 and 4: medium firm 5.61 against industry 5.17 percent; the authors call the medium-size industry advantage not overwhelming and the difference not significant (pp. 29, 30): "although the greater importance of the industry effect in the case of medium-sized firms is not overwhelming"; "although the difference between effects is not significant"Fernández et al. (2019)
- A A verified against the printed page of the primary sourceB primary source, text layer onlyC authoritative secondaryD reported Limits the authors state: no business-unit data, so a single firm effect that may understate industry; Spain only; replication in other countries proposed (pp. 28, 33): "We therefore measured a single effect at the level of the firm, which might have given rise to the industry effect being underestimated"; "it does not contain data from other countries, which prevents further generalization of the results obtained"; "very interesting to replicate the analysis in a group of countries"Fernández et al. (2019)
- B A verified against the printed page of the primary sourceB primary source, text layer onlyC authoritative secondaryD reported Figure 5 evidence map: the questions and their grouping, and the three limits (none of these studies tests a force; the firm effect is not strategy; old and narrow evidence)Author evidence map
From the essay
Go-to-market strategy
Porter's five forces: industry explains less than the firm does
Porter's five forces map pressures on industry profits. In three studies, firms differ more than industries do; in the middle of the pack the gap closes.
Read the essayThis exhibit belongs to an essay: the numbers live here, the argument lives there.
Cite or embed
Related exhibits
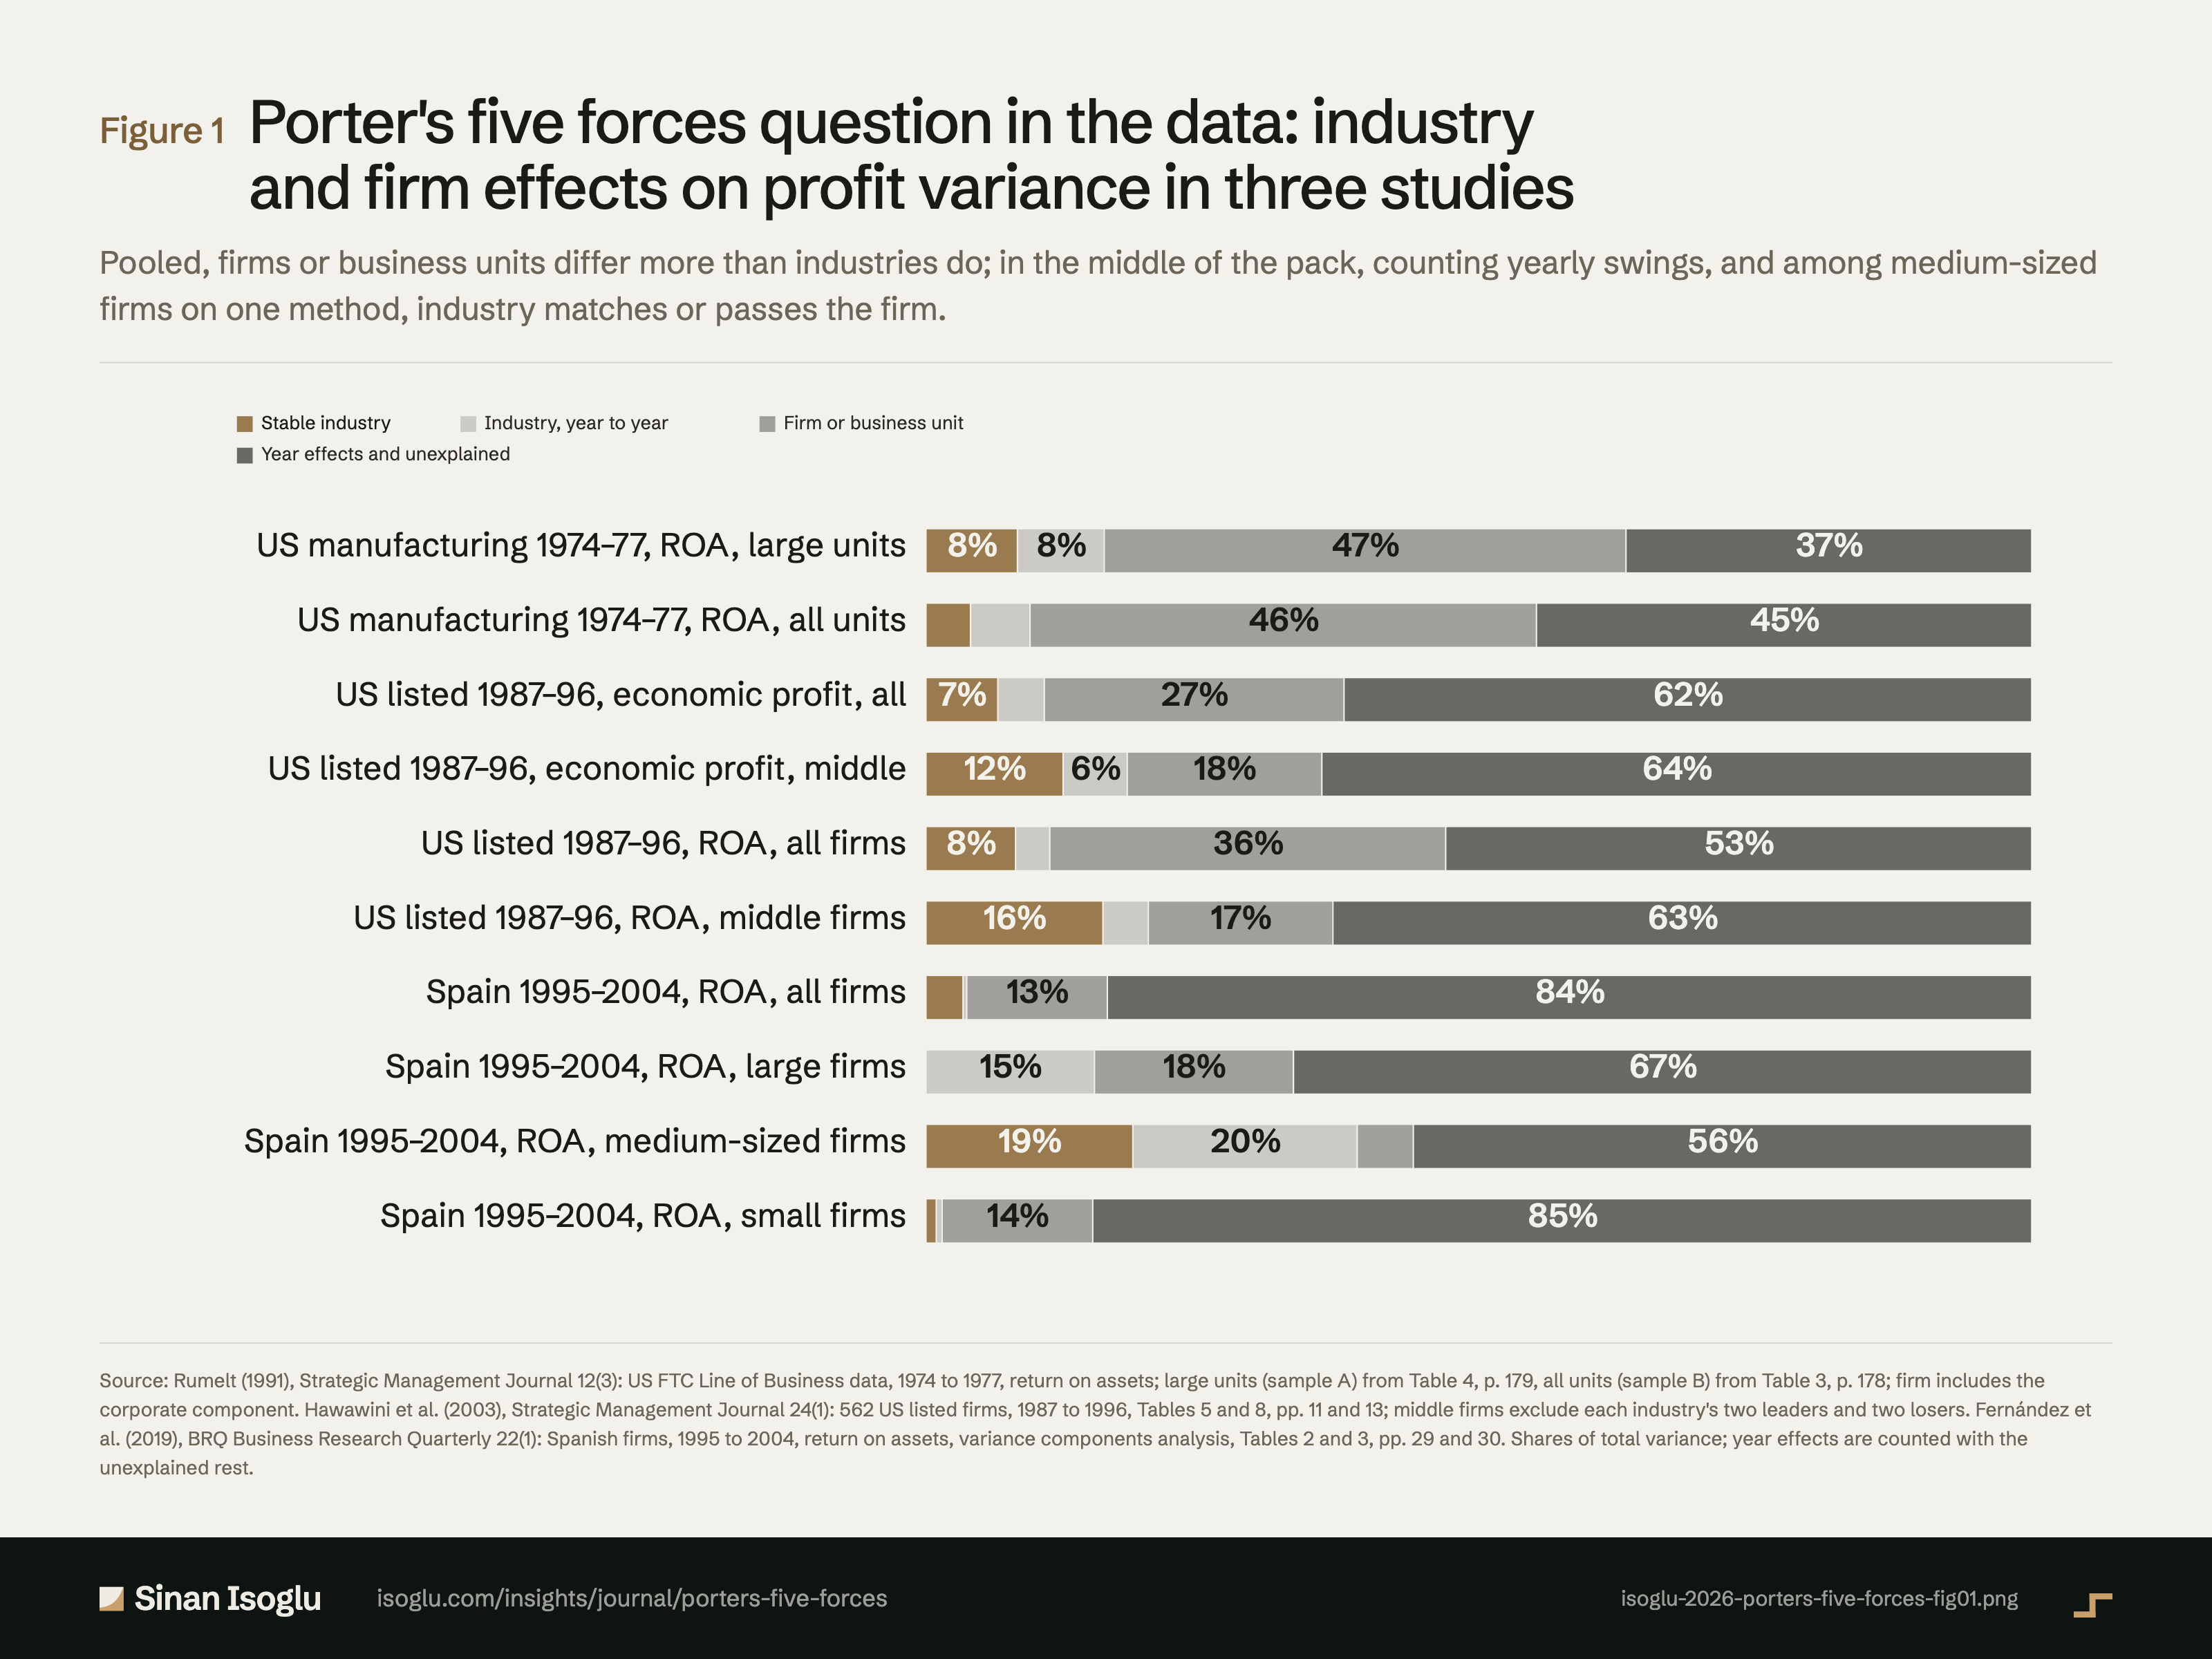
Figure 1Figure
Porter's five forces question in the data: industry and firm effects on profit variance in three studies
Porter's five forces: industry explains less than the firm does
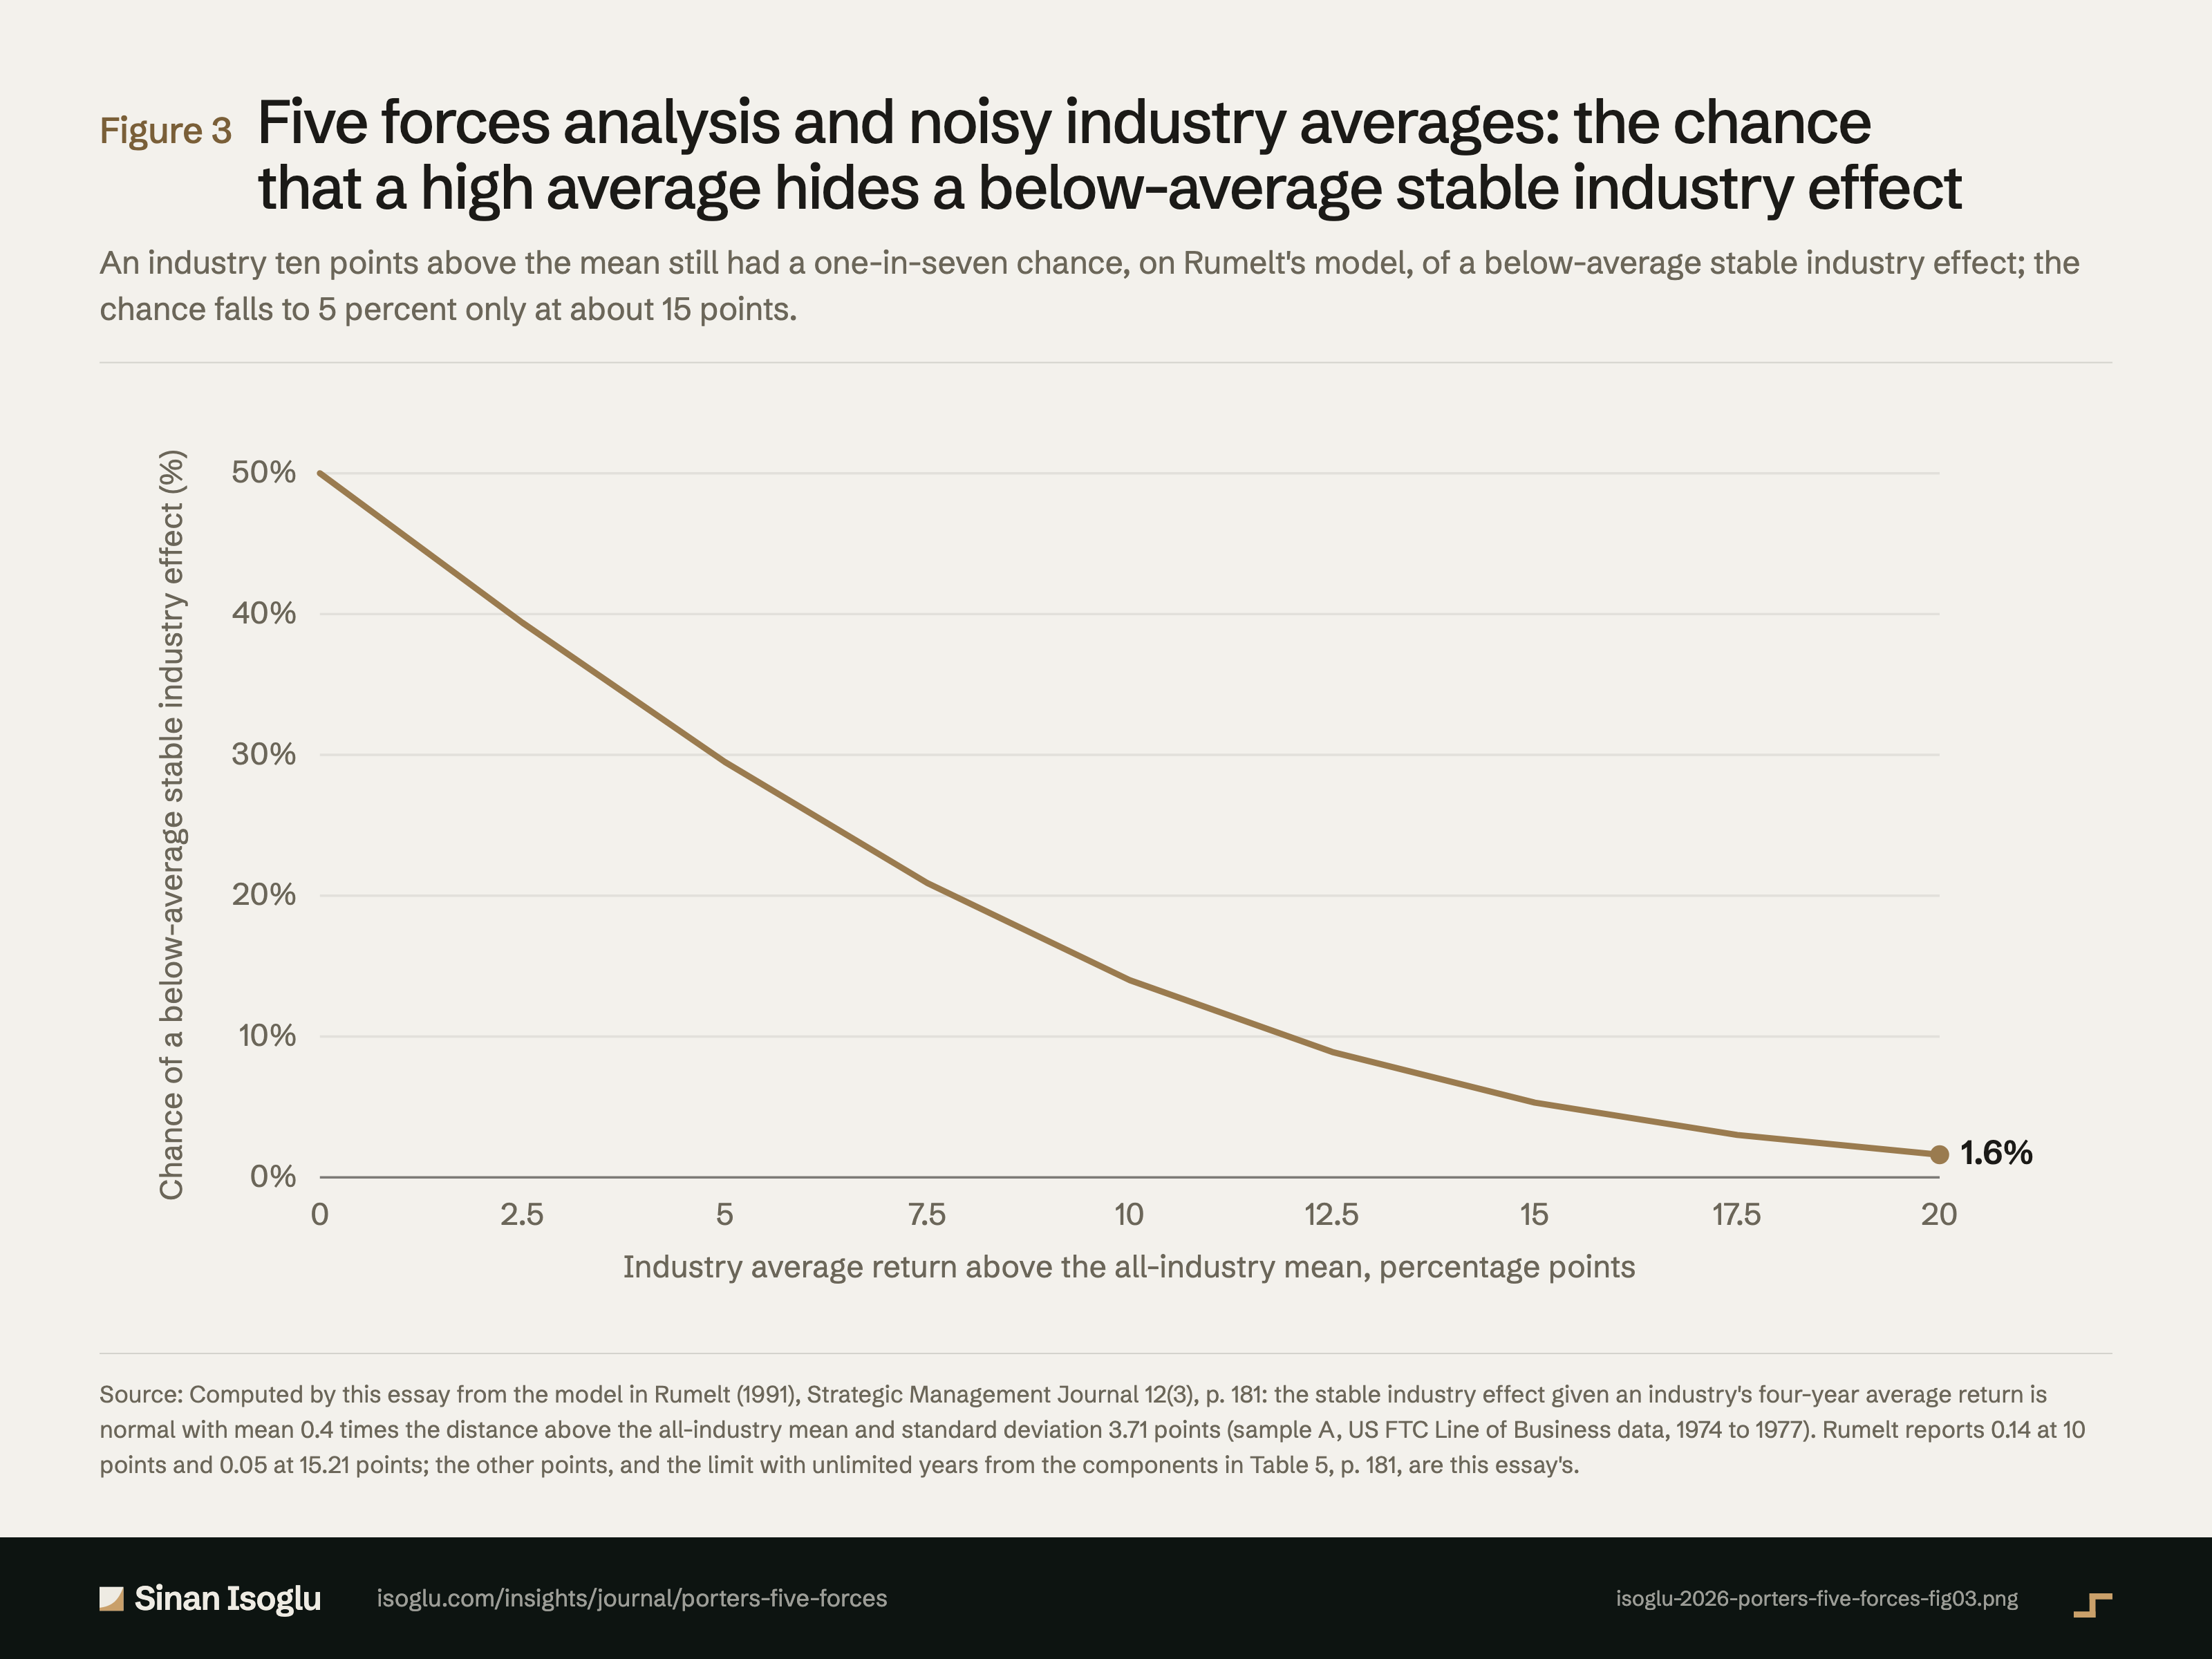
Figure 3Figure
Five forces analysis and noisy industry averages: the chance that a high average hides a below-average stable industry effect
Porter's five forces: industry explains less than the firm does
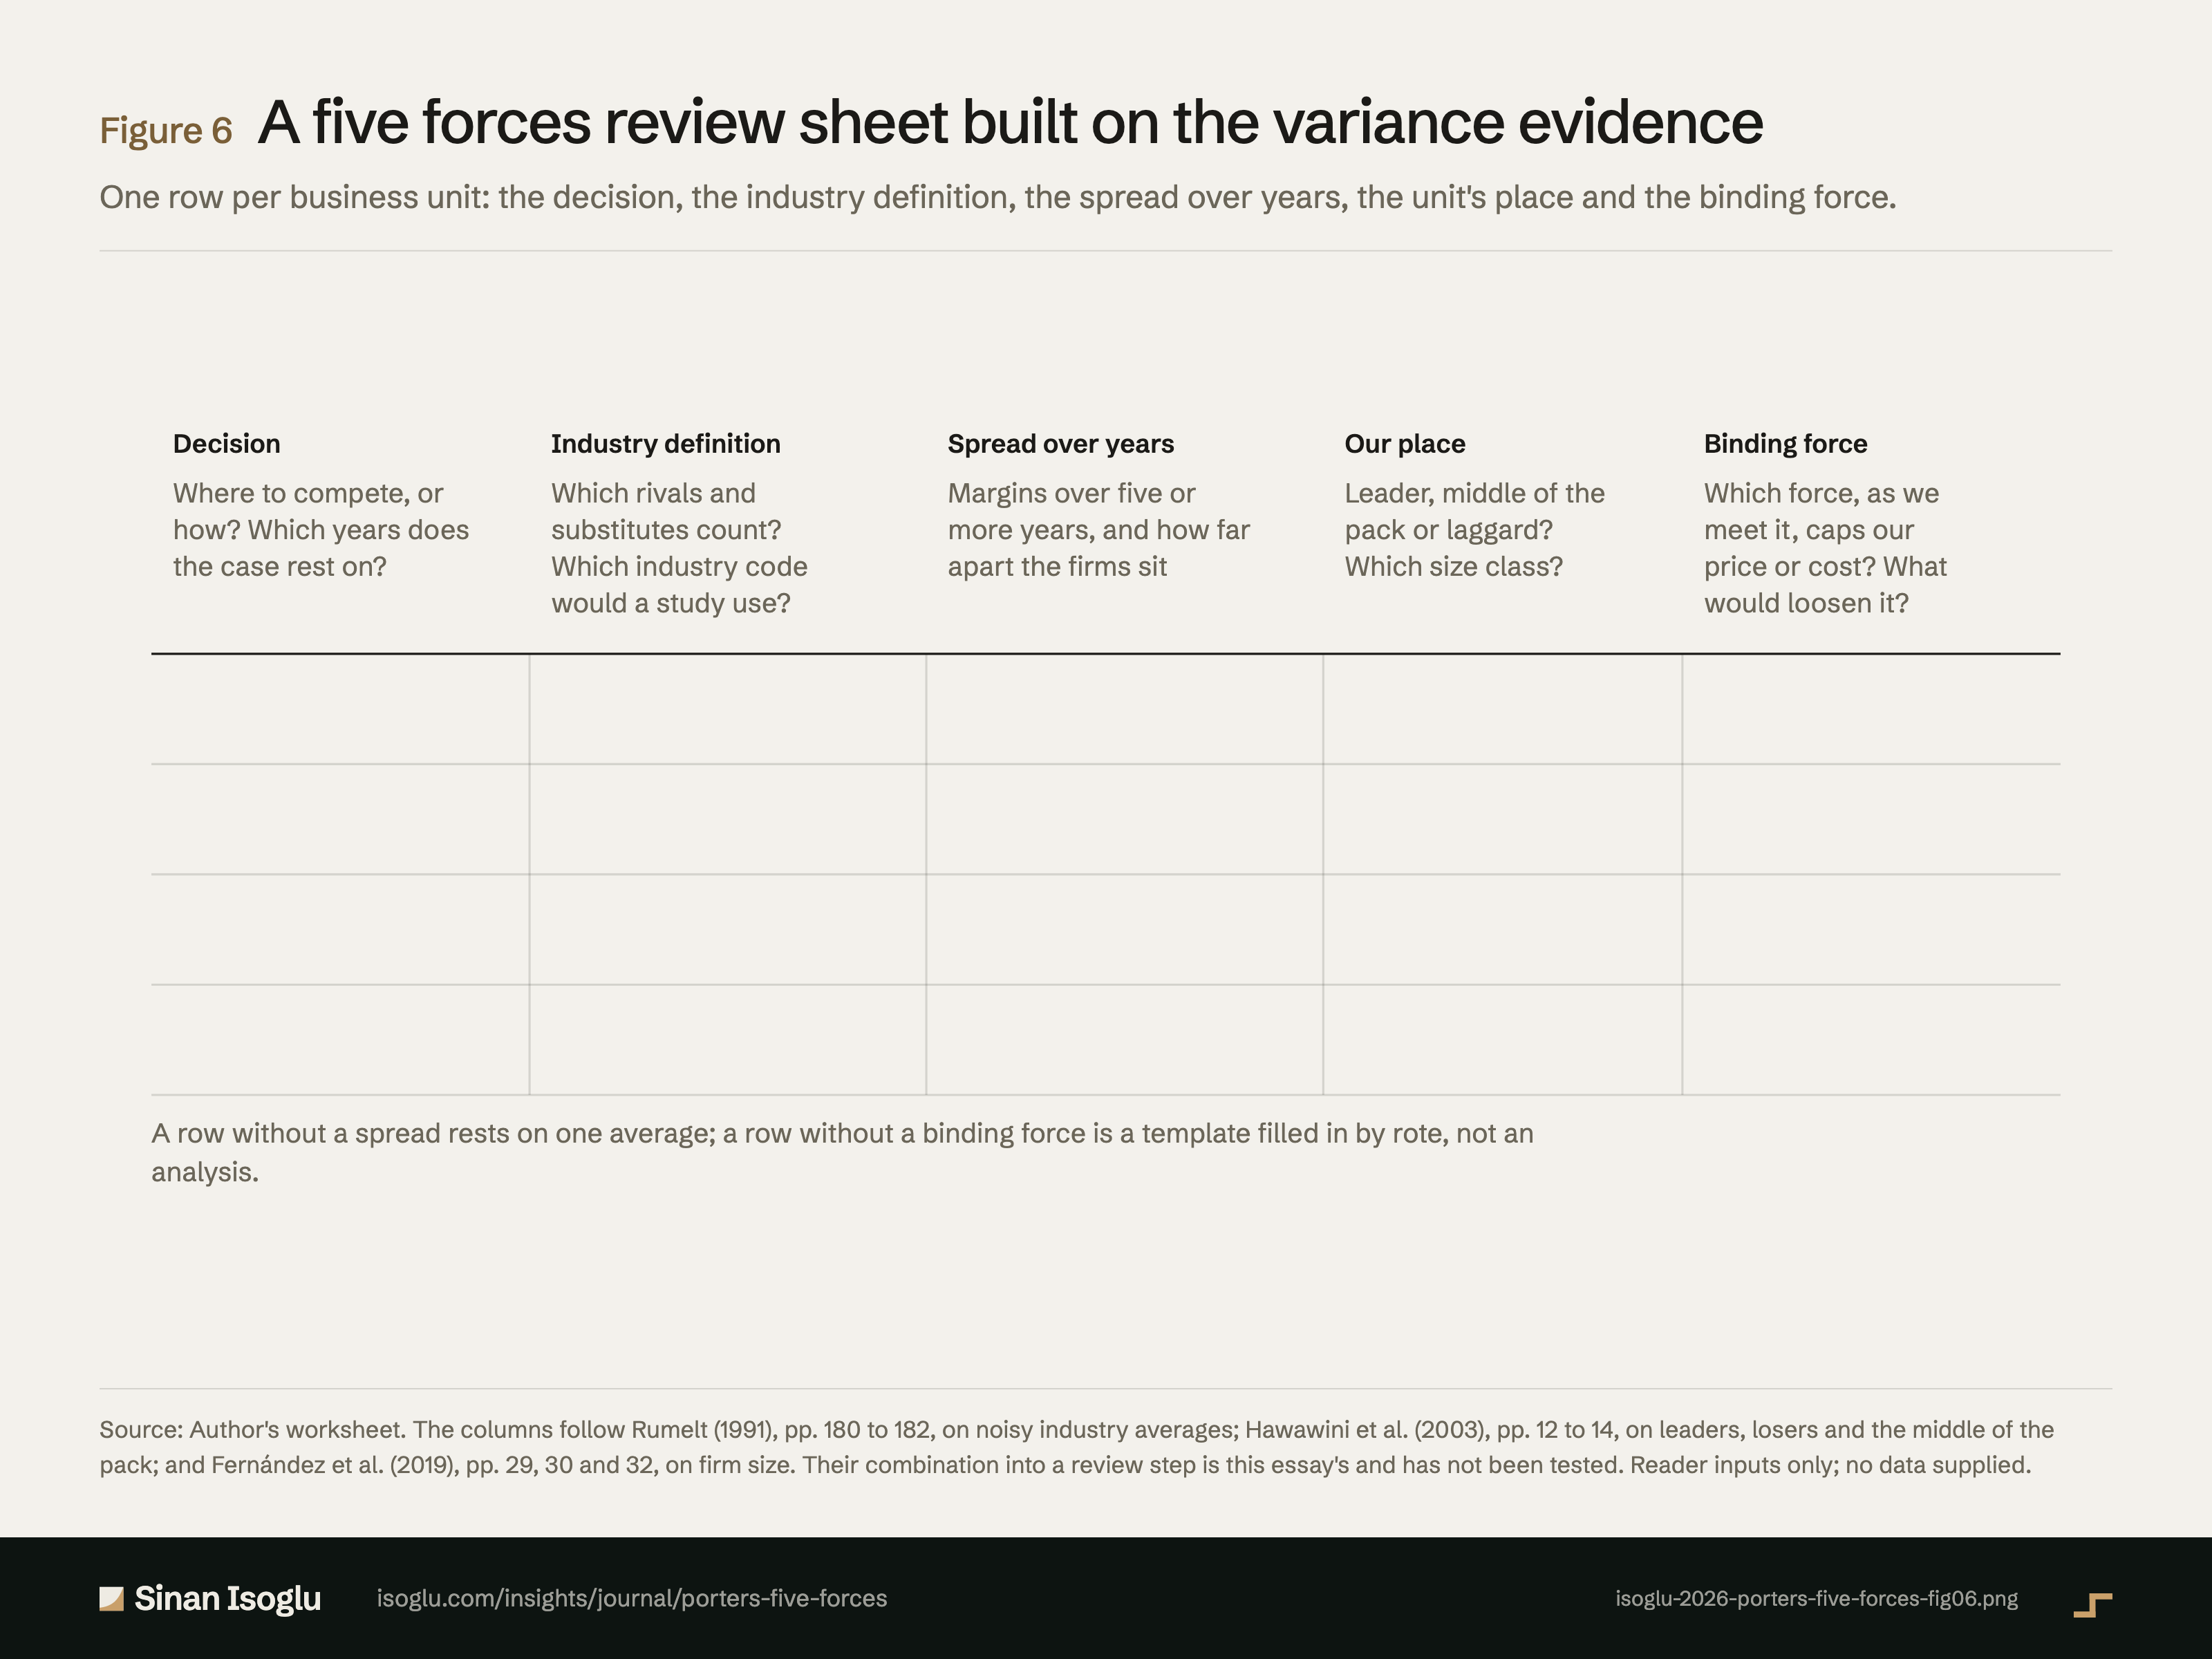
Figure 6Figure
A five forces review sheet built on the variance evidence
Porter's five forces: industry explains less than the firm does
Contact
Bring the question you're working on.
Research, a guest lecture, or a commercial question.