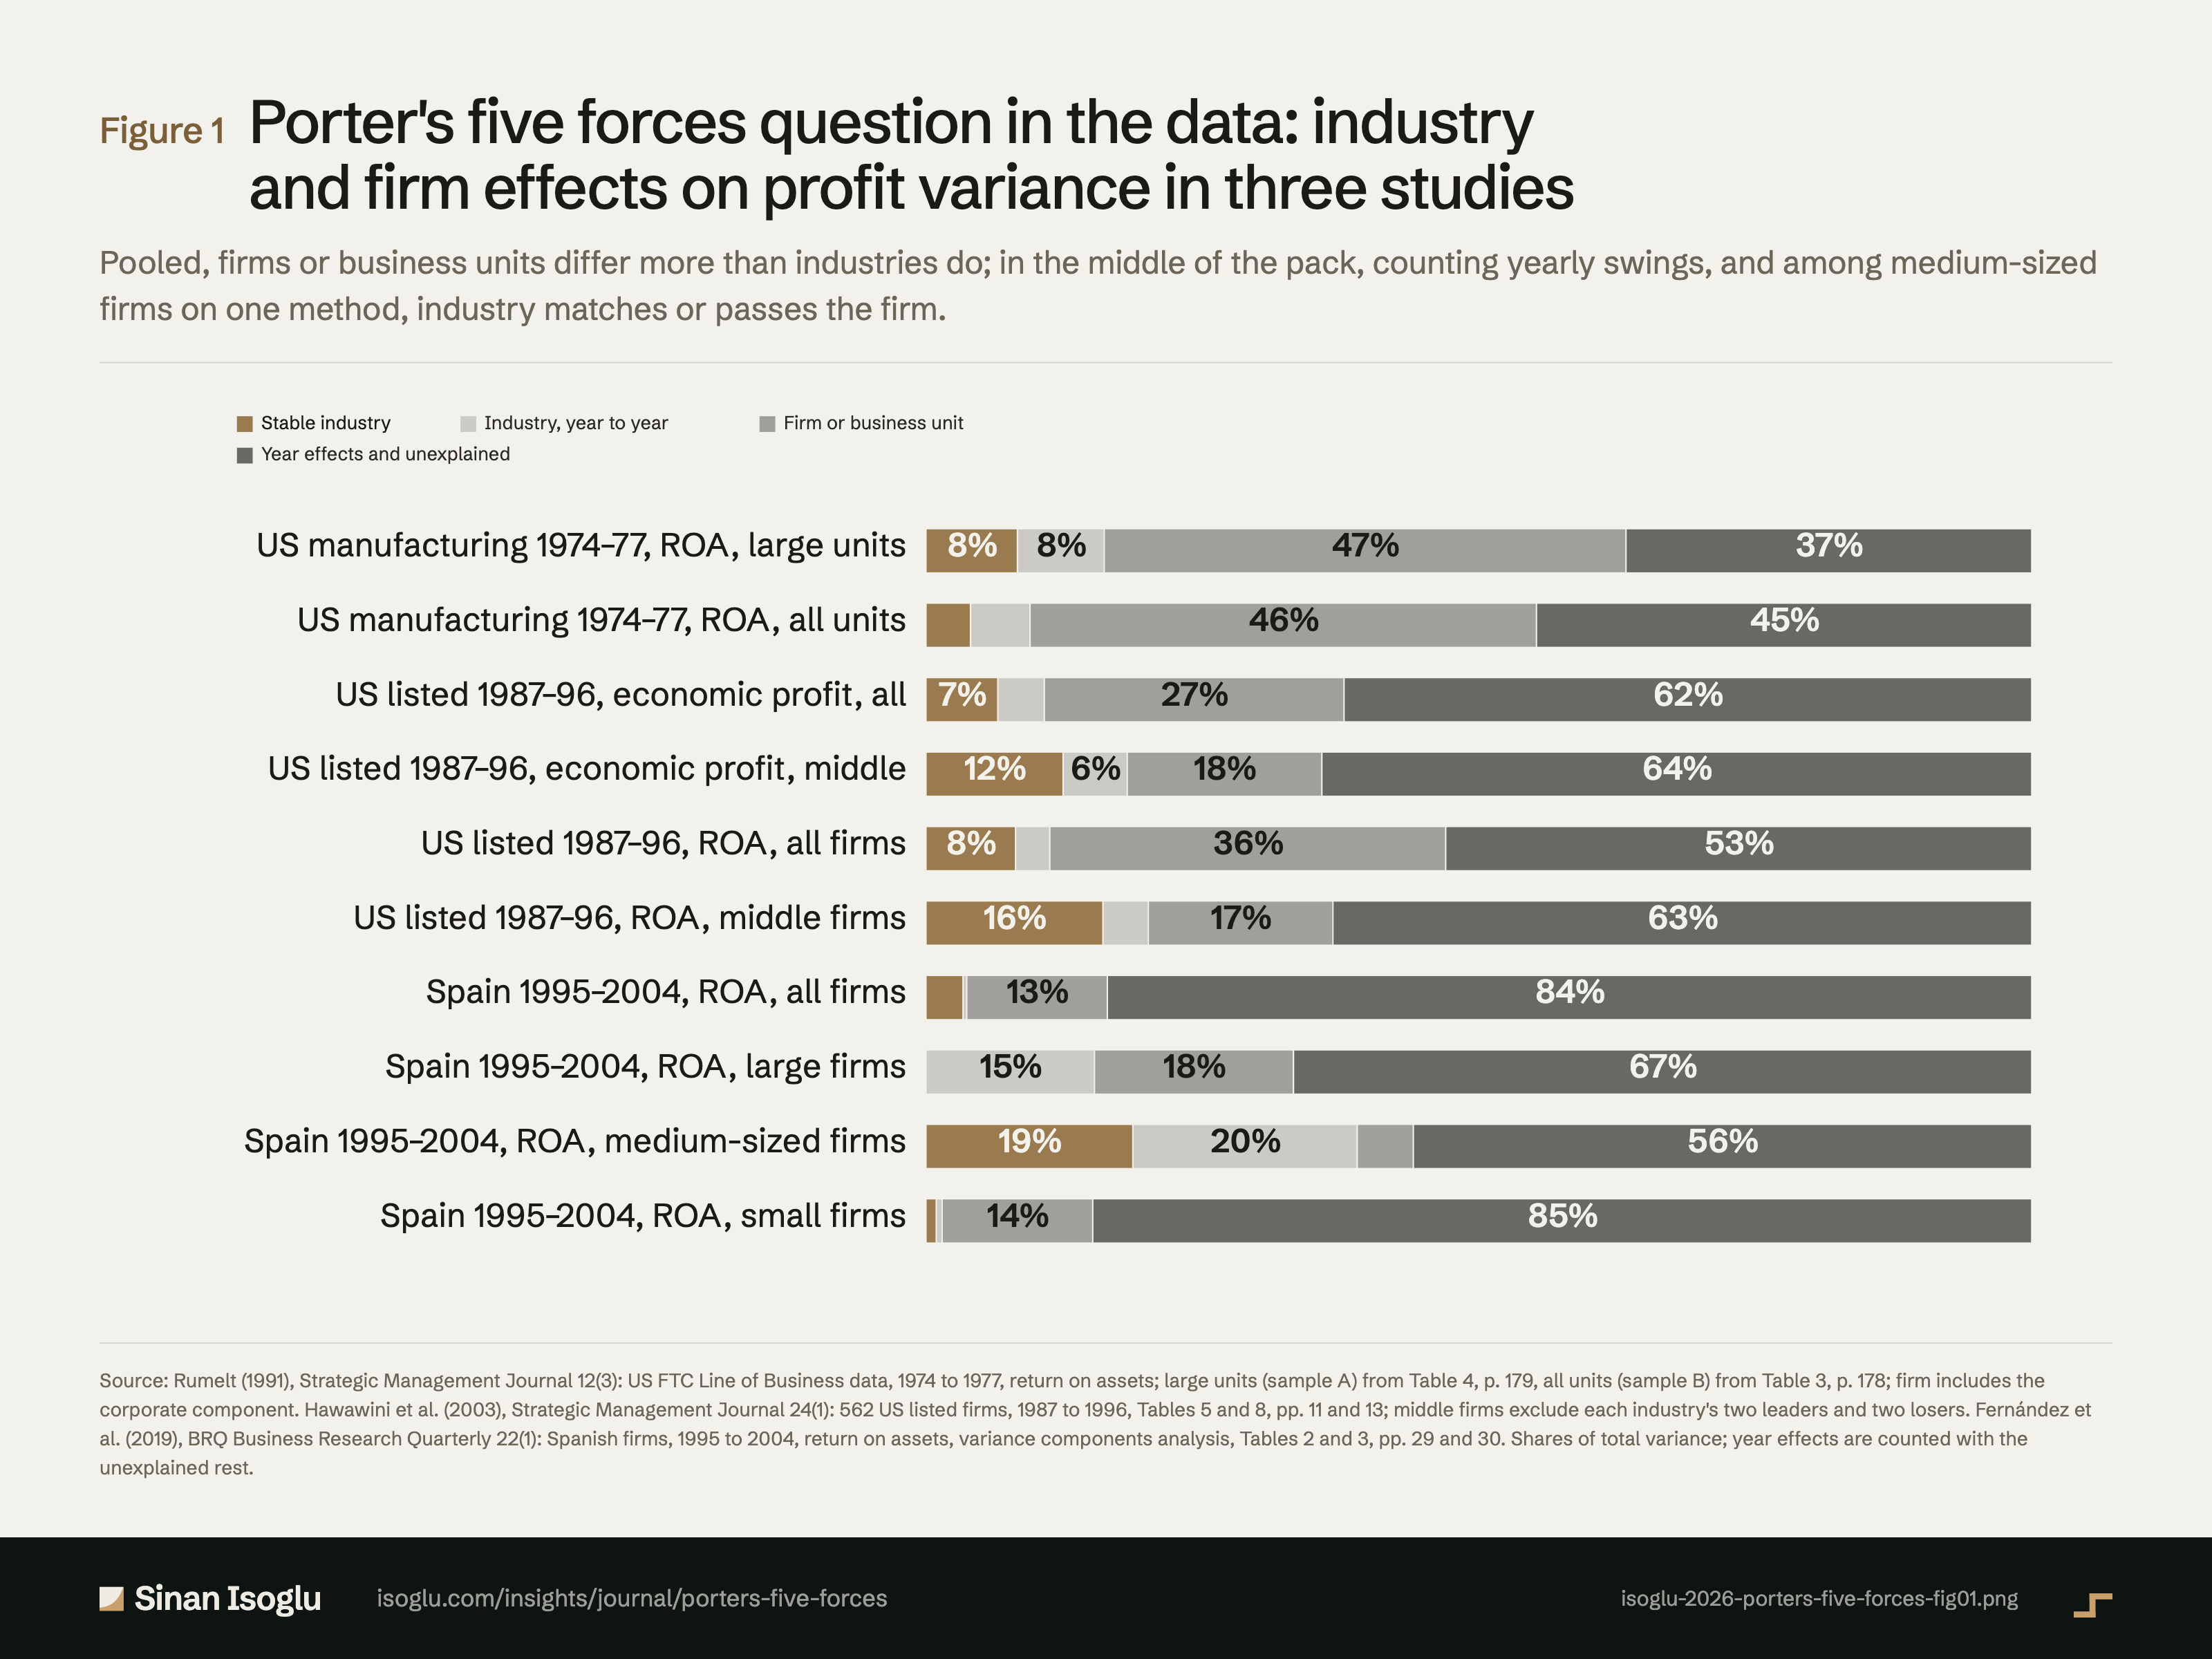
Figure 1From “Porter's five forces: industry explains less than the firm does”
Porter's five forces question in the data: industry and firm effects on profit variance in three studies
Pooled, firms or business units differ more than industries do; in the middle of the pack, counting yearly swings, and among medium-sized firms on one method, industry matches or passes the firm.
Figure 1Porter's five forces question in the data: industry and firm effects on profit variance in three studies
Source: Rumelt (1991), Strategic Management Journal 12(3): US FTC Line of Business data, 1974 to 1977, return on assets; large units (sample A) from Table 4, p. 179, all units (sample B) from Table 3, p. 178; firm includes the corporate component. Hawawini et al. (2003), Strategic Management Journal 24(1): 562 US listed firms, 1987 to 1996, Tables 5 and 8, pp. 11 and 13; middle firms exclude each industry's two leaders and two losers. Fernández et al. (2019), BRQ Business Research Quarterly 22(1): Spanish firms, 1995 to 2004, return on assets, variance components analysis, Tables 2 and 3, pp. 29 and 30. Shares of total variance; year effects are counted with the unexplained rest.
Source and evidence
Each line names a claim related to this exhibit, its source, and how it was checked.
- A A verified against the printed page of the primary sourceB primary source, text layer onlyC authoritative secondaryD reported Data and measure: US FTC Line of Business data on the domestic operations of large corporations in 261 four-digit manufacturing industries, 1974 to 1977; sample A 1,774 business units of 457 corporations in 242 industries (6,932 observations), sample B 2,810 units adding small ones (10,866 observations); return on assets as profit before interest and taxes over total assets (pp. 170, 171): "The FTC collected data on the domestic operations of large corporations in each of 261 4-digit FTC manufacturing industry categories"; "Sample A then contained 6932 observations provided by 457 corporations on 1774 business-units operating in a total of 242 4-digit FTC industries"; "Sample B then contained 10,866 observations provided by 463 corporations on 2810 business-units operating in a total of 242 4-digit FTC industries"; "The rate of return was taken to be the ratio of profit before interest and taxes to total assets, expressed as a percentage"Rumelt (1991)
- A A verified against the printed page of the primary sourceB primary source, text layer onlyC authoritative secondaryD reported Partition of business-unit returns, restricted model: sample A (B) 8 (4) percent stable industry, 1 (2) corporate, 46 (44) business unit, 8 (5) industry-year, 37 (45) residual; Table 4 for sample A: 8.28, 7.84, 0.80, 46.38, 36.70 (sum 100.00); Table 3 for sample B: 4.03, 5.38, 1.64, 44.17, 44.79; business-unit variance six (eleven) times the industry variance; Table 3 prints 36.87 for the sample A error, Table 4 36.70, which sums (pp. 178, 179): "8 (4) percent industry effects, 1 (2) percent corporate effects, 46 (44) percent business-unit effects, 8 (5) percent industry-year effects, and 37 (45) percent residual error"; "business-units differ from one another within industries much more than industries differ from one another"; "six times larger in sample A and eleven times larger in sample B"Rumelt (1991)
- A A verified against the printed page of the primary sourceB primary source, text layer onlyC authoritative secondaryD reported Sample: Stern Stewart data set of 1,000 US listed firms ranked by market value added; 1987 to 1996; three-digit SIC; 562 firms in 55 industries, 5,620 observations; survivors only; may be dominated by large firms (pp. 6, 7): "The U.S. data set covers 1000 listed firms for periods of up to 21 years"; "The sample set covers the 10-year period from 1987 to 1996"; "The firms are classified into industries based on the SIC system"; "The final sample contains 5620 observations for 562 firms across 55 industry classifications"; "The data set only contains firms that survived during the time period"Hawawini, Subramanian and Verdin (2003)
- A A verified against the printed page of the primary sourceB primary source, text layer onlyC authoritative secondaryD reported Full sample, Table 5: firm effects 27.1, 32.5 and 35.8 percent (EP/CE, TMV/CE, ROA); stable industry 6.5, 11.4 and 8.1; industry-year 4.2, 2.9 and 3.1; total industry 10.7, 14.3 and 11.2; stable firm effects more than four times stable industry effects for EP/CE and ROA (p. 11): "Total industry effects for EP/CE, TMV/CE and ROA are 10.7 percent, 14.3 percent, and 11.2 percent, respectively"; "the corresponding figures for stable firm effects are 27.1 percent, 32.5 percent, and 35.8 percent"; "stable firm effects dominate stable industry effects by a factor of more than four"Hawawini, Subramanian and Verdin (2003)
- A A verified against the printed page of the primary sourceB primary source, text layer onlyC authoritative secondaryD reported Middle of the pack, Table 8: industry effects (stable plus transient, as the authors compare them) 18.2 against firm 17.6 percent for EP/CE, 20.1 against 16.7 for ROA, 35.2 against 17.0 for TMV/CE; on stable industry effects alone 12.4 against 17.6 (EP/CE), 16.0 against 16.7 (ROA), 30.2 against 17.0 (TMV/CE); the transient component measures sensitivity to business cycles; firm-specific assets matter more only for the few leaders and losers (pp. 1, 7, 12, 13, 14): "overall industry effects (the sum of stable and transient industry effects) explain 35.2 percent in variation compared to only 17.0 percent for firm effects"; "In the case of EP/CE it is 18.2 percent for industry effects vs. 17.6 percent for firm effects and for ROA it is 20.1 percent against 16.7 percent"; "only for a few dominant value creators (leaders) and destroyers (losers) do firm-specific assets seem to matter significantly more than industry factors"; "Industry factors may have a large impact on the performance of the ‘also-ran’ firms, while for the industry leaders and losers it is firm factors that dominate"; "the transient component of industry effects measures the sensitivity of profitability to the impact of business cycles on the industry"Hawawini, Subramanian and Verdin (2003)
- A A verified against the printed page of the primary sourceB primary source, text layer onlyC authoritative secondaryD reported Sample and measure: Spanish firms from SABI, manufacturing and services, with accounts for all of 1995 to 2004 (14,204 originally); final 7,843 after excluding micro firms, 87.58 percent small, 10.97 medium, 1.45 large; EU size classes of the 2003 Commission recommendation as the authors apply them, on employees and turnover in the last sample year, 2004 (medium: fewer than 250 employees, up to 50 million euros turnover; large: 250 or more and over 50 million); ROA; NCEA three-digit sectors; a decade of expansion with no year of GDP decline (pp. 26, 28): "The original sample comprised 14,204 Spanish firms with accounting data for the entire"; "The final sample consisted of 7843 firms, of which 87.58% were small, 10.97% medium, and just 1.45% large"; "medium-sized firms, fewer than 250 employees and up to 50 million euros turnover"; "we follow the European Commission recommendation of 6 May 2003"; "In this paper the analysis was carried out using ROA"; "covering an expansive phase of the economic cycle"; "In this work we use a broad sample of Spanish firms, both manufacturing and services"; "The assignment of each firm to a size category was made taking into account the value of the employment and turnover variables of the last year of the sample period"Fernández et al. (2019)
- A A verified against the printed page of the primary sourceB primary source, text layer onlyC authoritative secondaryD reported Pooled, Table 2: firm 12.71 percent, industry 3.35, year 0.48, industry-year 0.34, residual 83.12 (the printed total 156.82 is the small-firm total; the shares are of 211.14) (p. 29): "These show that the firm effect has the greatest explanatory power, while the industry effect is less important"; "a significant part of the variance of ROA is not explained by the model"Fernández et al. (2019)
- A A verified against the printed page of the primary sourceB primary source, text layer onlyC authoritative secondaryD reported By size, variance components analysis, Table 3: large firm 17.99, stable industry 0.00, industry-year 15.24; medium firm 5.07, industry 18.71, industry-year 20.29; small firm 13.62, industry 0.93, industry-year 0.53 percent; industry about 39 percent against 5.07 for medium firms (pp. 29, 30, 32): "In the case of large firms, the transient industry effect explains almost as much as the firm effect, but the stable component of the industry effect has no significance whatever"; "In the case of medium-sized firms, the importance of the industry effect is eight times that of the firm effect, and is almost equally split between its two components, stable and transient"; "approximately 39% of variance explained by the industry and industry-year effects and 5.07% by the firm effect"Fernández et al. (2019)
- B A verified against the printed page of the primary sourceB primary source, text layer onlyC authoritative secondaryD reported First-screen synthesis across the three studies, one comparator per claim (G5 F1, F2): pooled stable industry share on profitability measures 3.35 (Fernández, all firms, ROA) to 8.28 percent (Rumelt A, ROA), so about 3 to 8, and 11.4 on HSV’s market-value measure (TMV/CE); firm or business-unit share 12.71 (Fernández) to 47.18 percent (Rumelt A, business unit 46.38 plus corporate 0.80), so about 13 to 47; middle of the pack: industry matches the firm only with yearly swings counted; medium-sized Spanish firms: industry exceeds the firm on the variance components method only; Figure 1 composition rows sum to 100 within roundingAuthor synthesis
From the essay
Go-to-market strategy
Porter's five forces: industry explains less than the firm does
Porter's five forces map pressures on industry profits. In three studies, firms differ more than industries do; in the middle of the pack the gap closes.
Read the essayThis exhibit belongs to an essay: the numbers live here, the argument lives there.
Cite or embed
Related exhibits
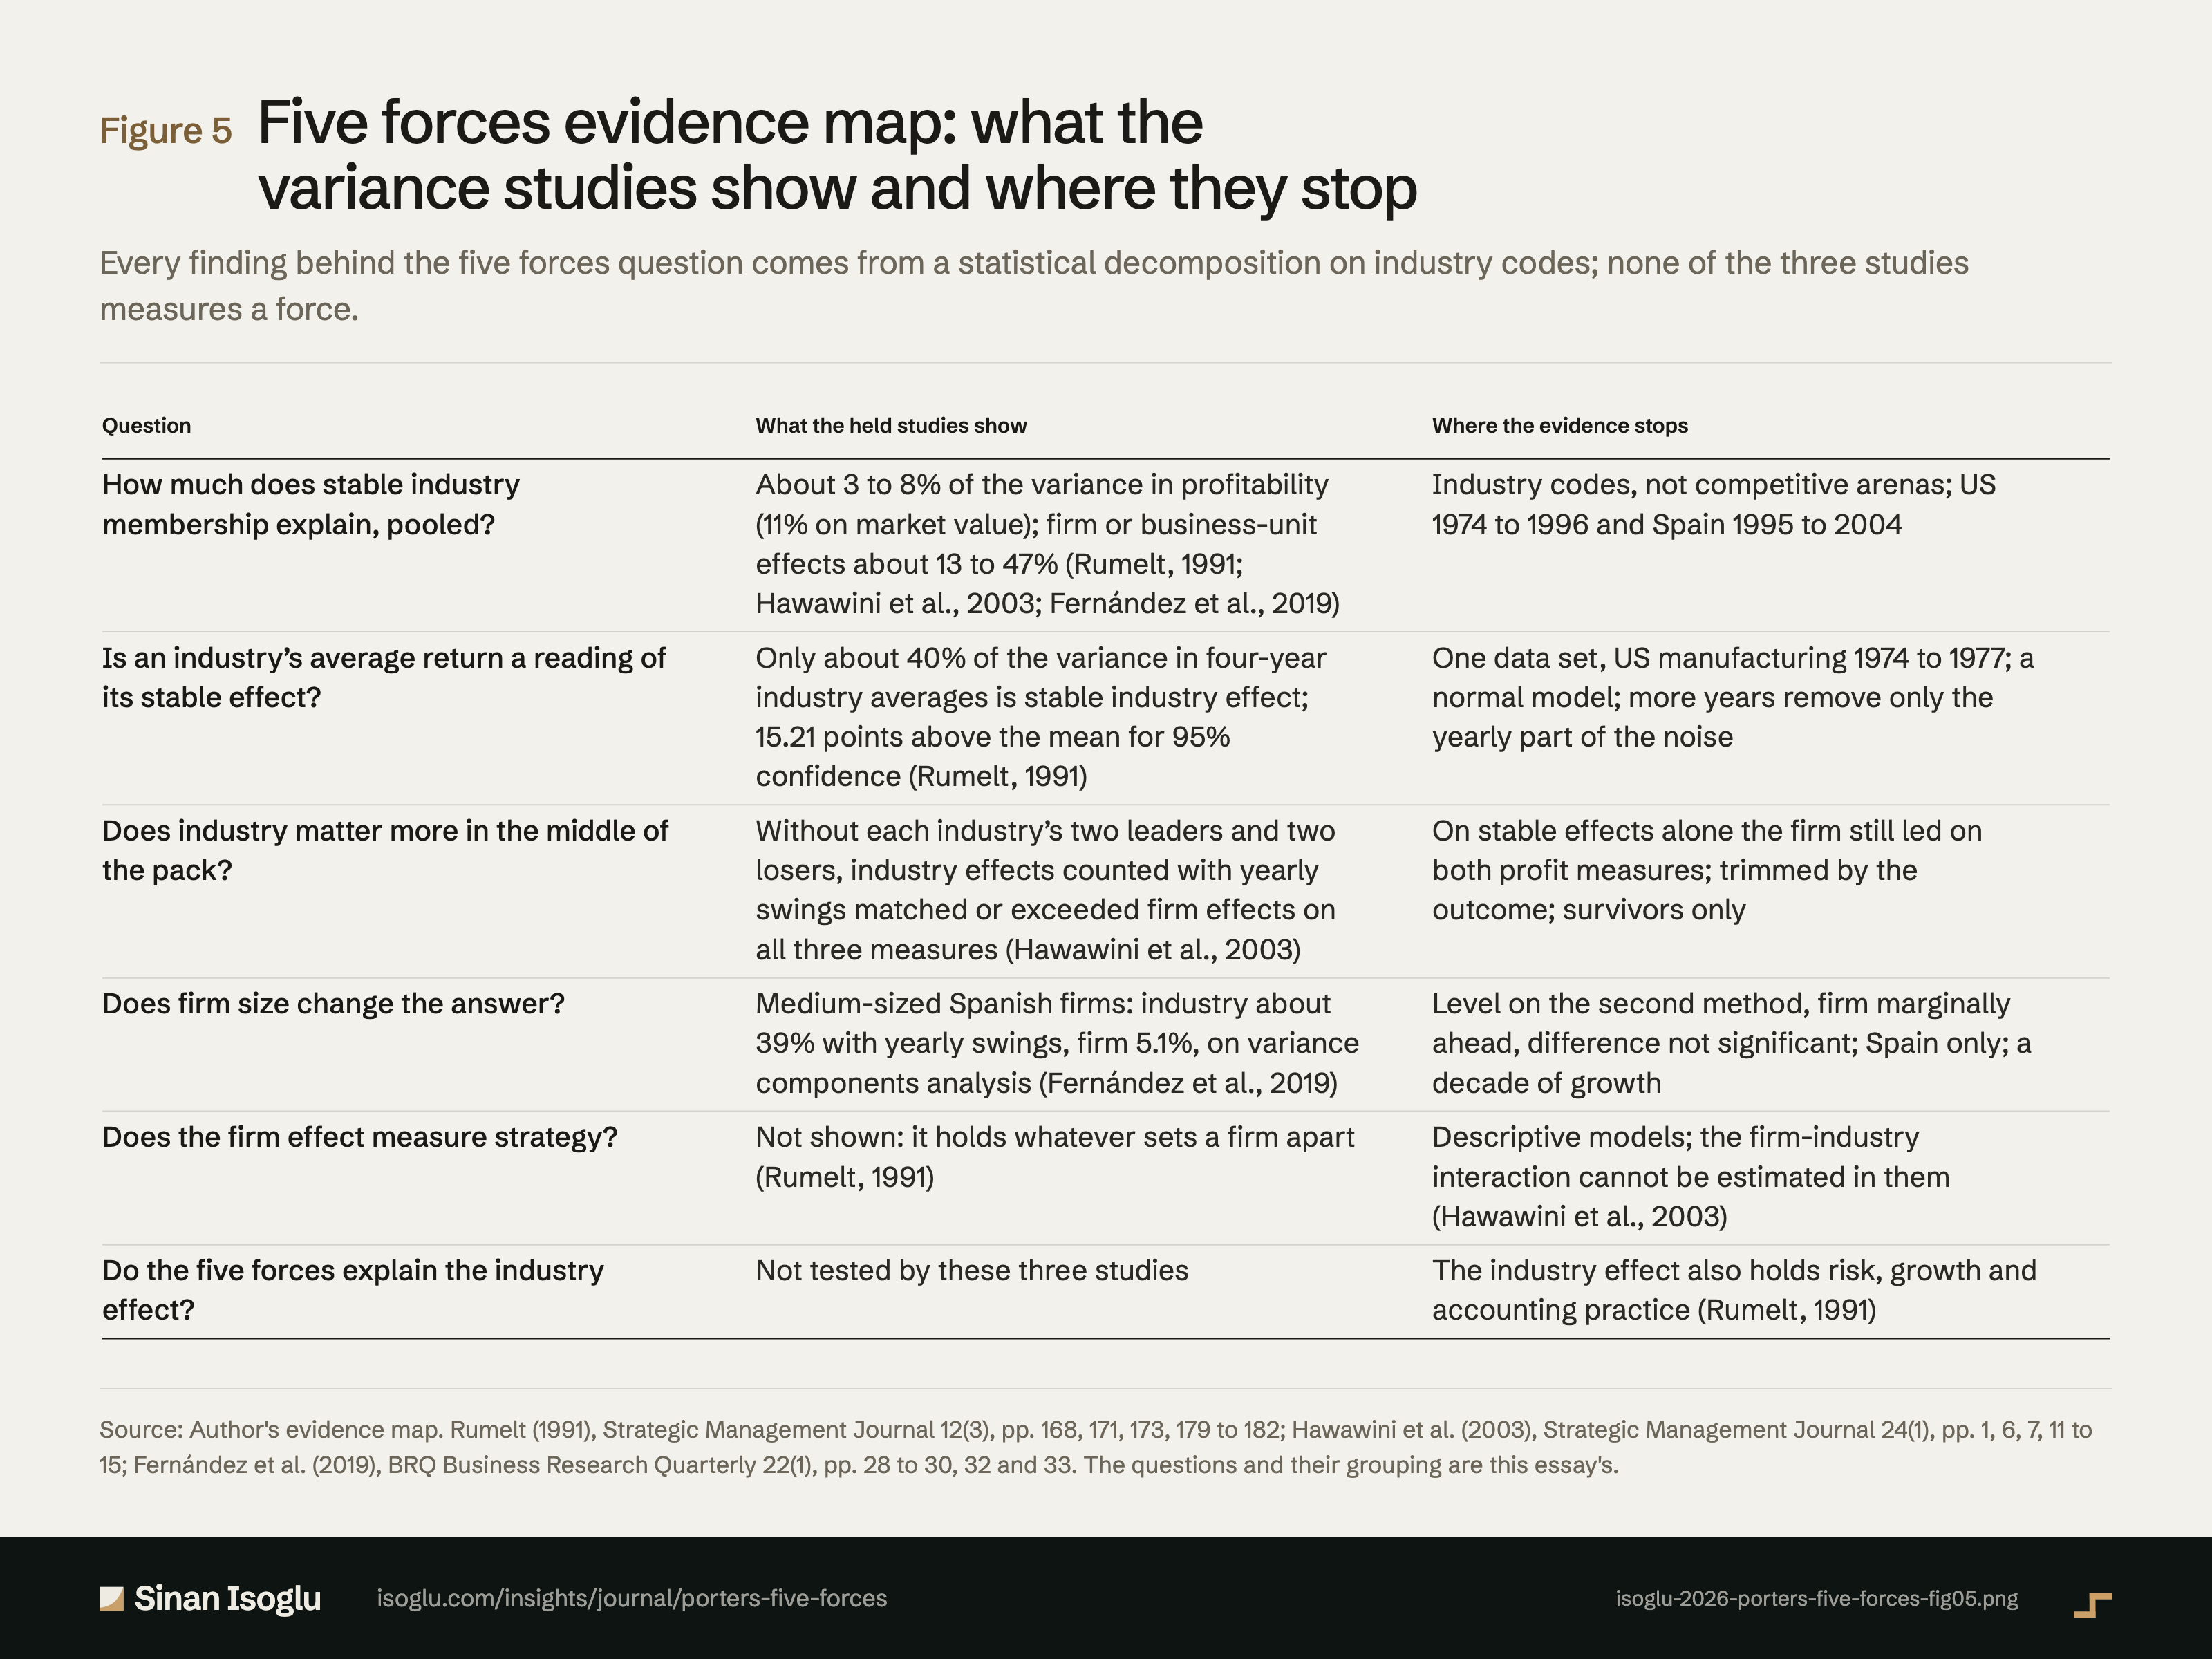
Figure 5Figure
Five forces evidence map: what the variance studies show and where they stop
Porter's five forces: industry explains less than the firm does
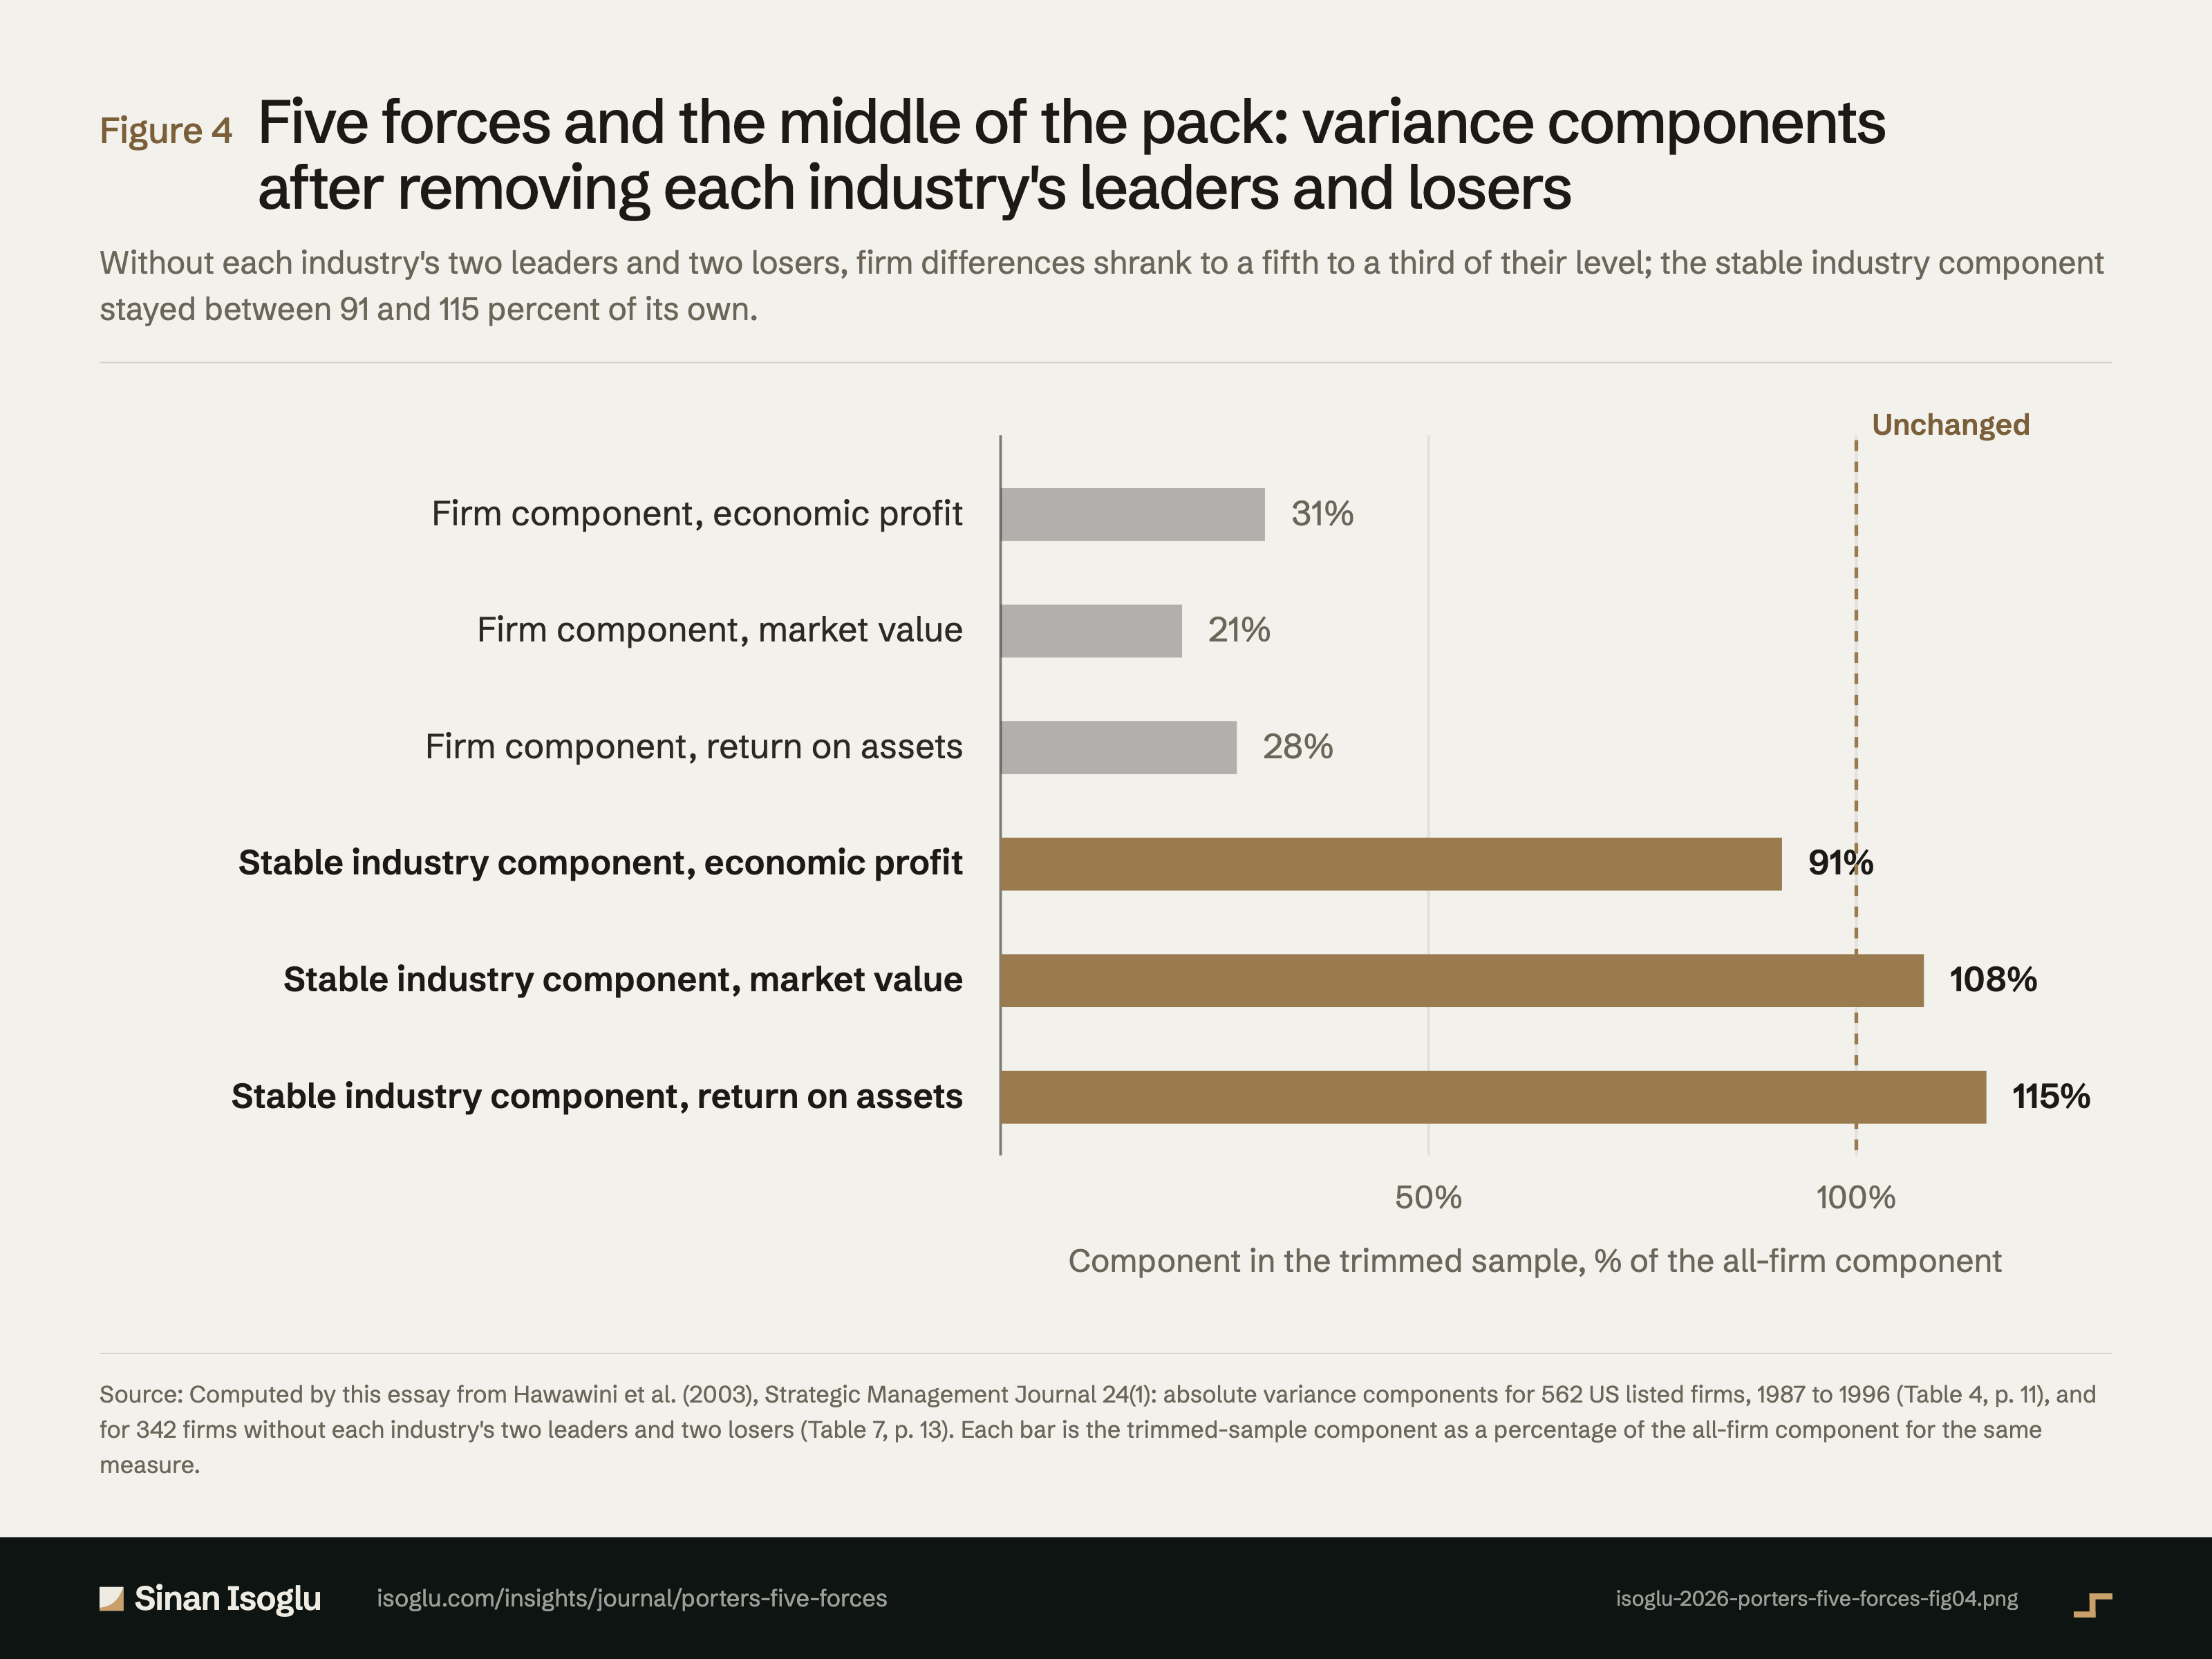
Figure 4Figure
Five forces and the middle of the pack: variance components after removing each industry's leaders and losers
Porter's five forces: industry explains less than the firm does
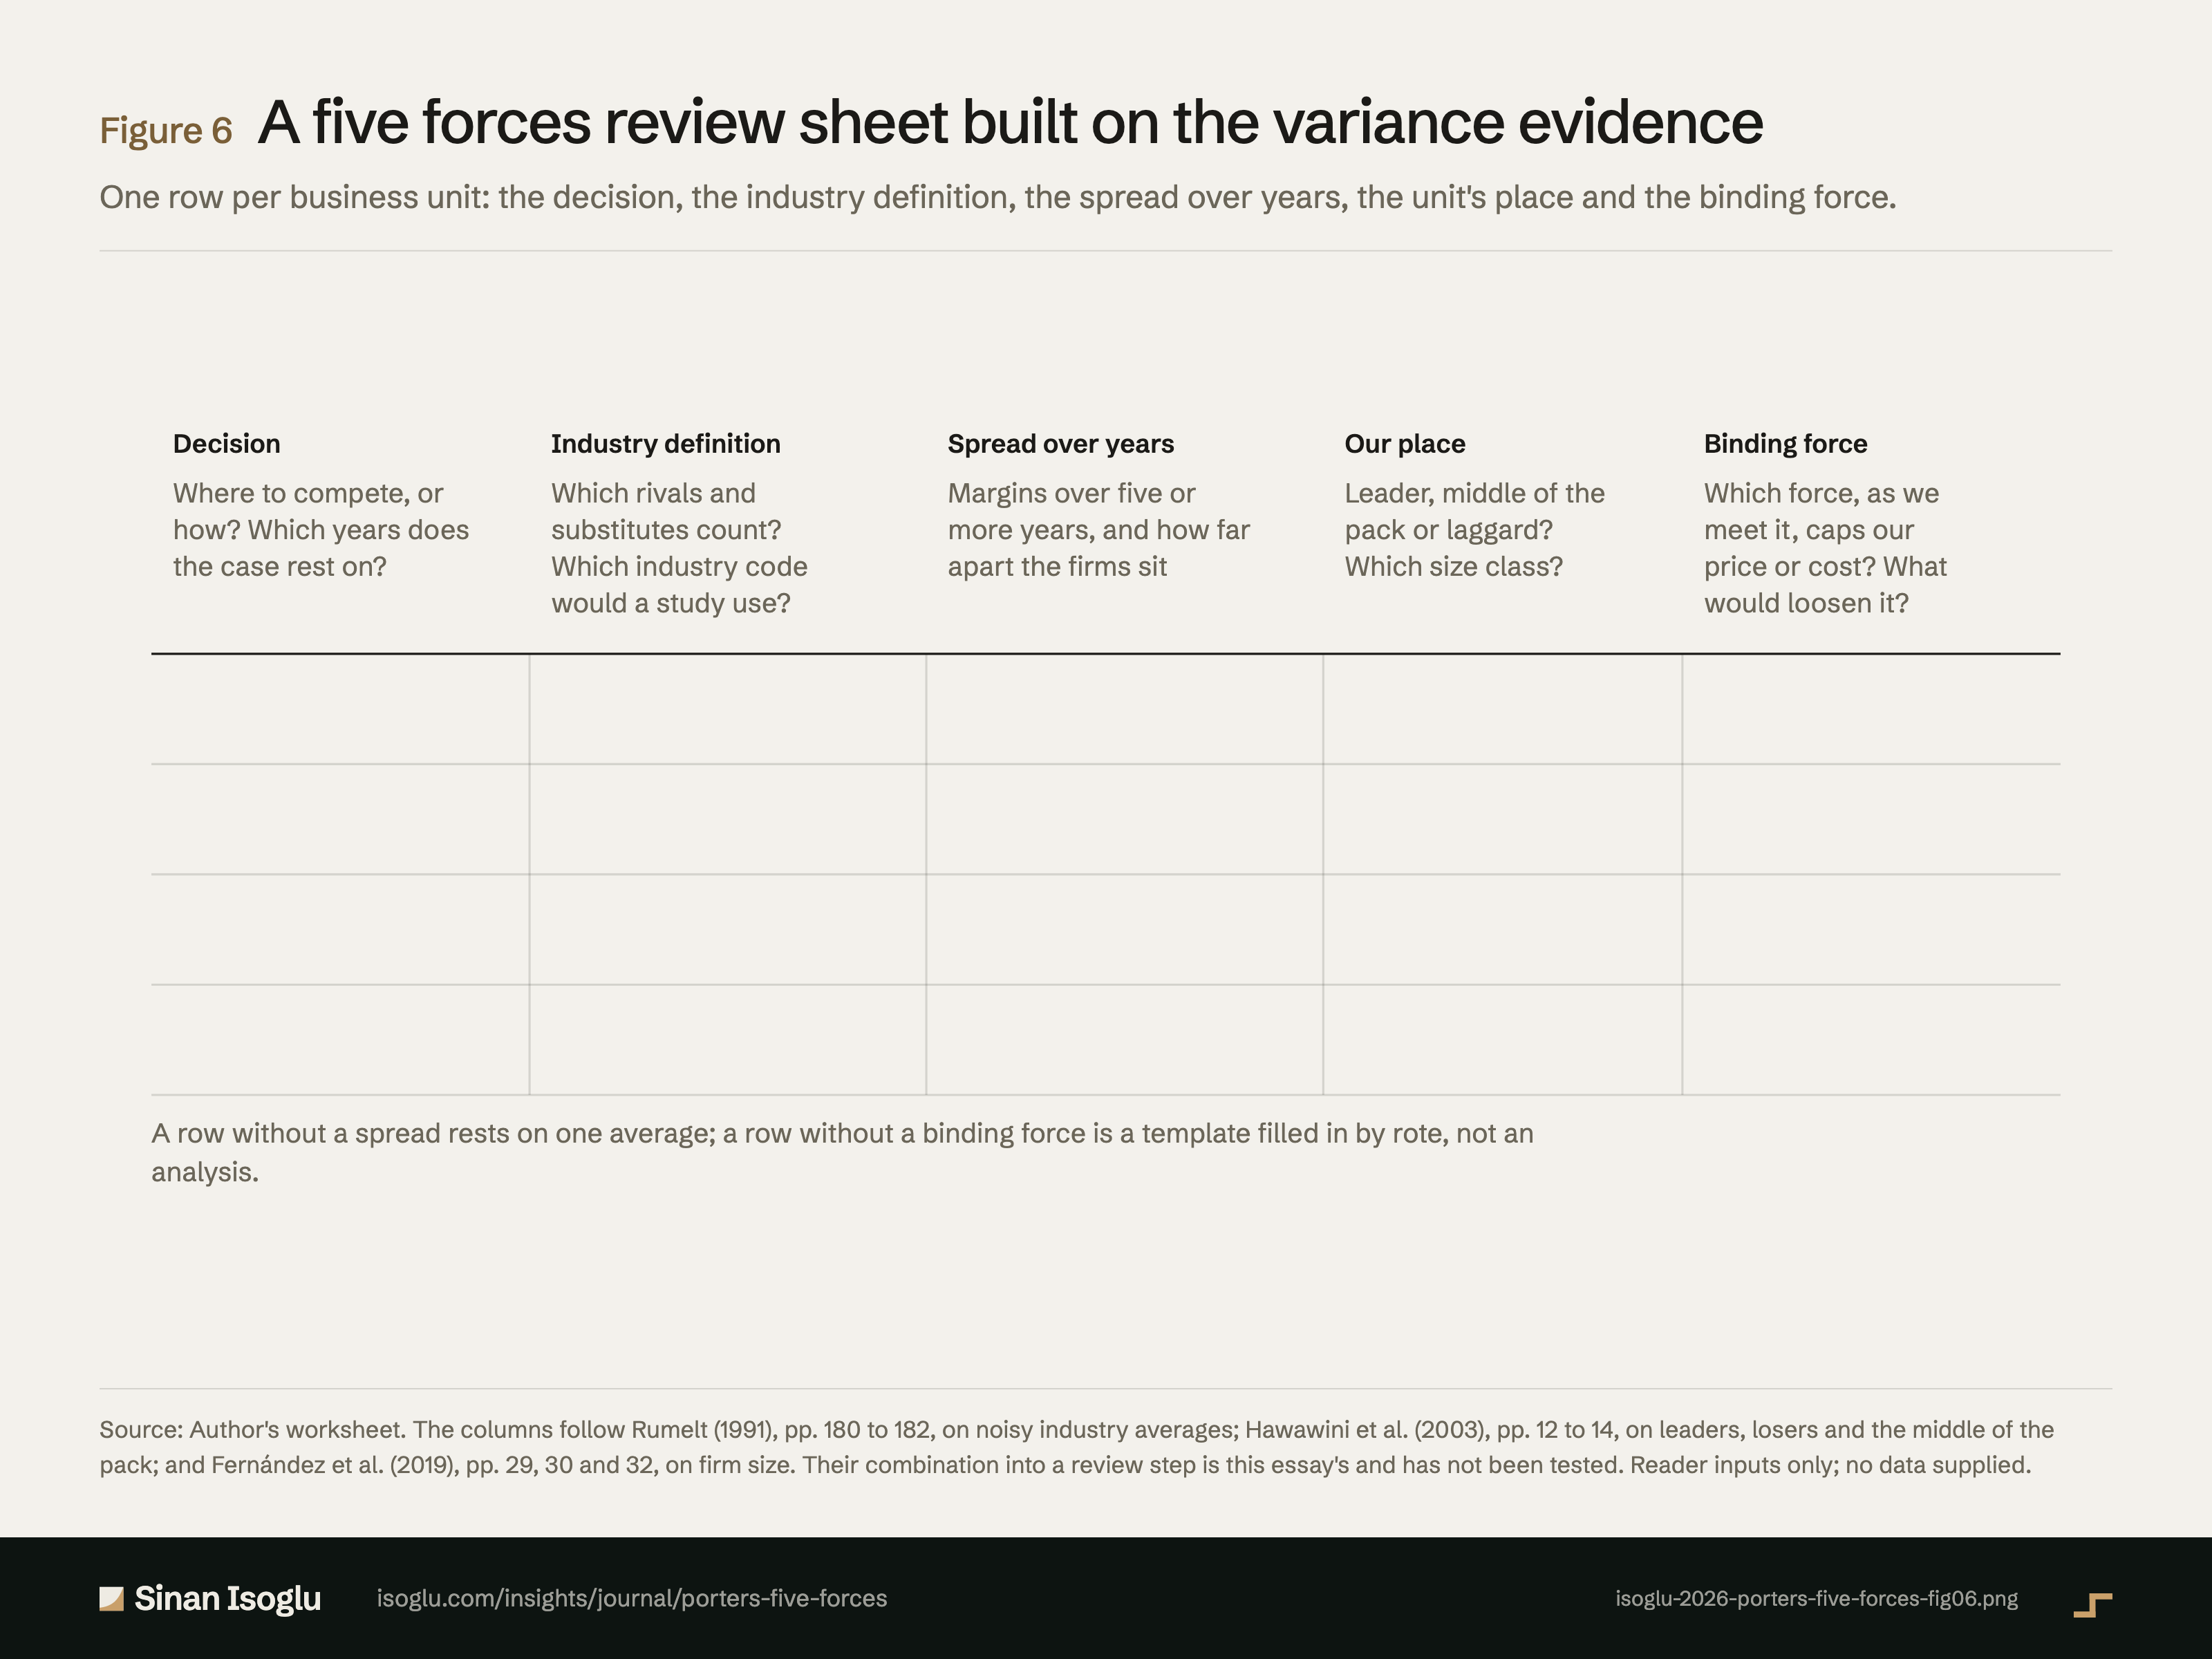
Figure 6Figure
A five forces review sheet built on the variance evidence
Porter's five forces: industry explains less than the firm does
Contact
Bring the question you're working on.
Research, a guest lecture, or a commercial question.