Figure 3From “Porter's five forces: industry explains less than the firm does”
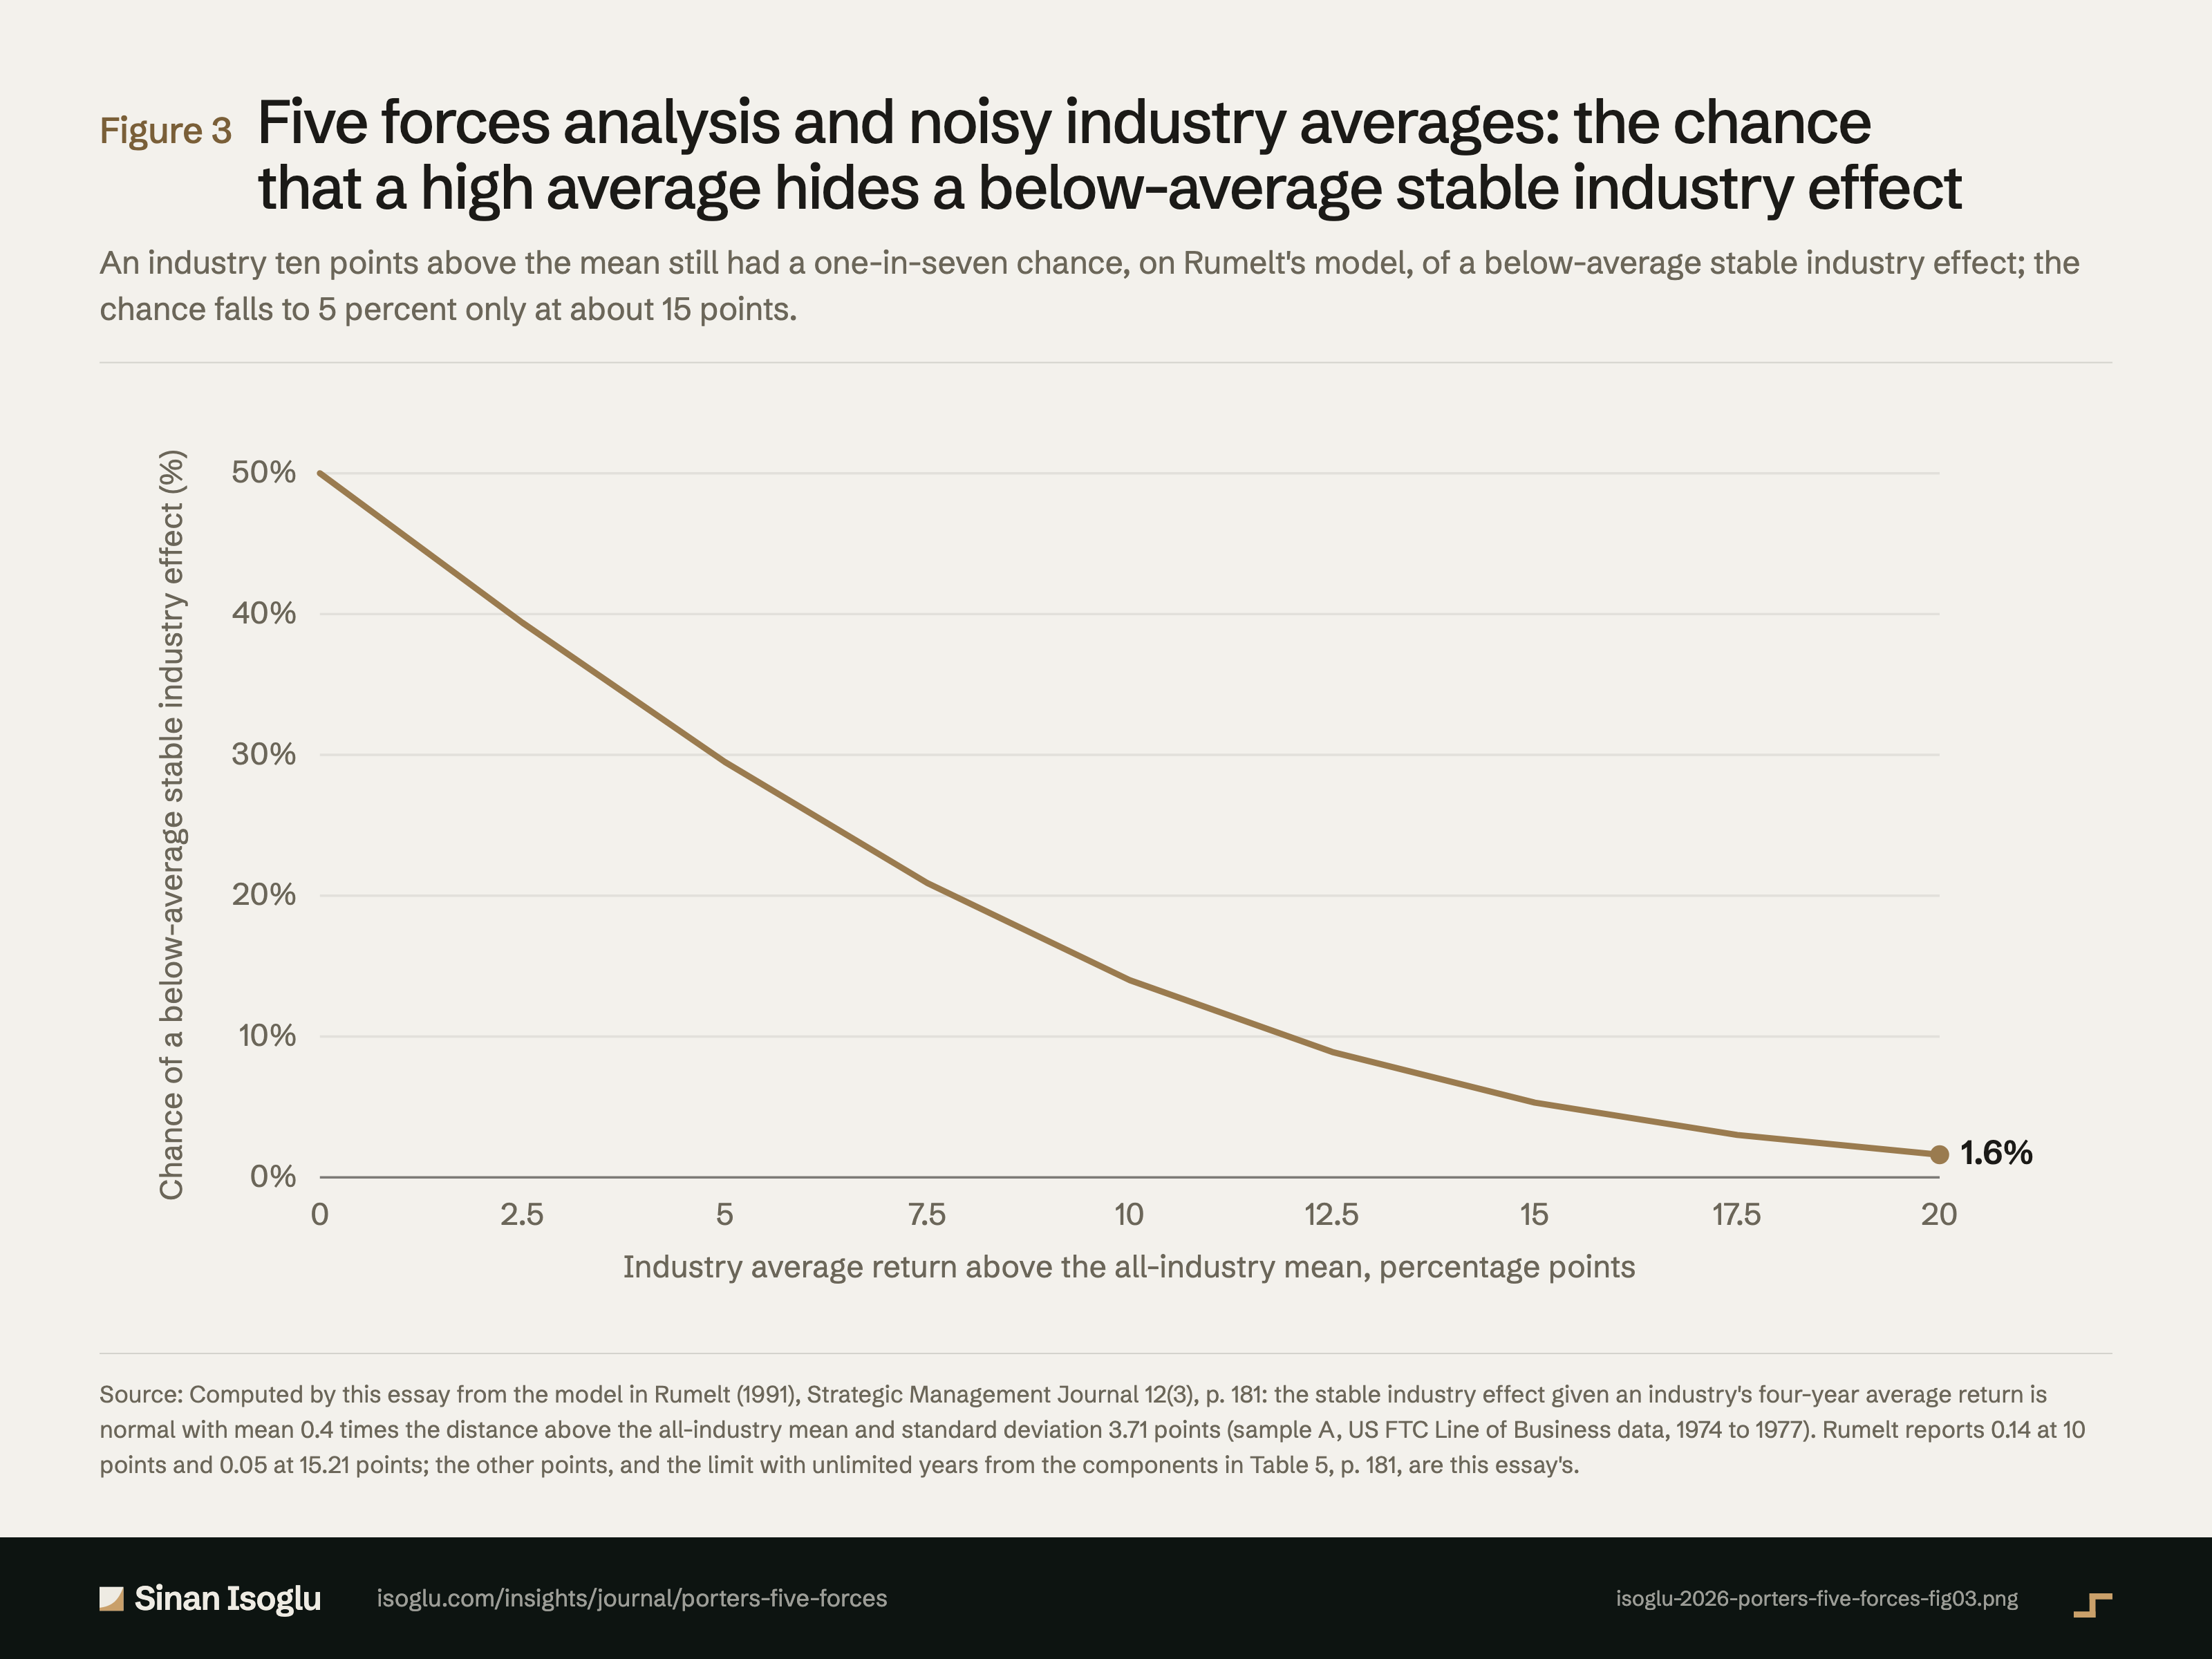
Five forces analysis and noisy industry averages: the chance that a high average hides a below-average stable industry effect
An industry ten points above the mean still had a one-in-seven chance, on Rumelt's model, of a below-average stable industry effect; the chance falls to 5 percent only at about 15 points.
Figure 3Five forces analysis and noisy industry averages: the chance that a high average hides a below-average stable industry effect
Source: Computed by this essay from the model in Rumelt (1991), Strategic Management Journal 12(3), p. 181: the stable industry effect given an industry's four-year average return is normal with mean 0.4 times the distance above the all-industry mean and standard deviation 3.71 points (sample A, US FTC Line of Business data, 1974 to 1977). Rumelt reports 0.14 at 10 points and 0.05 at 15.21 points; the other points, and the limit with unlimited years from the components in Table 5, p. 181, are this essay's.
Source and evidence
Each line names a claim related to this exhibit, its source, and how it was checked.
- A A verified against the printed page of the primary sourceB primary source, text layer onlyC authoritative secondaryD reported Industry averages are noisy: about 40 percent of the variance among four-year industry average returns is stable industry effect, about another 40 percent business-unit effects that randomly combine in industry averages, the remaining fifth (sample A) industry-year and business-unit-year fluctuations, the only part more years would shrink (Table 5); conditional model with mean 0.4 times the distance above the mean and standard deviation 3.71 (p. 181, read on the page image); at 10 points the estimate is 1.08 standard deviations above zero, probability 0.14 that the effect is negative; 15.21 points needed for 95 percent confidence; on the normal approximation about one in forty, some six of 242 industries, would pass, an expectation, not a tally (pp. 168, 180 to 182): "only about 40 percent of the variance among industry returns is actually due to stable industry effects"; "industry returns are noisy estimates of the true industry effects"; "this estimate is only 1.08 standard deviations above zero"; "the observed industry average must be at least 15.21 percentage points above the mean"; "could be judged (95 percent confidence) to have positive industry effects"; "This portion would be smaller had the averages been taken over more than 4 years"; "Fewer than one in forty industry returns are high enough to pass this test"; "effects which randomly combine to affect industry averages"; "The remaining variance (one-fifth in sample A, one-eighth in sample B) is due to various industry-year and business-unit-year fluctuations"Rumelt (1991)
- B A verified against the printed page of the primary sourceB primary source, text layer onlyC authoritative secondaryD reported Figure 3 curve: P(stable effect below average, given d) = Φ(−0.4 d / 3.71), from Rumelt’s p. 181 model; values 50.0, 39.4, 29.5, 20.9, 14.0, 8.9, 5.3, 3.0, 1.6 percent at 0 to 20 points in steps of 2.5; checks against Rumelt’s 0.14 at 10 and 0.05 at 15.21; with unlimited years only the industry (23.3) and business-unit (25.3) components of Table 5 remain, ζ = 0.479, σ = 3.48, so about 8.4 percent at 10 points (G5 N14); the strategy-deck implication is the author’sAuthor computation
From the essay
Go-to-market strategy
Porter's five forces: industry explains less than the firm does
Porter's five forces map pressures on industry profits. In three studies, firms differ more than industries do; in the middle of the pack the gap closes.
Read the essayThis exhibit belongs to an essay: the numbers live here, the argument lives there.
Cite or embed
Related exhibits
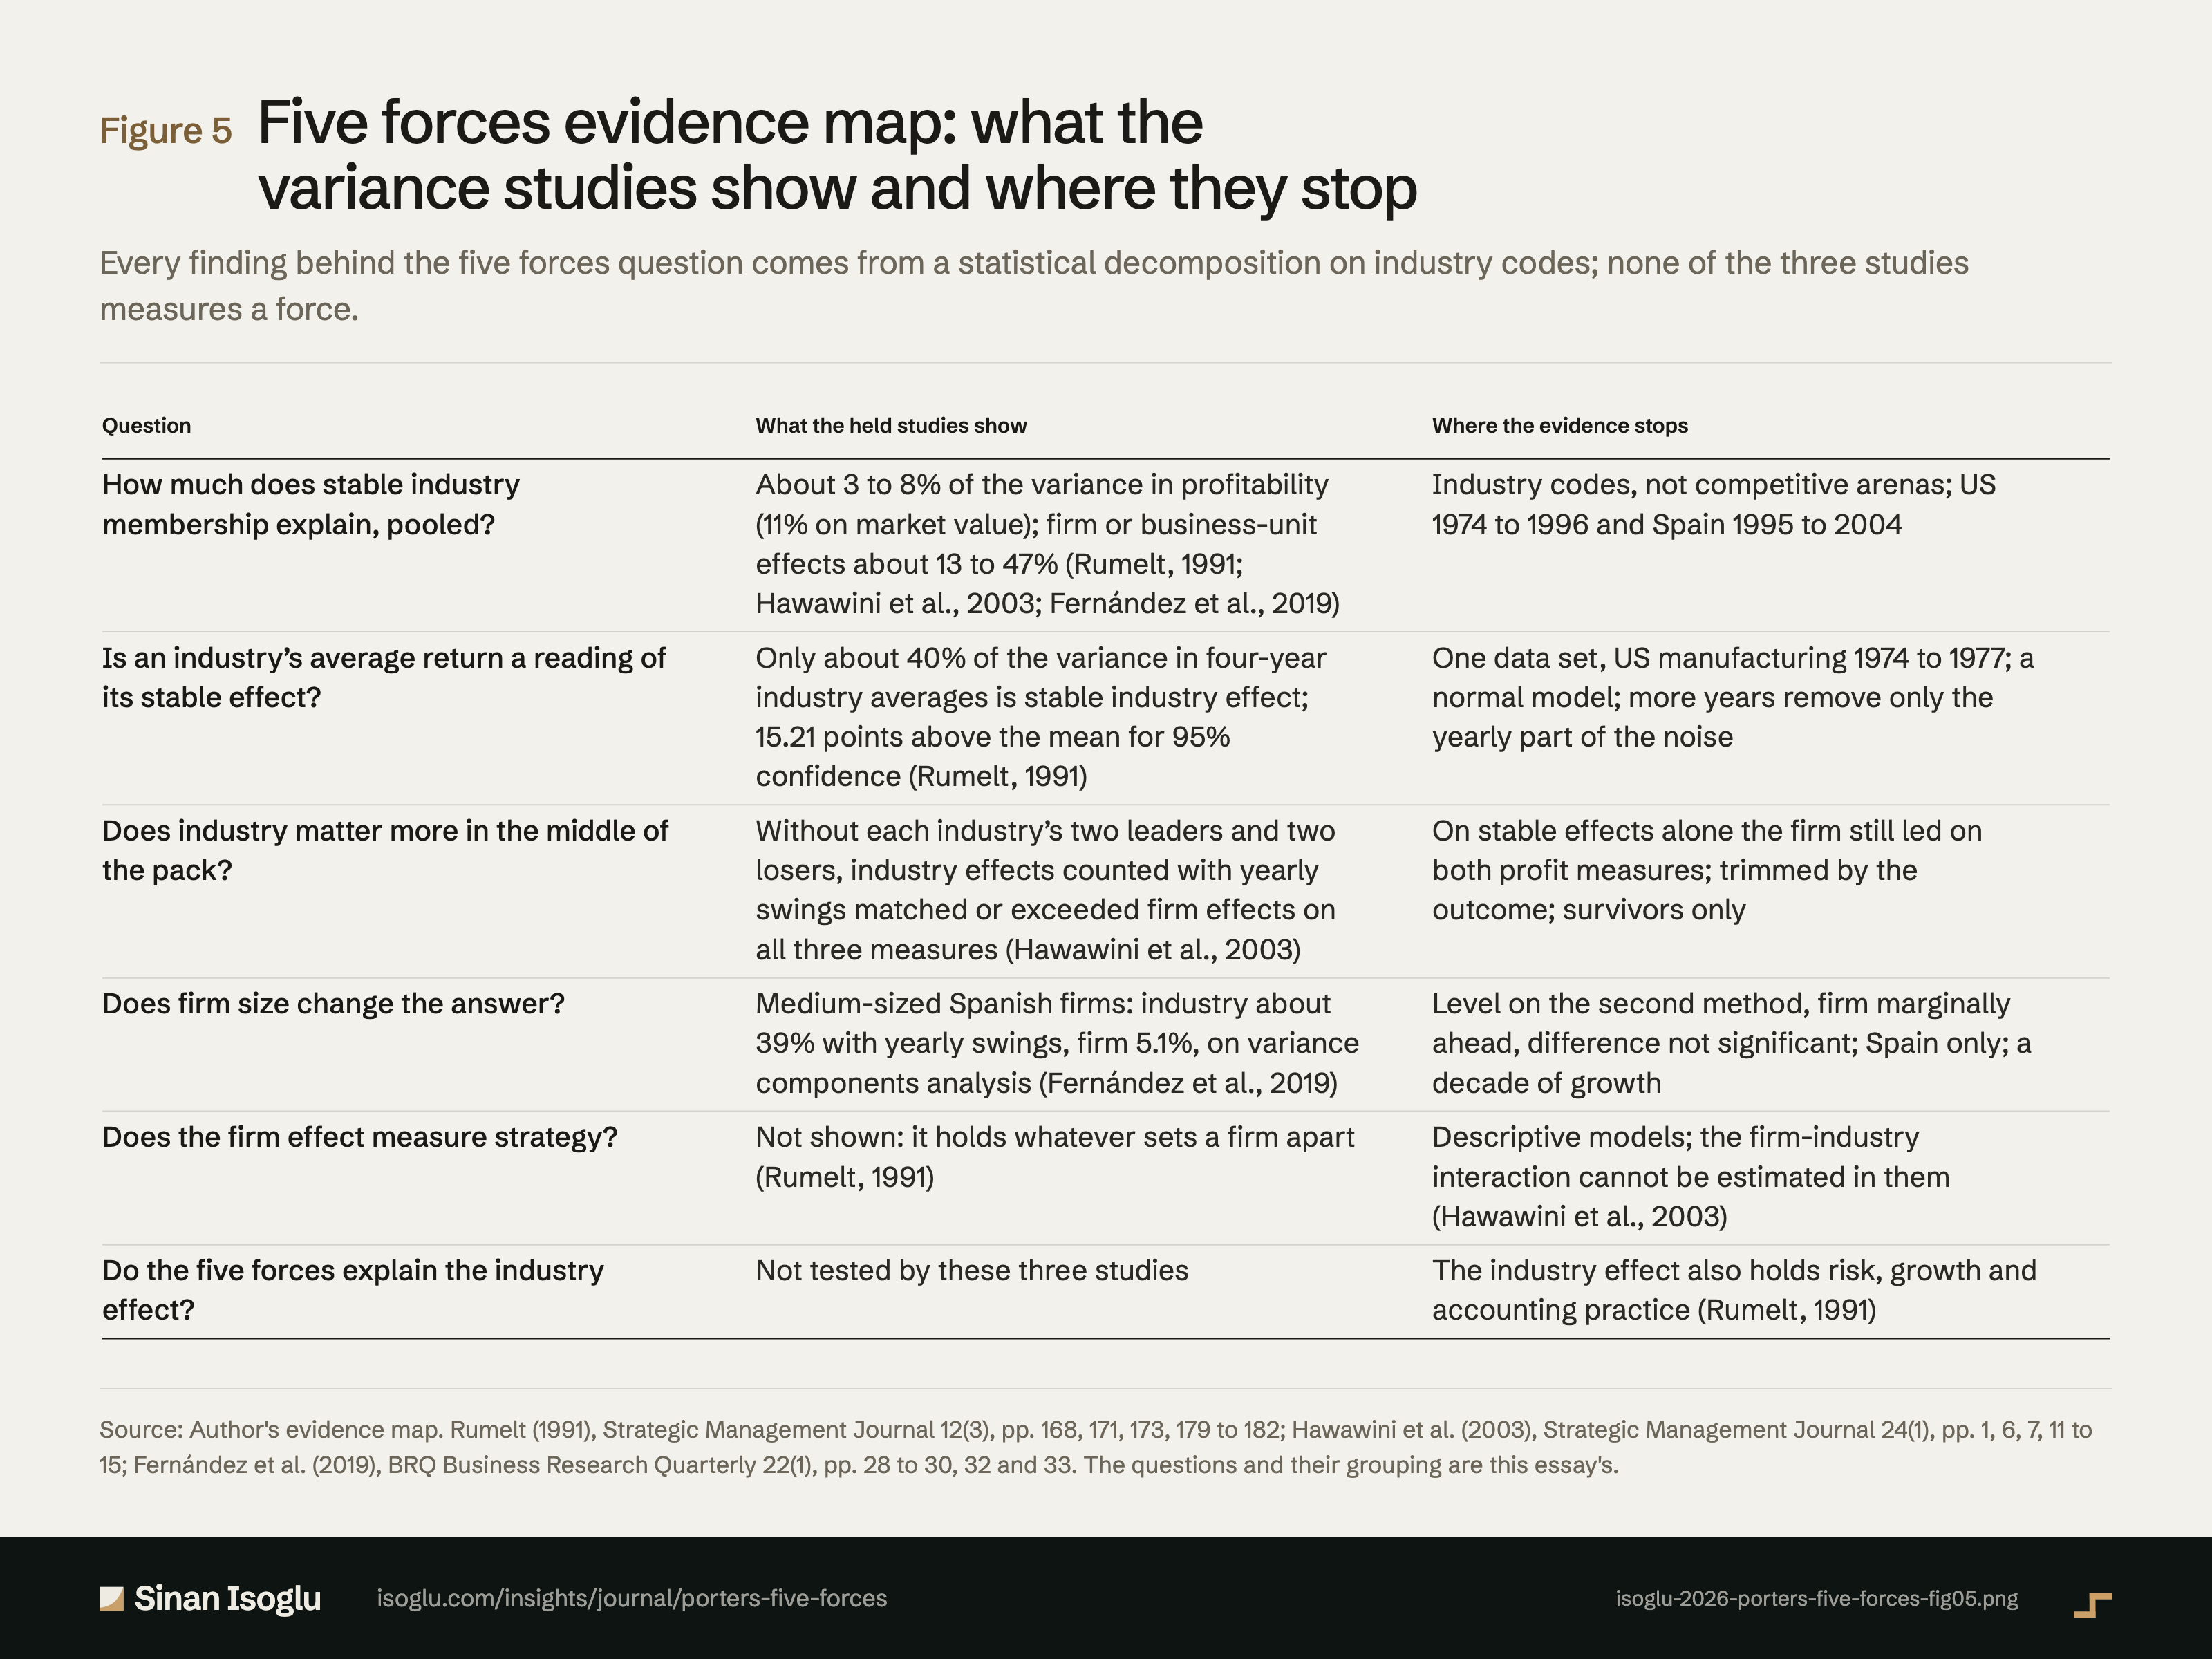
Figure 5Figure
Five forces evidence map: what the variance studies show and where they stop
Porter's five forces: industry explains less than the firm does
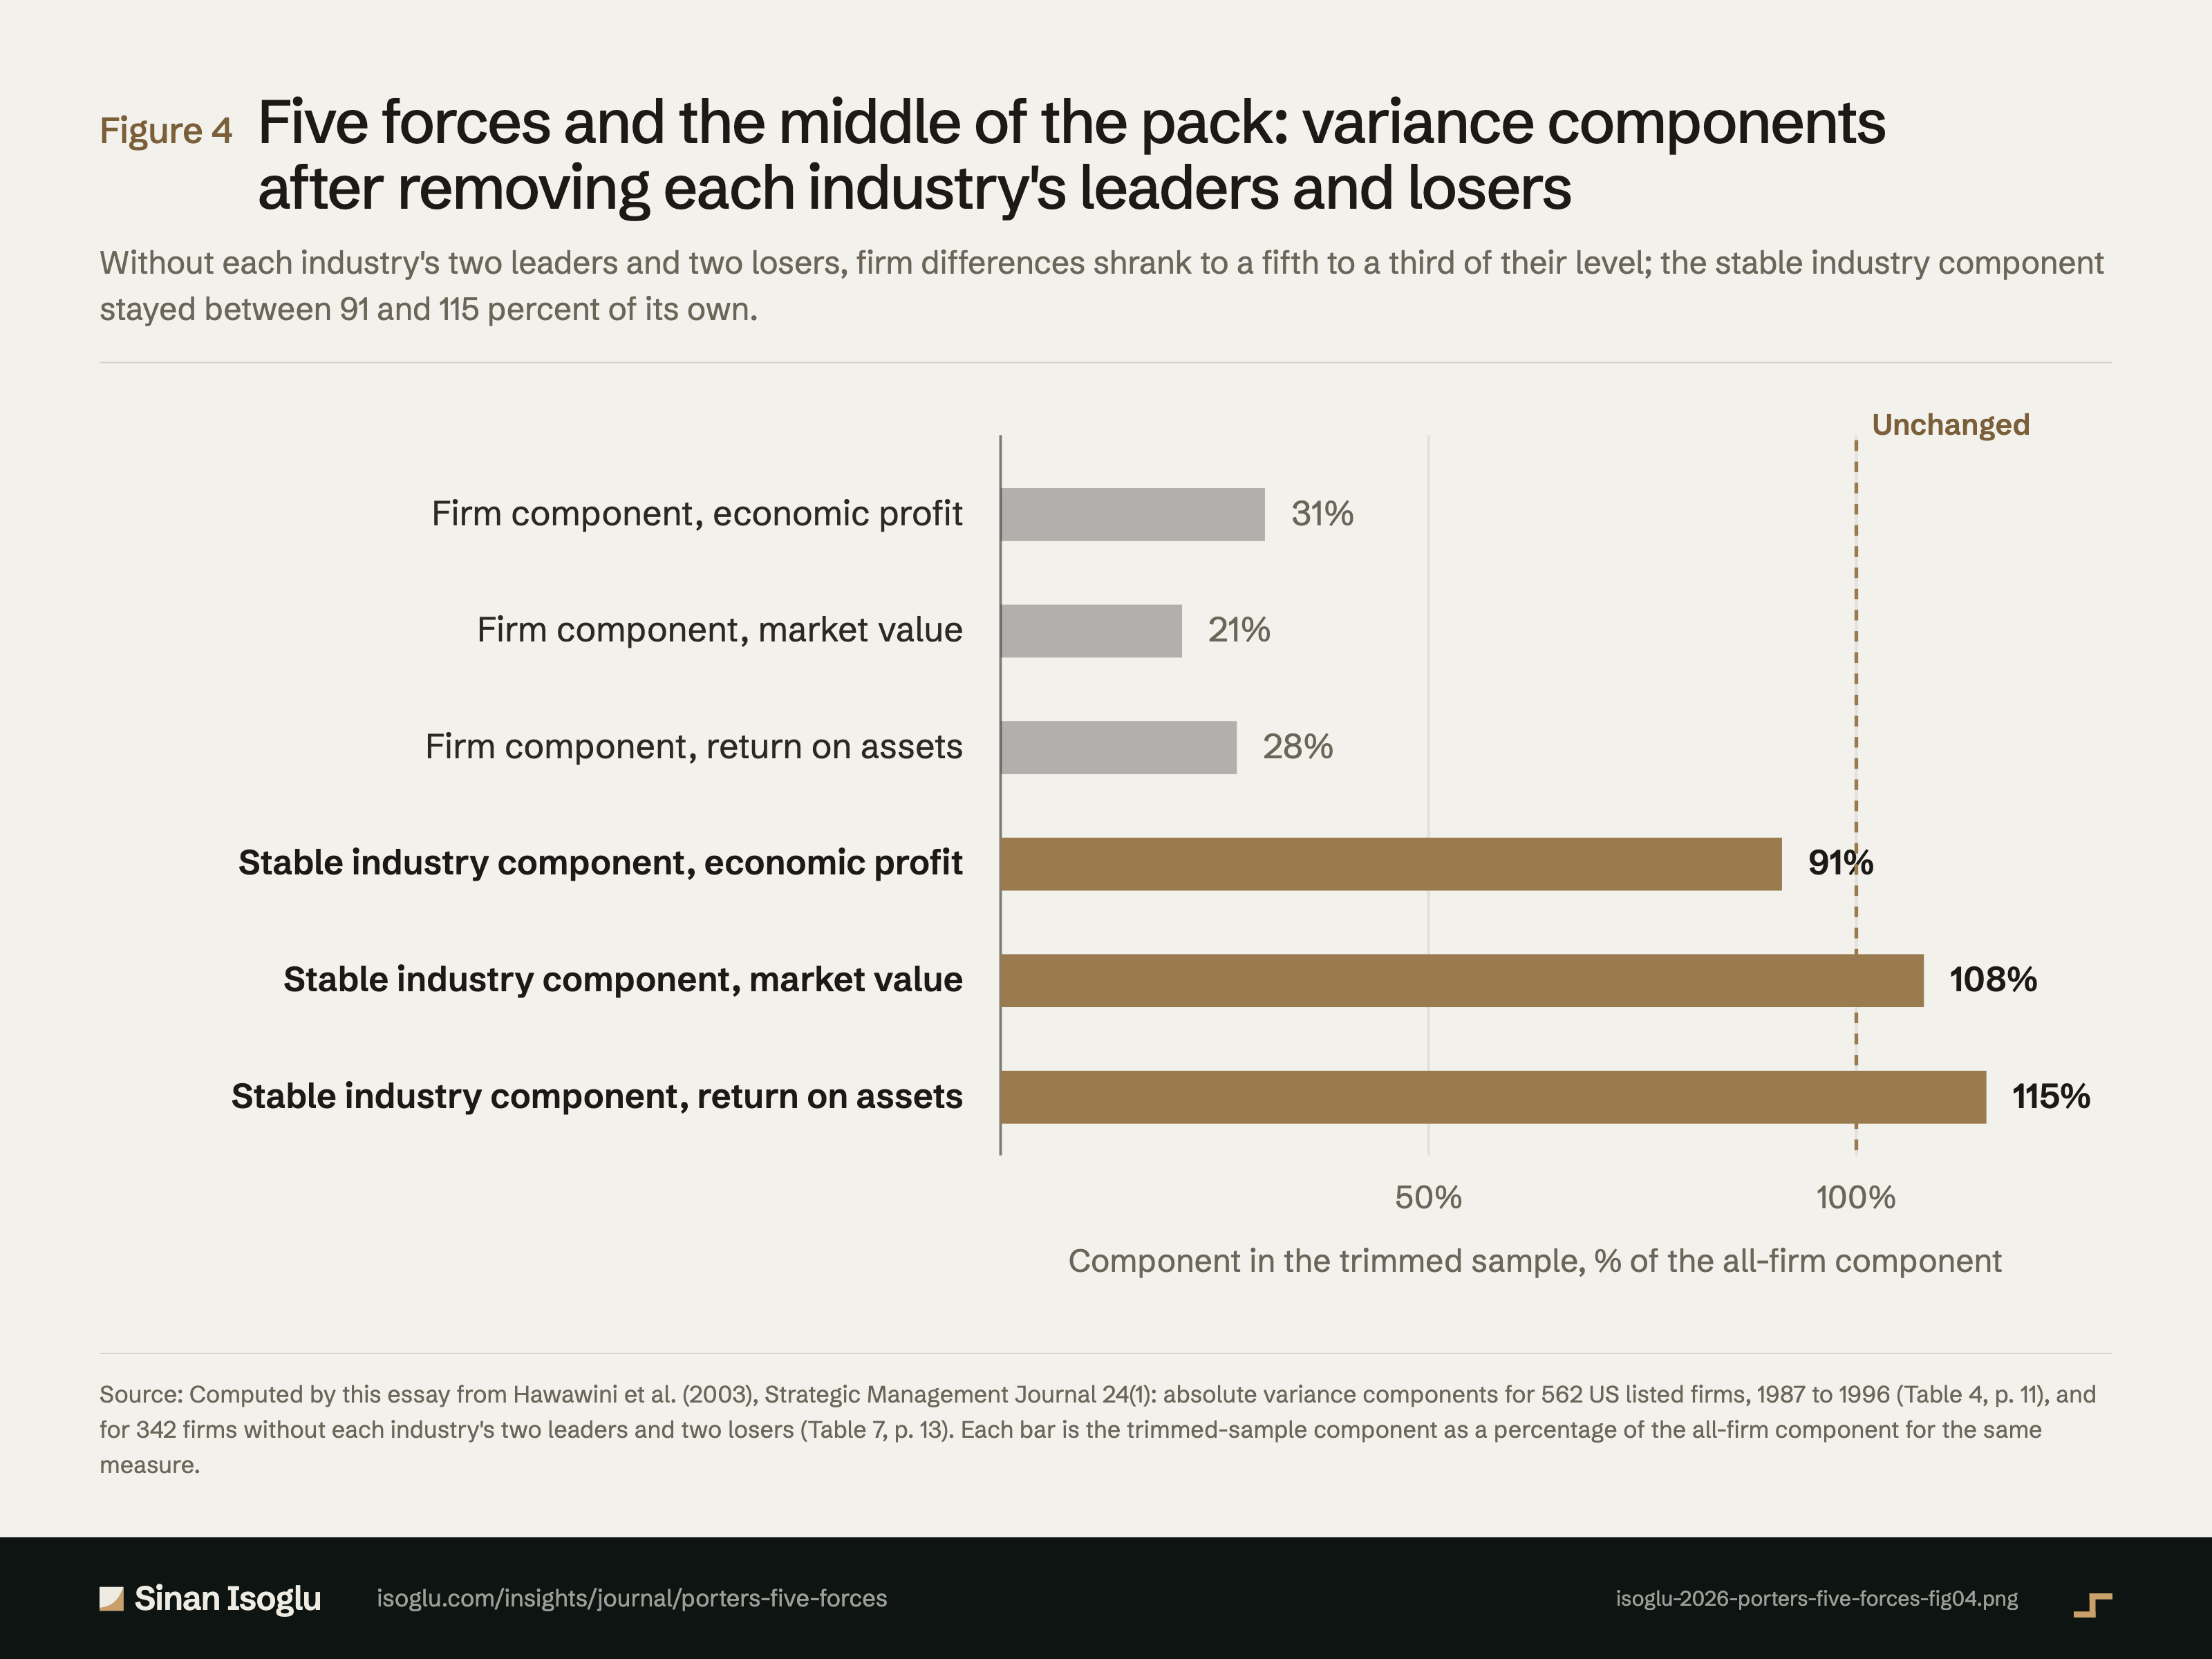
Figure 4Figure
Five forces and the middle of the pack: variance components after removing each industry's leaders and losers
Porter's five forces: industry explains less than the firm does
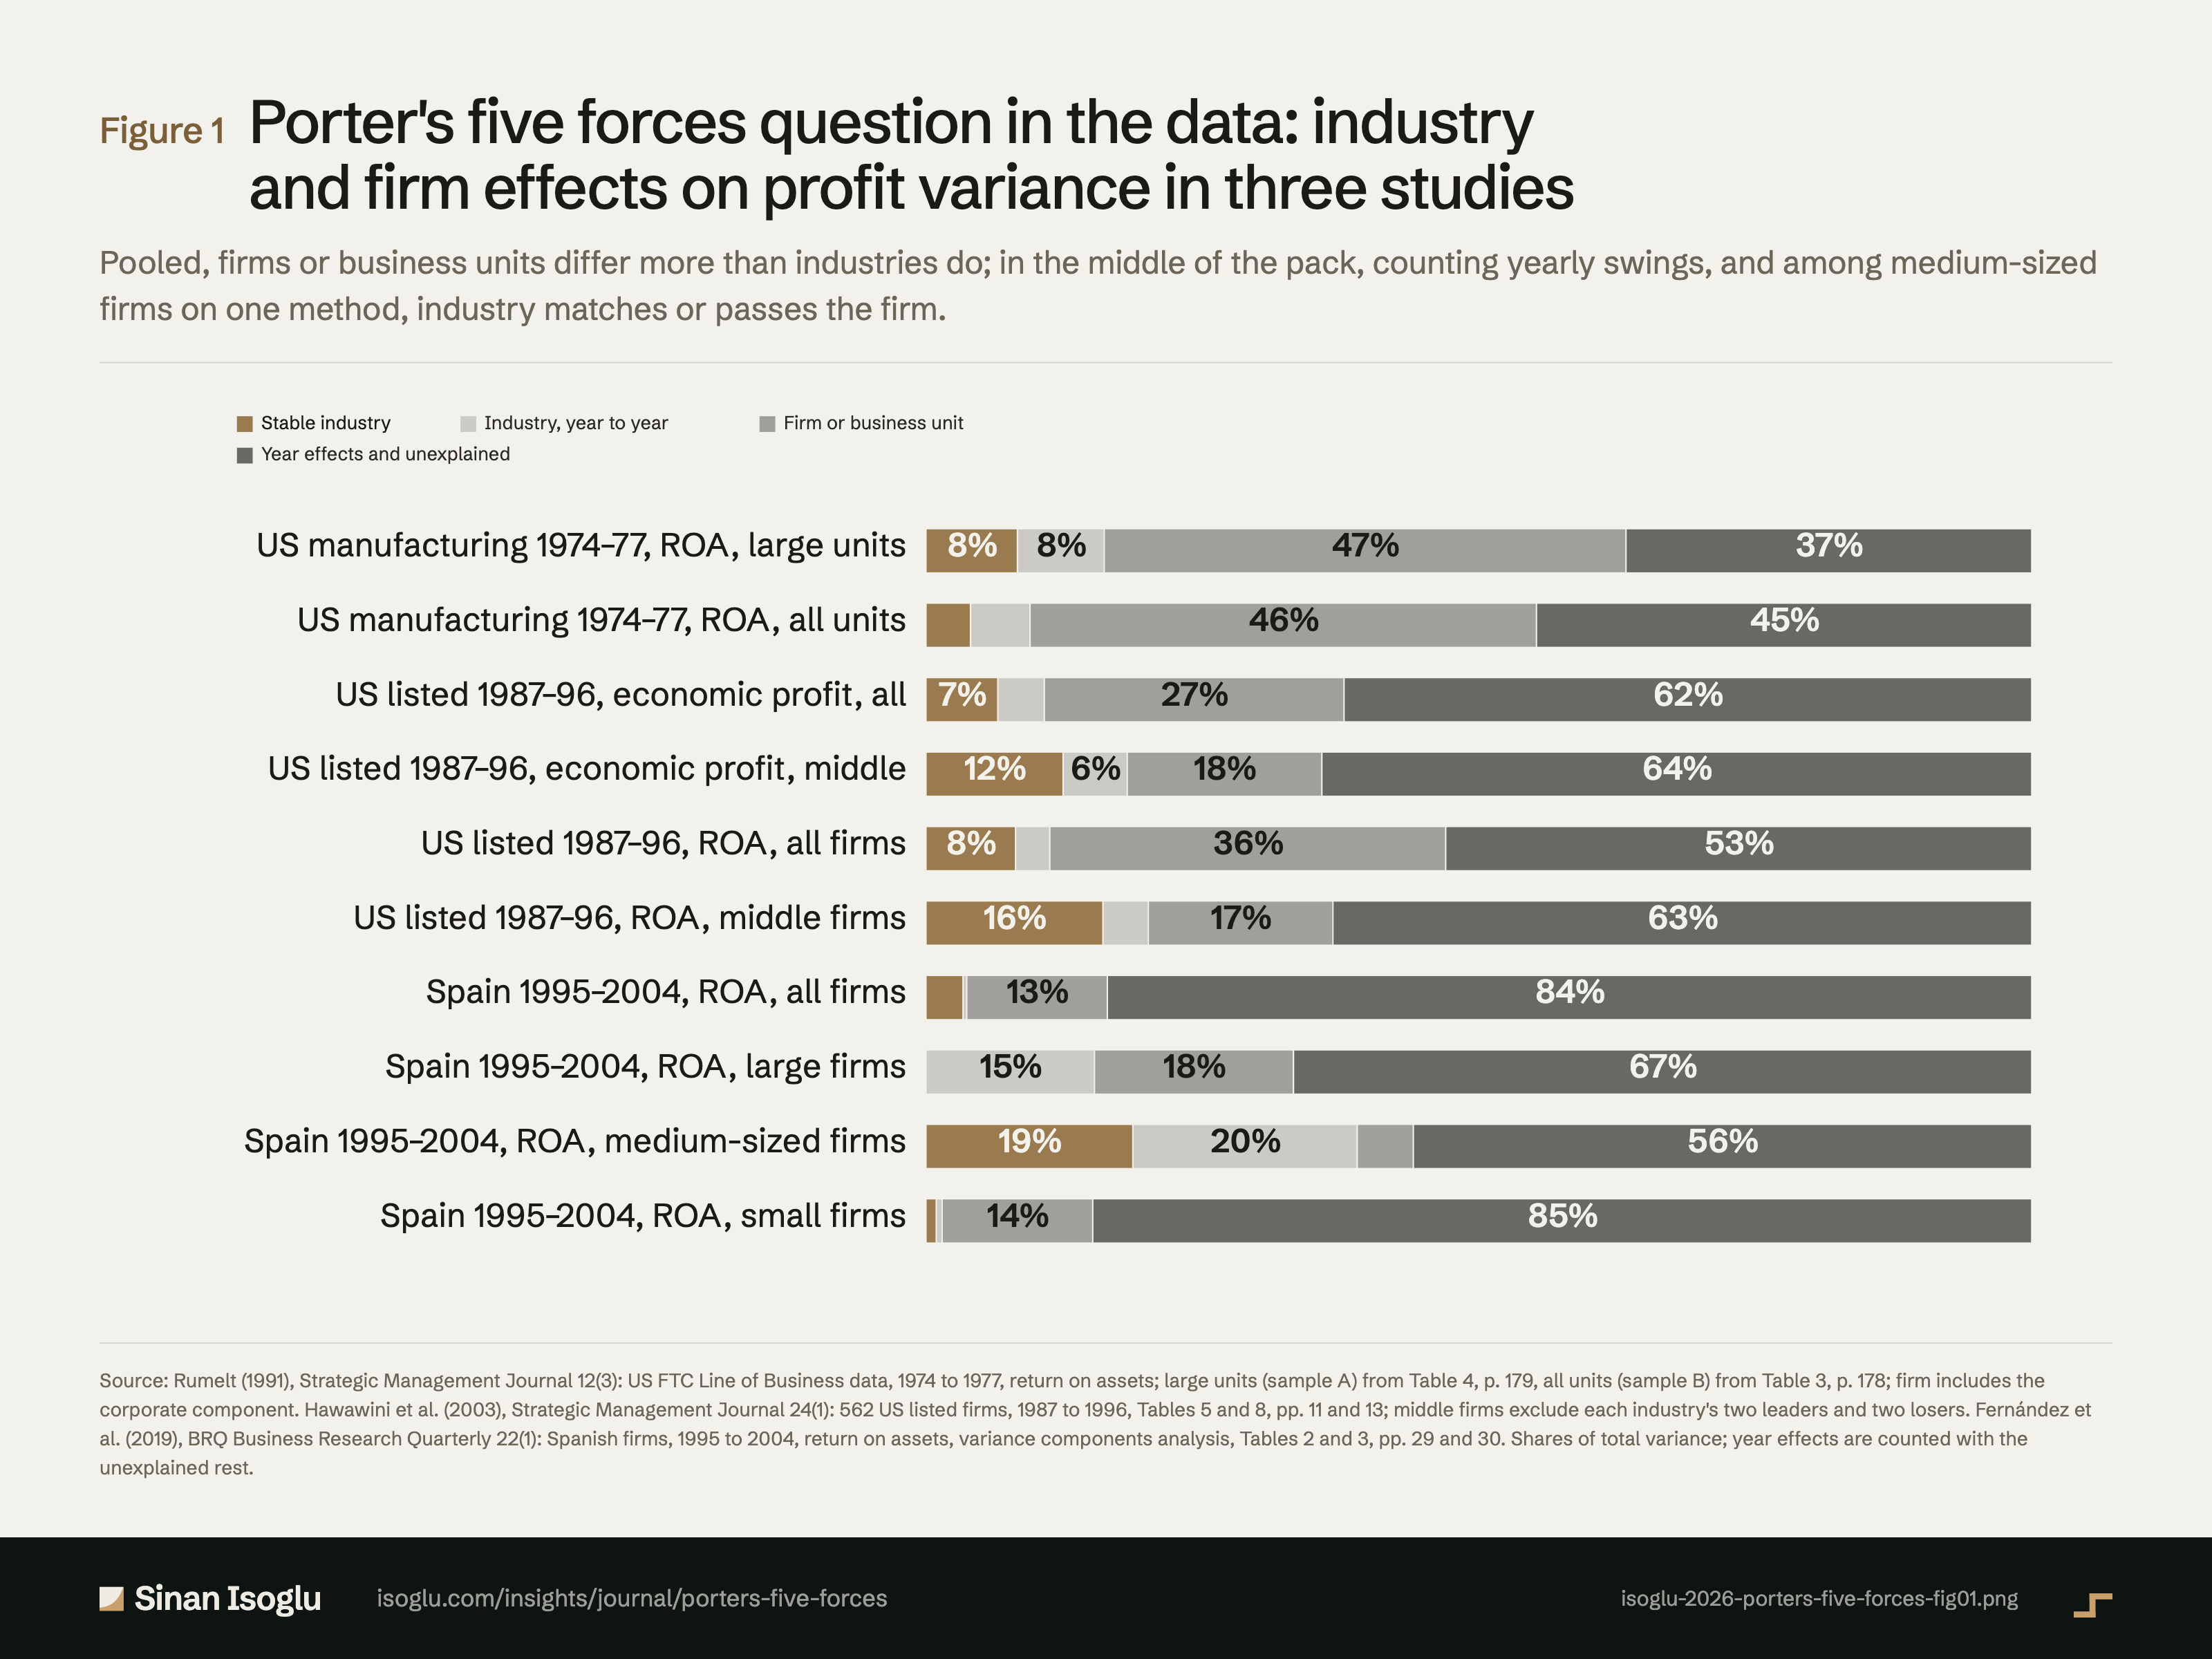
Figure 1Figure
Porter's five forces question in the data: industry and firm effects on profit variance in three studies
Porter's five forces: industry explains less than the firm does
Contact
Bring the question you're working on.
Research, a guest lecture, or a commercial question.