Abbildung 5Aus „Porters Five Forces: warum die Firma mehr zählt als die Branche“
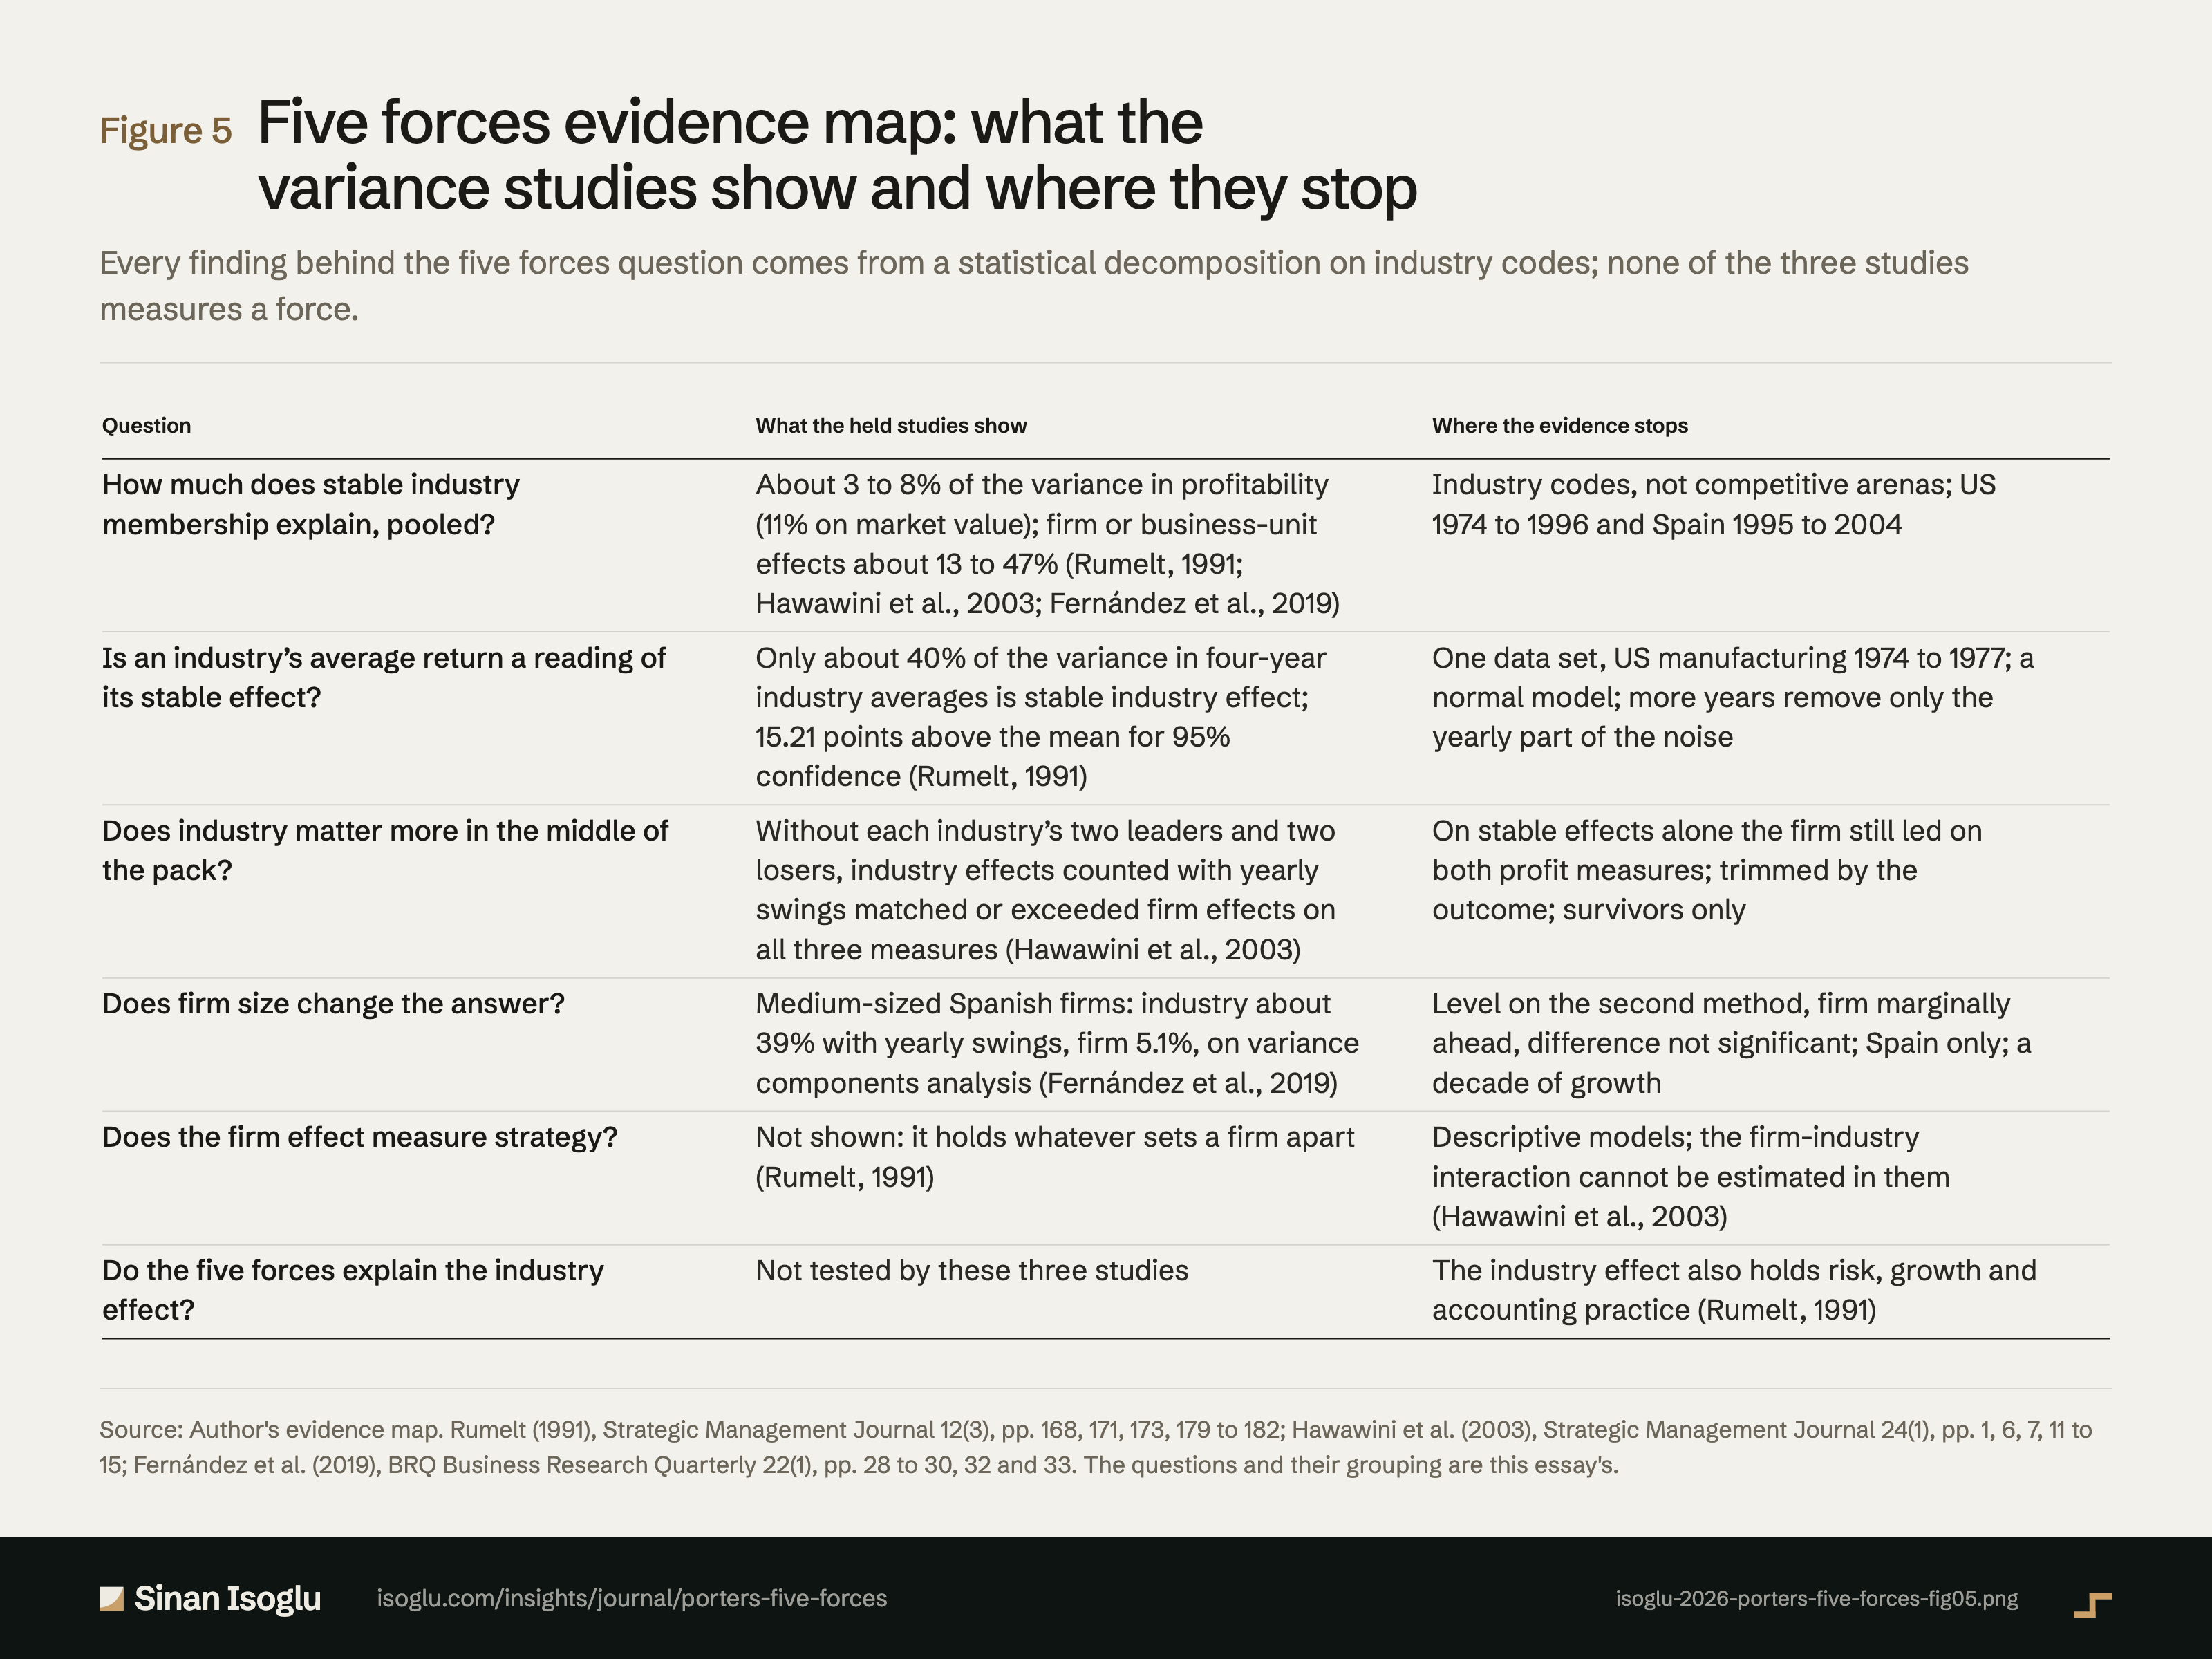
Five-Forces-Evidenzkarte: was die Varianzstudien zeigen und wo sie enden
Jeder Befund zur Five-Forces-Frage stammt aus einer statistischen Zerlegung auf Branchenschlüsseln; keine der drei Studien misst eine der Kräfte.
Abbildung 5Five-Forces-Evidenzkarte: was die Varianzstudien zeigen und wo sie enden
| Frage | Was die vorliegenden Studien zeigen | Wo die Evidenz endet |
|---|---|---|
| Wie viel erklärt die dauerhafte Branchenzugehörigkeit über alle Unternehmen? | Etwa 3 bis 8 % der Varianz der Rentabilität (11 % beim Marktwert); Unternehmenseffekte etwa 13 bis 47 % (Rumelt, 1991; Hawawini u. a., 2003; Fernández u. a., 2019) | Branchenschlüssel statt Wettbewerbsfelder; USA 1974 bis 1996 und Spanien 1995 bis 2004 |
| Zeigt die Durchschnittsrendite einer Branche ihren dauerhaften Effekt? | Nur etwa 40 % der Varianz der Vierjahres-Branchendurchschnitte sind dauerhafter Brancheneffekt; 15,21 Punkte über dem Mittel für 95 % Sicherheit (Rumelt, 1991) | Ein Datensatz, US-Industrie 1974 bis 1977; ein Normalverteilungsmodell; mehr Jahre beseitigen nur den jährlichen Teil des Rauschens |
| Zählt die Branche im Mittelfeld mehr? | Ohne die zwei Spitzenreiter und die zwei Schlusslichter jeder Branche erreichen oder übertreffen Brancheneffekte mit jährlichen Schwankungen die Unternehmenseffekte bei allen drei Maßen (Hawawini u. a., 2003) | Allein mit den dauerhaften Effekten liegt das Unternehmen bei beiden Gewinnmaßen vorn; Auswahl nach dem Ergebnis; nur Überlebende |
| Ändert die Größe die Antwort? | Mittlere spanische Unternehmen: Branche mit jährlichen Schwankungen etwa 39 %, Unternehmen 5,1 %, nach der Varianzkomponentenanalyse (Fernández u. a., 2019) | Mit dem zweiten Verfahren gleichauf, Unternehmen knapp vorn, Unterschied nicht signifikant; nur Spanien; ein Wachstumsjahrzehnt |
| Misst der Unternehmenseffekt Strategie? | Nicht gezeigt: Er enthält alles, was ein Unternehmen abhebt (Rumelt, 1991) | Beschreibende Modelle; das Zusammenspiel von Unternehmen und Branche lässt sich darin nicht schätzen (Hawawini u. a., 2003) |
| Erklären die fünf Kräfte den Brancheneffekt? | In diesen drei Studien nicht geprüft | Der Brancheneffekt enthält auch Risiko, Wachstum und Bilanzierungspraxis (Rumelt, 1991) |
Bei breiten Tabellen horizontal wischen oder scrollen.
Quelle: Evidenzkarte des Autors. Rumelt (1991), Strategic Management Journal 12(3), S. 168, 171, 173, 179 bis 182; Hawawini u. a. (2003), Strategic Management Journal 24(1), S. 1, 6, 7, 11 bis 15; Fernández u. a. (2019), BRQ Business Research Quarterly 22(1), S. 28 bis 30, 32 und 33. Die Fragen und ihre Gliederung stammen aus diesem Beitrag.
Quelle und Evidenz
Jede Zeile nennt eine Aussage zu dieser Abbildung, ihre Quelle und die Art ihrer Prüfung.
- A A gegen die gedruckte Seite der Primärquelle geprüftB Primärquelle, nur TextebeneC belastbare SekundärquelleD berichtet Partition of business-unit returns, restricted model: sample A (B) 8 (4) percent stable industry, 1 (2) corporate, 46 (44) business unit, 8 (5) industry-year, 37 (45) residual; Table 4 for sample A: 8.28, 7.84, 0.80, 46.38, 36.70 (sum 100.00); Table 3 for sample B: 4.03, 5.38, 1.64, 44.17, 44.79; business-unit variance six (eleven) times the industry variance; Table 3 prints 36.87 for the sample A error, Table 4 36.70, which sums (pp. 178, 179): "8 (4) percent industry effects, 1 (2) percent corporate effects, 46 (44) percent business-unit effects, 8 (5) percent industry-year effects, and 37 (45) percent residual error"; "business-units differ from one another within industries much more than industries differ from one another"; "six times larger in sample A and eleven times larger in sample B"Rumelt (1991)
- A A gegen die gedruckte Seite der Primärquelle geprüftB Primärquelle, nur TextebeneC belastbare SekundärquelleD berichtet What the components contain: the industry effect is the total of all persistent industry-specific impacts, from competitive behaviour and conditions of entry to risk and accounting practice; business-unit effects are business-specific skills, resources, reputations, learning and patents, and possibly allocation errors, which a test did not support (pp. 173, 178): "reflect differing competitive behavior, conditions of entry, rates of growth, demand-capacity conditions, differing levels of risk, differing asset utilization rates, differing accounting practices"; "they are due to the presence of business-specific skills, resources, reputations, learning, patents, and other intangible contributions to stable differences among business-unit returns"; "These results do not support the view that allocation errors are an important source of heterogeneity"Rumelt (1991)
- A A gegen die gedruckte Seite der Primärquelle geprüftB Primärquelle, nur TextebeneC belastbare SekundärquelleD berichtet The model is descriptive: it offers no causal or structural explanation and deliberately sets causal mechanisms aside (pp. 169, 172): "it offers no causal or structural explanation for profitability differences across industries, years, corporations, or business-units"; "My intention here is to suppress concern with causal mechanisms and focus instead on the question of focus"Rumelt (1991)
- A A gegen die gedruckte Seite der Primärquelle geprüftB Primärquelle, nur TextebeneC belastbare SekundärquelleD berichtet Industry averages are noisy: about 40 percent of the variance among four-year industry average returns is stable industry effect, about another 40 percent business-unit effects that randomly combine in industry averages, the remaining fifth (sample A) industry-year and business-unit-year fluctuations, the only part more years would shrink (Table 5); conditional model with mean 0.4 times the distance above the mean and standard deviation 3.71 (p. 181, read on the page image); at 10 points the estimate is 1.08 standard deviations above zero, probability 0.14 that the effect is negative; 15.21 points needed for 95 percent confidence; on the normal approximation about one in forty, some six of 242 industries, would pass, an expectation, not a tally (pp. 168, 180 to 182): "only about 40 percent of the variance among industry returns is actually due to stable industry effects"; "industry returns are noisy estimates of the true industry effects"; "this estimate is only 1.08 standard deviations above zero"; "the observed industry average must be at least 15.21 percentage points above the mean"; "could be judged (95 percent confidence) to have positive industry effects"; "This portion would be smaller had the averages been taken over more than 4 years"; "Fewer than one in forty industry returns are high enough to pass this test"; "effects which randomly combine to affect industry averages"; "The remaining variance (one-fifth in sample A, one-eighth in sample B) is due to various industry-year and business-unit-year fluctuations"Rumelt (1991)
- A A gegen die gedruckte Seite der Primärquelle geprüftB Primärquelle, nur TextebeneC belastbare SekundärquelleD berichtet Limits the author states: four-digit FTC industries may be too broad; the variance of business-unit effects may differ between industries (p. 182): "industries are simply too broad to reveal the true strength of industry effects"; "some industries being much more heterogeneous than others"Rumelt (1991)
- A A gegen die gedruckte Seite der Primärquelle geprüftB Primärquelle, nur TextebeneC belastbare SekundärquelleD berichtet Full sample, Table 5: firm effects 27.1, 32.5 and 35.8 percent (EP/CE, TMV/CE, ROA); stable industry 6.5, 11.4 and 8.1; industry-year 4.2, 2.9 and 3.1; total industry 10.7, 14.3 and 11.2; stable firm effects more than four times stable industry effects for EP/CE and ROA (p. 11): "Total industry effects for EP/CE, TMV/CE and ROA are 10.7 percent, 14.3 percent, and 11.2 percent, respectively"; "the corresponding figures for stable firm effects are 27.1 percent, 32.5 percent, and 35.8 percent"; "stable firm effects dominate stable industry effects by a factor of more than four"Hawawini, Subramanian and Verdin (2003)
- A A gegen die gedruckte Seite der Primärquelle geprüftB Primärquelle, nur TextebeneC belastbare SekundärquelleD berichtet Middle of the pack, Table 8: industry effects (stable plus transient, as the authors compare them) 18.2 against firm 17.6 percent for EP/CE, 20.1 against 16.7 for ROA, 35.2 against 17.0 for TMV/CE; on stable industry effects alone 12.4 against 17.6 (EP/CE), 16.0 against 16.7 (ROA), 30.2 against 17.0 (TMV/CE); the transient component measures sensitivity to business cycles; firm-specific assets matter more only for the few leaders and losers (pp. 1, 7, 12, 13, 14): "overall industry effects (the sum of stable and transient industry effects) explain 35.2 percent in variation compared to only 17.0 percent for firm effects"; "In the case of EP/CE it is 18.2 percent for industry effects vs. 17.6 percent for firm effects and for ROA it is 20.1 percent against 16.7 percent"; "only for a few dominant value creators (leaders) and destroyers (losers) do firm-specific assets seem to matter significantly more than industry factors"; "Industry factors may have a large impact on the performance of the ‘also-ran’ firms, while for the industry leaders and losers it is firm factors that dominate"; "the transient component of industry effects measures the sensitivity of profitability to the impact of business cycles on the industry"Hawawini, Subramanian and Verdin (2003)
- A A gegen die gedruckte Seite der Primärquelle geprüftB Primärquelle, nur TextebeneC belastbare SekundärquelleD berichtet Limits the authors state: a statistical decomposition that does not identify sources; SIC may miss strategically relevant industries; large unexplained share; the industry-firm interaction cannot be estimated because firm is nested in industry; corporate and business effects cannot be separated, which may understate industry; 1,000 listed and possibly large firms (pp. 13 to 15): "this study performs a statistical decomposition and does not investigate the exact sources of these effects"; "the SIC system in some cases does not identify strategically relevant industries"; "a significant proportion of the performance variations observed is due to as yet completely unexplained factors"; "with the current model we cannot estimate this interaction because the firm factor is nested within the industry"; "the data do not allow us to distinguish between corporate- and business-level effects and hence may underestimate industry effects"; "a data set containing only 1000 listed firms that may potentially be large, and hence we should be cautious when seeking to generalize the results"Hawawini, Subramanian and Verdin (2003)
- A A gegen die gedruckte Seite der Primärquelle geprüftB Primärquelle, nur TextebeneC belastbare SekundärquelleD berichtet Pooled, Table 2: firm 12.71 percent, industry 3.35, year 0.48, industry-year 0.34, residual 83.12 (the printed total 156.82 is the small-firm total; the shares are of 211.14) (p. 29): "These show that the firm effect has the greatest explanatory power, while the industry effect is less important"; "a significant part of the variance of ROA is not explained by the model"Fernández et al. (2019)
- A A gegen die gedruckte Seite der Primärquelle geprüftB Primärquelle, nur TextebeneC belastbare SekundärquelleD berichtet By size, variance components analysis, Table 3: large firm 17.99, stable industry 0.00, industry-year 15.24; medium firm 5.07, industry 18.71, industry-year 20.29; small firm 13.62, industry 0.93, industry-year 0.53 percent; industry about 39 percent against 5.07 for medium firms (pp. 29, 30, 32): "In the case of large firms, the transient industry effect explains almost as much as the firm effect, but the stable component of the industry effect has no significance whatever"; "In the case of medium-sized firms, the importance of the industry effect is eight times that of the firm effect, and is almost equally split between its two components, stable and transient"; "approximately 39% of variance explained by the industry and industry-year effects and 5.07% by the firm effect"Fernández et al. (2019)
- A A gegen die gedruckte Seite der Primärquelle geprüftB Primärquelle, nur TextebeneC belastbare SekundärquelleD berichtet Second method (HLM, time fixed, no industry-year term), Tables 3 and 4: medium firm 5.61 against industry 5.17 percent; the authors call the medium-size industry advantage not overwhelming and the difference not significant (pp. 29, 30): "although the greater importance of the industry effect in the case of medium-sized firms is not overwhelming"; "although the difference between effects is not significant"Fernández et al. (2019)
- A A gegen die gedruckte Seite der Primärquelle geprüftB Primärquelle, nur TextebeneC belastbare SekundärquelleD berichtet Limits the authors state: no business-unit data, so a single firm effect that may understate industry; Spain only; replication in other countries proposed (pp. 28, 33): "We therefore measured a single effect at the level of the firm, which might have given rise to the industry effect being underestimated"; "it does not contain data from other countries, which prevents further generalization of the results obtained"; "very interesting to replicate the analysis in a group of countries"Fernández et al. (2019)
- B A gegen die gedruckte Seite der Primärquelle geprüftB Primärquelle, nur TextebeneC belastbare SekundärquelleD berichtet Figure 5 evidence map: the questions and their grouping, and the three limits (none of these studies tests a force; the firm effect is not strategy; old and narrow evidence)Author evidence map
Aus dem Beitrag
Go-to-Market-Strategie
Porters Five Forces: warum die Firma mehr zählt als die Branche
Die Five Forces nach Porter erfassen den Druck auf Branchengewinne. In drei Studien unterscheiden sich Firmen stärker als Branchen, im Mittelfeld kaum.
Den Beitrag lesenDiese Abbildung gehört zu einem Essay: Die Zahlen stehen hier, das Argument dort.
Zitieren oder einbetten
Verwandte Abbildungen
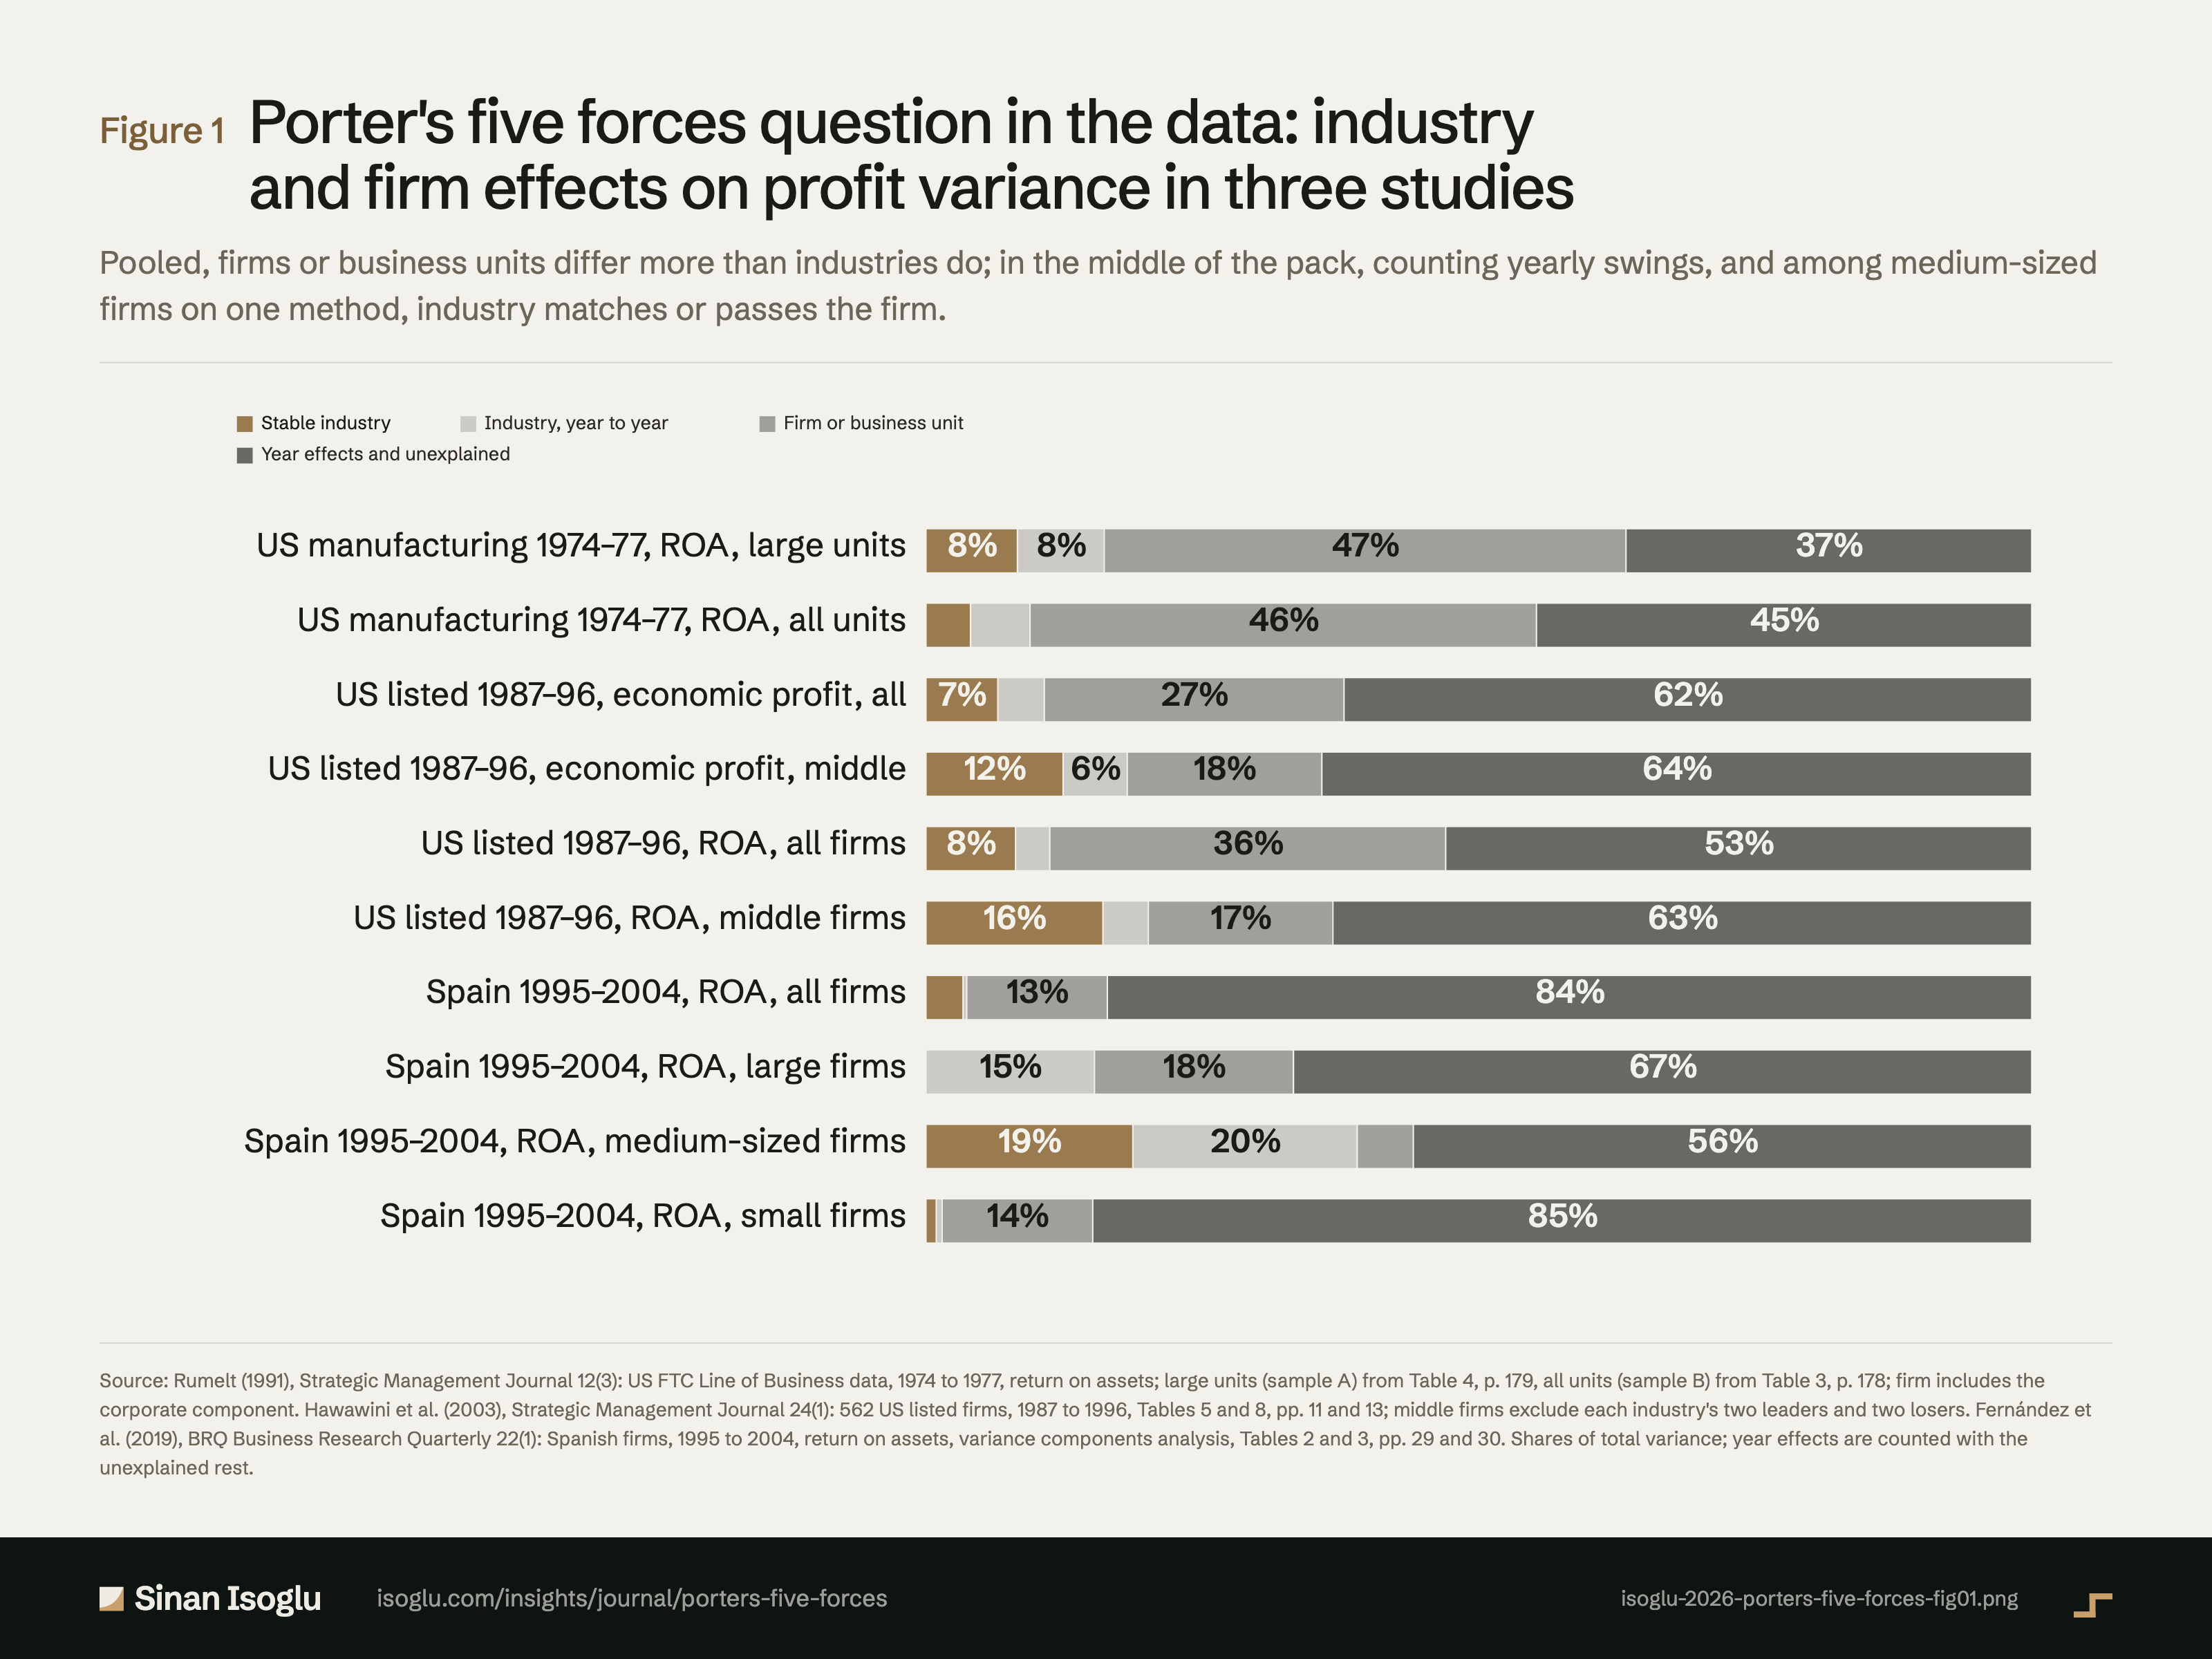
Abbildung 1Grafik
Die Five-Forces-Frage in den Daten: Branchen- und Unternehmenseffekte in drei Studien
Porters Five Forces: warum die Firma mehr zählt als die Branche
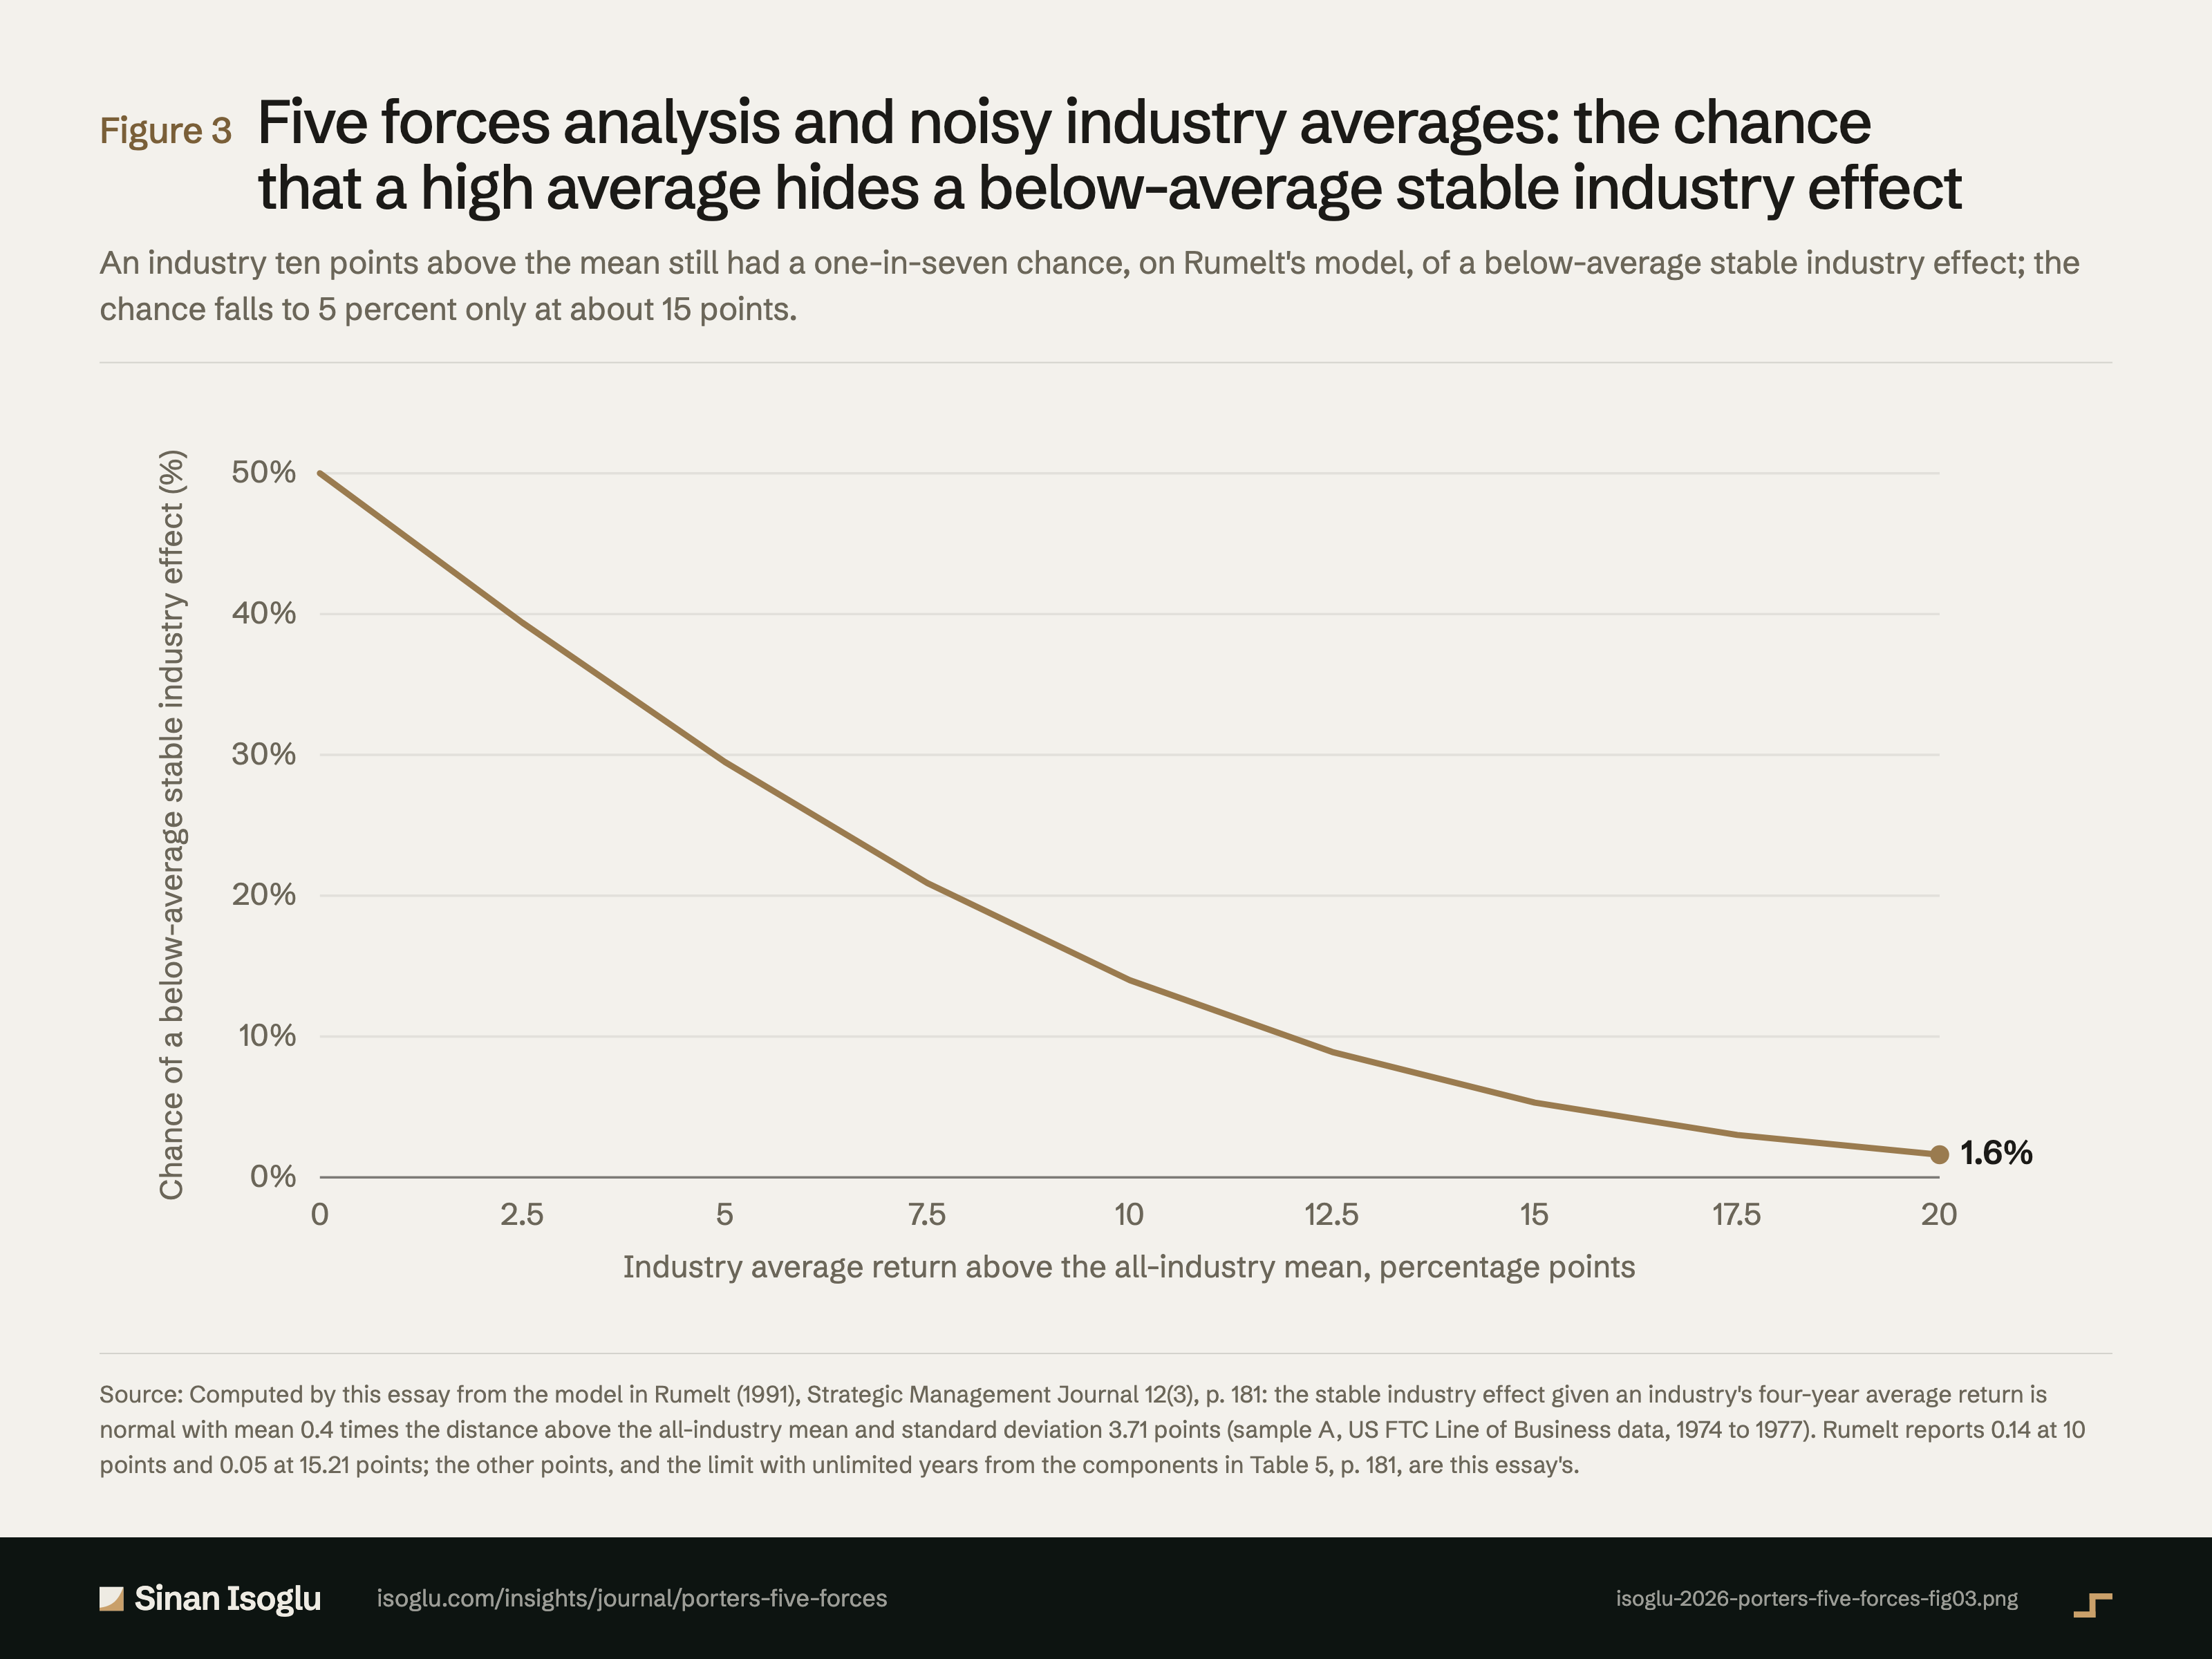
Abbildung 3Grafik
Five-Forces-Analyse und verrauschte Branchendurchschnitte: Wahrscheinlichkeit, dass ein hoher Durchschnitt einen unterdurchschnittlichen dauerhaften Brancheneffekt verdeckt
Porters Five Forces: warum die Firma mehr zählt als die Branche
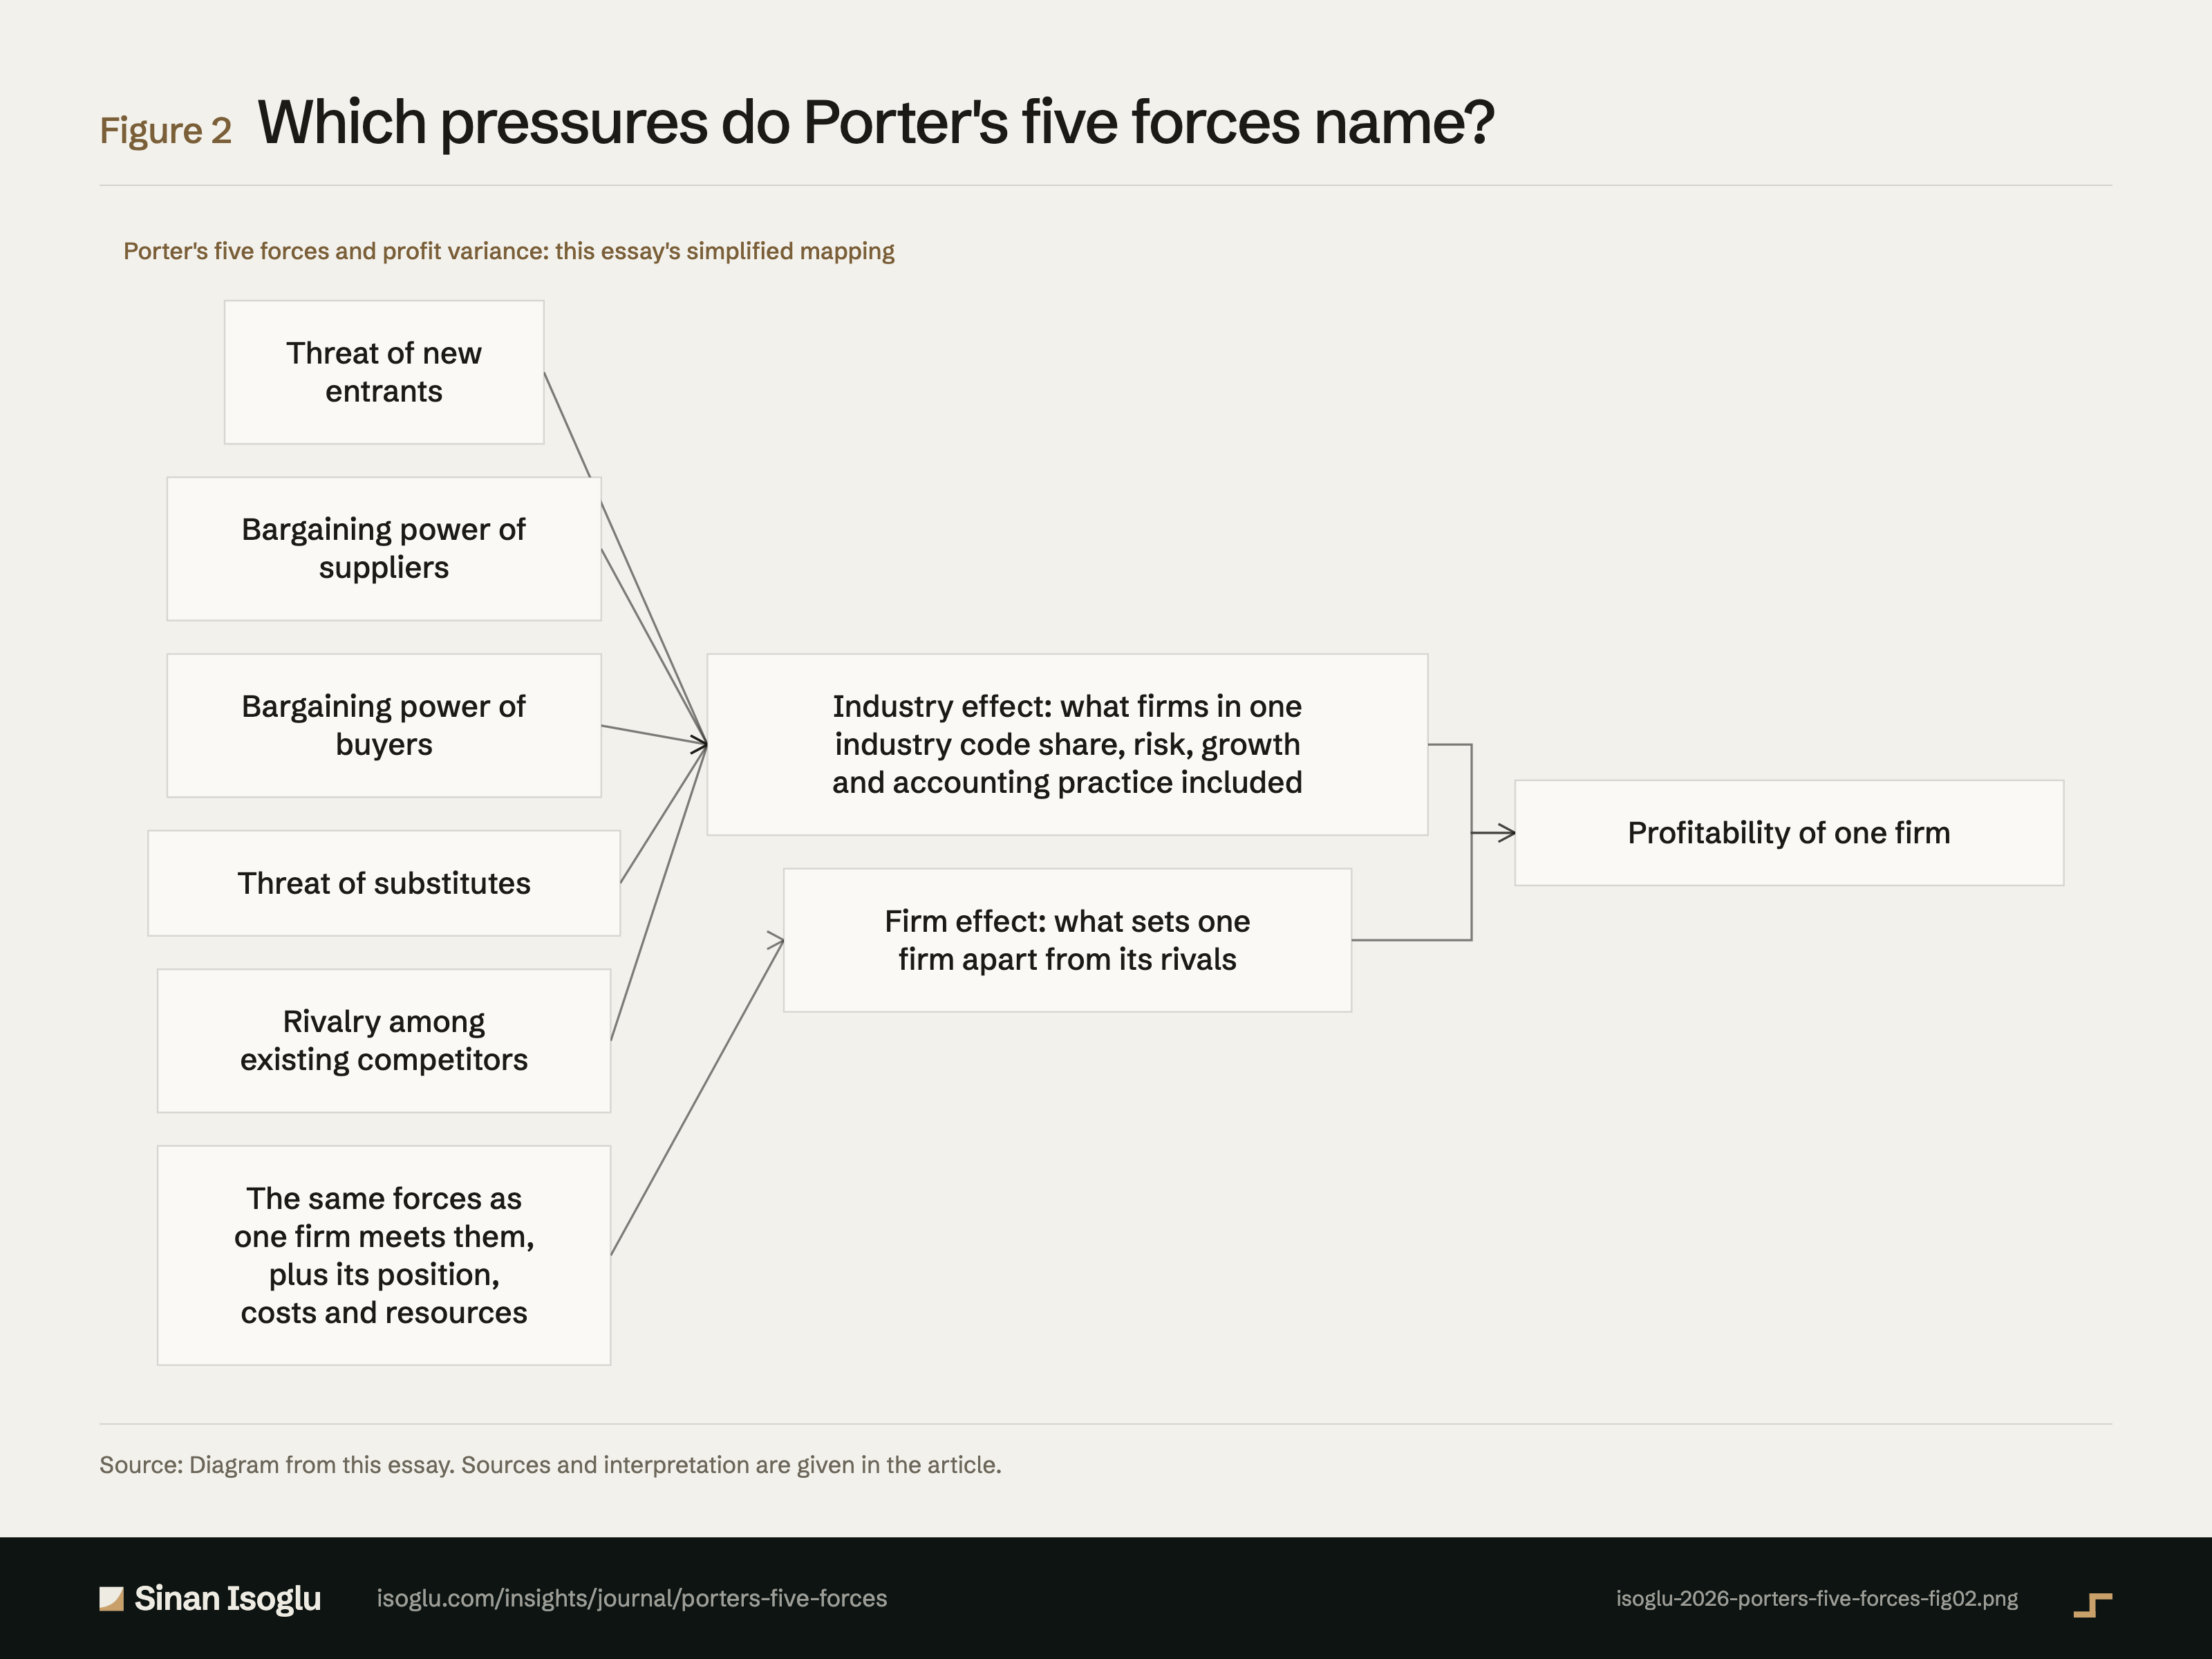
Abbildung 2Grafik
Welche Kräfte benennt das Five-Forces-Modell?
Porters Five Forces: warum die Firma mehr zählt als die Branche
Kontakt
Schicken Sie die Frage, an der Sie arbeiten.
Forschung, ein Gastvortrag oder eine Frage aus der Praxis.