Figure 4From “Porter's five forces: industry explains less than the firm does”
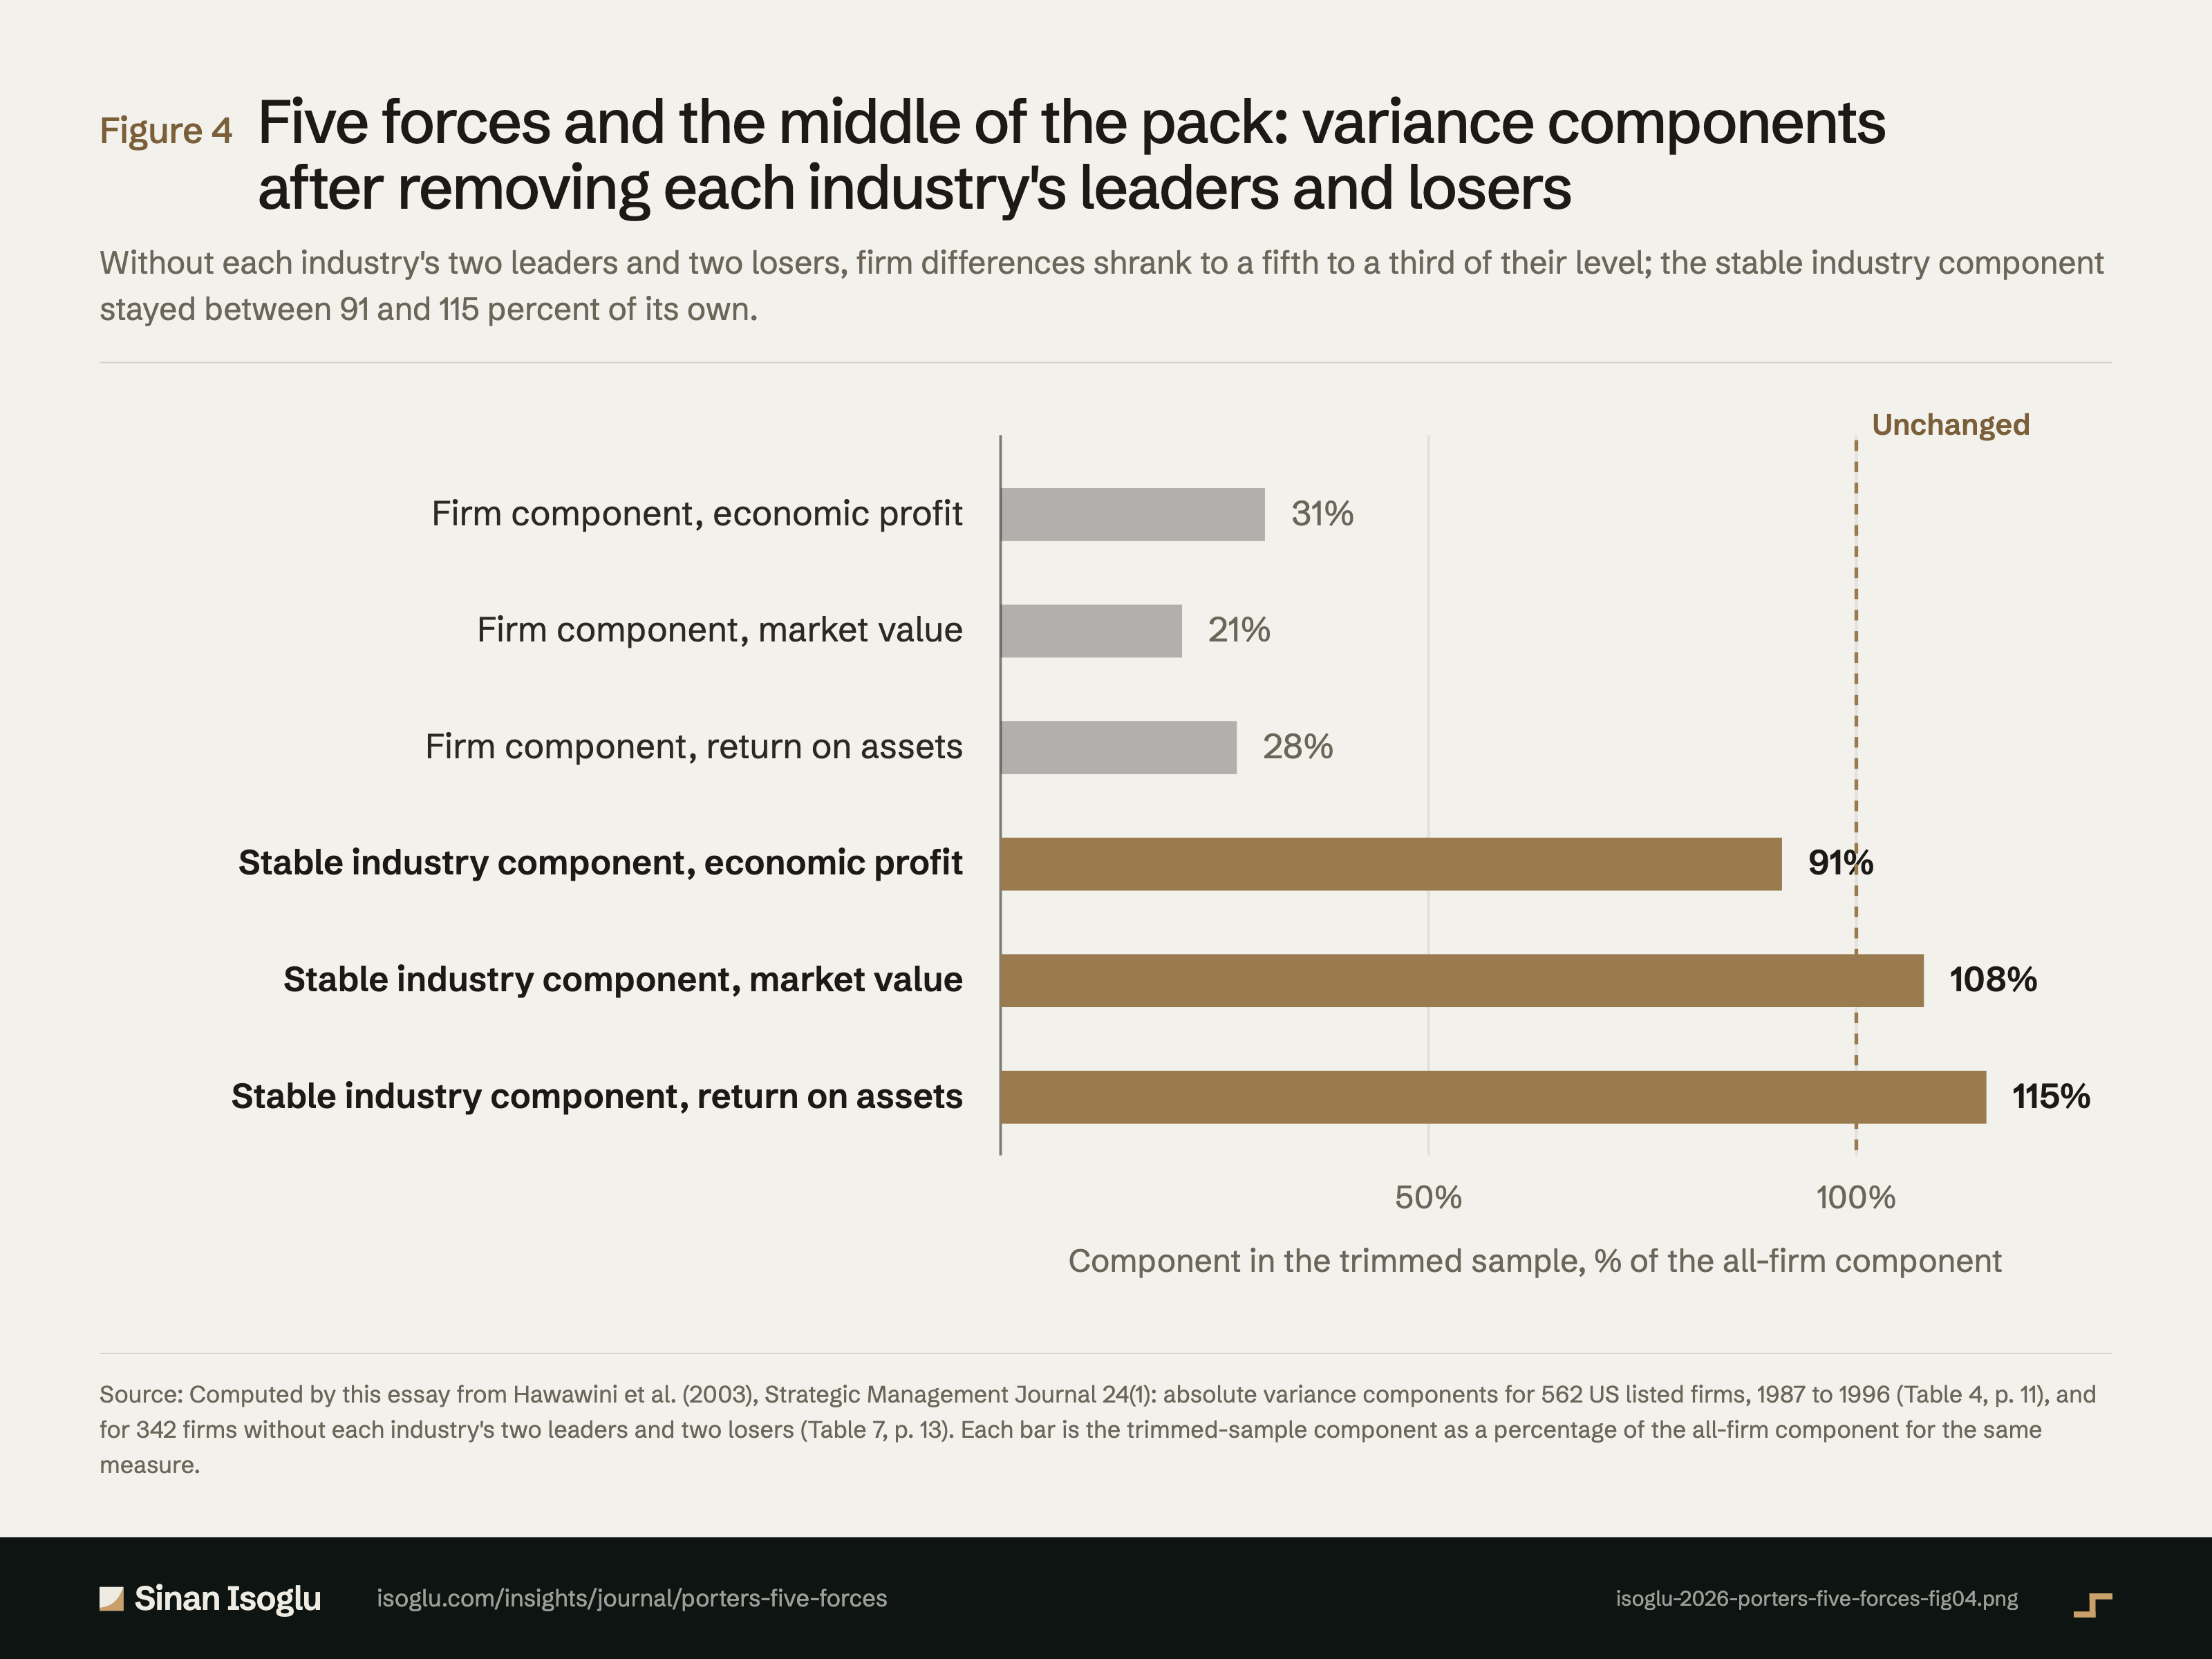
Five forces and the middle of the pack: variance components after removing each industry's leaders and losers
Without each industry's two leaders and two losers, firm differences shrank to a fifth to a third of their level; the stable industry component stayed between 91 and 115 percent of its own.
Figure 4Five forces and the middle of the pack: variance components after removing each industry's leaders and losers
Source: Computed by this essay from Hawawini et al. (2003), Strategic Management Journal 24(1): absolute variance components for 562 US listed firms, 1987 to 1996 (Table 4, p. 11), and for 342 firms without each industry's two leaders and two losers (Table 7, p. 13). Each bar is the trimmed-sample component as a percentage of the all-firm component for the same measure.
Source and evidence
Each line names a claim related to this exhibit, its source, and how it was checked.
- A A verified against the printed page of the primary sourceB primary source, text layer onlyC authoritative secondaryD reported Leaders and losers: a leader has the best result in its industry for the most years (ties by cumulative value), a loser the worst; the reduced sample drops each industry’s top two and bottom two by the measure used, leaving 342 firms and 3,420 observations (pp. 10, 11, 13): "a reduced sample that excludes the top two value leaders and bottom two value losers in the industry"; "The reduced sample contains 3420 observations for 342 firms across the 55 industry classifications"; "a firm’s performance must be the highest in its industry for the maximum number of years over the sample period"; "excludes each industry’s top two leaders and bottom two losers according to the performance measure used"Hawawini, Subramanian and Verdin (2003)
- A A verified against the printed page of the primary sourceB primary source, text layer onlyC authoritative secondaryD reported Absolute components, Tables 4 and 7: the firm component falls on all three measures while the industry component rises for ROA and TMV/CE and stays about the same for EP/CE; a few firms dominate intra-industry variance and firm effects (pp. 11 to 13): "In terms of variance component estimates, the firm factor contributes less across all three measures of performance, while industry factors increase for ROA and TMV/CE, and remain almost the same for EP/CE"; "only a few firms that capture or destroy a large part of industry’s value dominate intra-industry variance and firm effects"Hawawini, Subramanian and Verdin (2003)
- B A verified against the printed page of the primary sourceB primary source, text layer onlyC authoritative secondaryD reported Figure 4 arithmetic from Hawawini Tables 4 and 7: firm 0.000820/0.002650 = 30.9%, 0.232559/1.095386 = 21.2%, 5.697587/20.643661 = 27.6%; stable industry 0.000578/0.000633 = 91.3%, 0.412727/0.382606 = 107.9%, 5.413565/4.700882 = 115.2%; the stable-only comparison from Table 8 (G5 F1); what collapsed was the firm component, the industry component changed little and rose on two measures as the authors note (G5 F7); trimming by the outcome narrows dispersion by constructionAuthor computation
From the essay
Go-to-market strategy
Porter's five forces: industry explains less than the firm does
Porter's five forces map pressures on industry profits. In three studies, firms differ more than industries do; in the middle of the pack the gap closes.
Read the essayThis exhibit belongs to an essay: the numbers live here, the argument lives there.
Cite or embed
Related exhibits
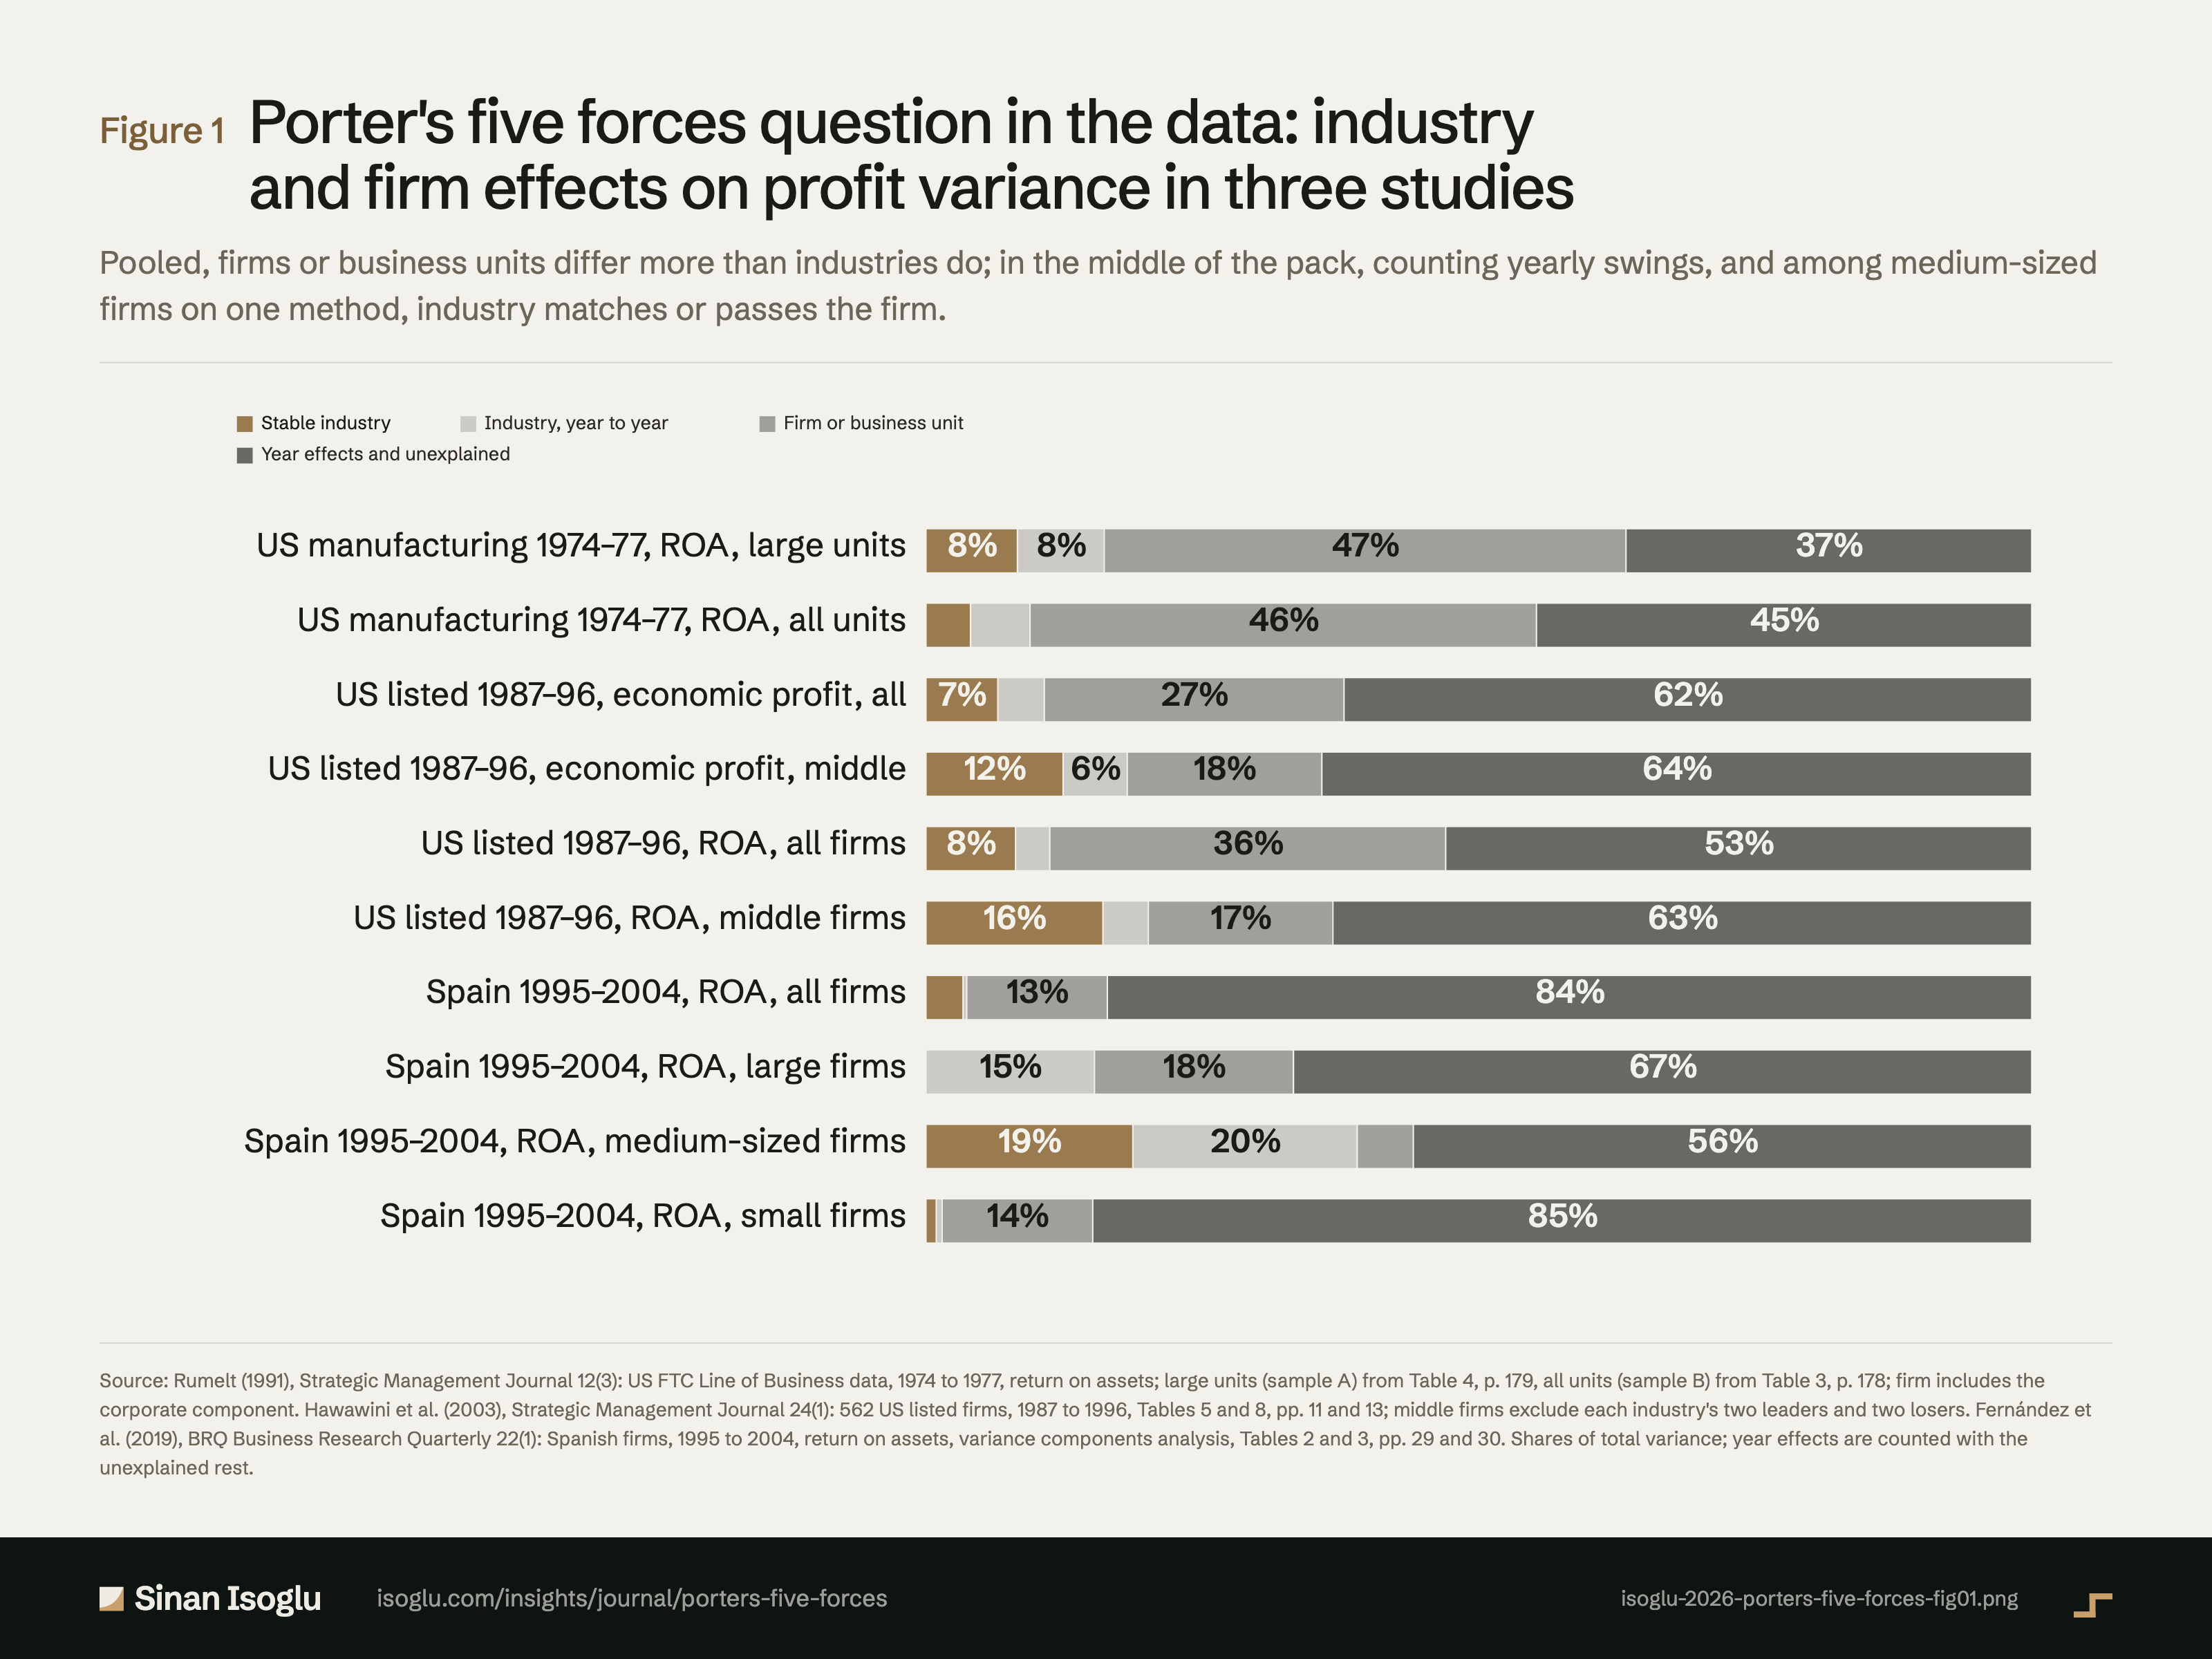
Figure 1Figure
Porter's five forces question in the data: industry and firm effects on profit variance in three studies
Porter's five forces: industry explains less than the firm does
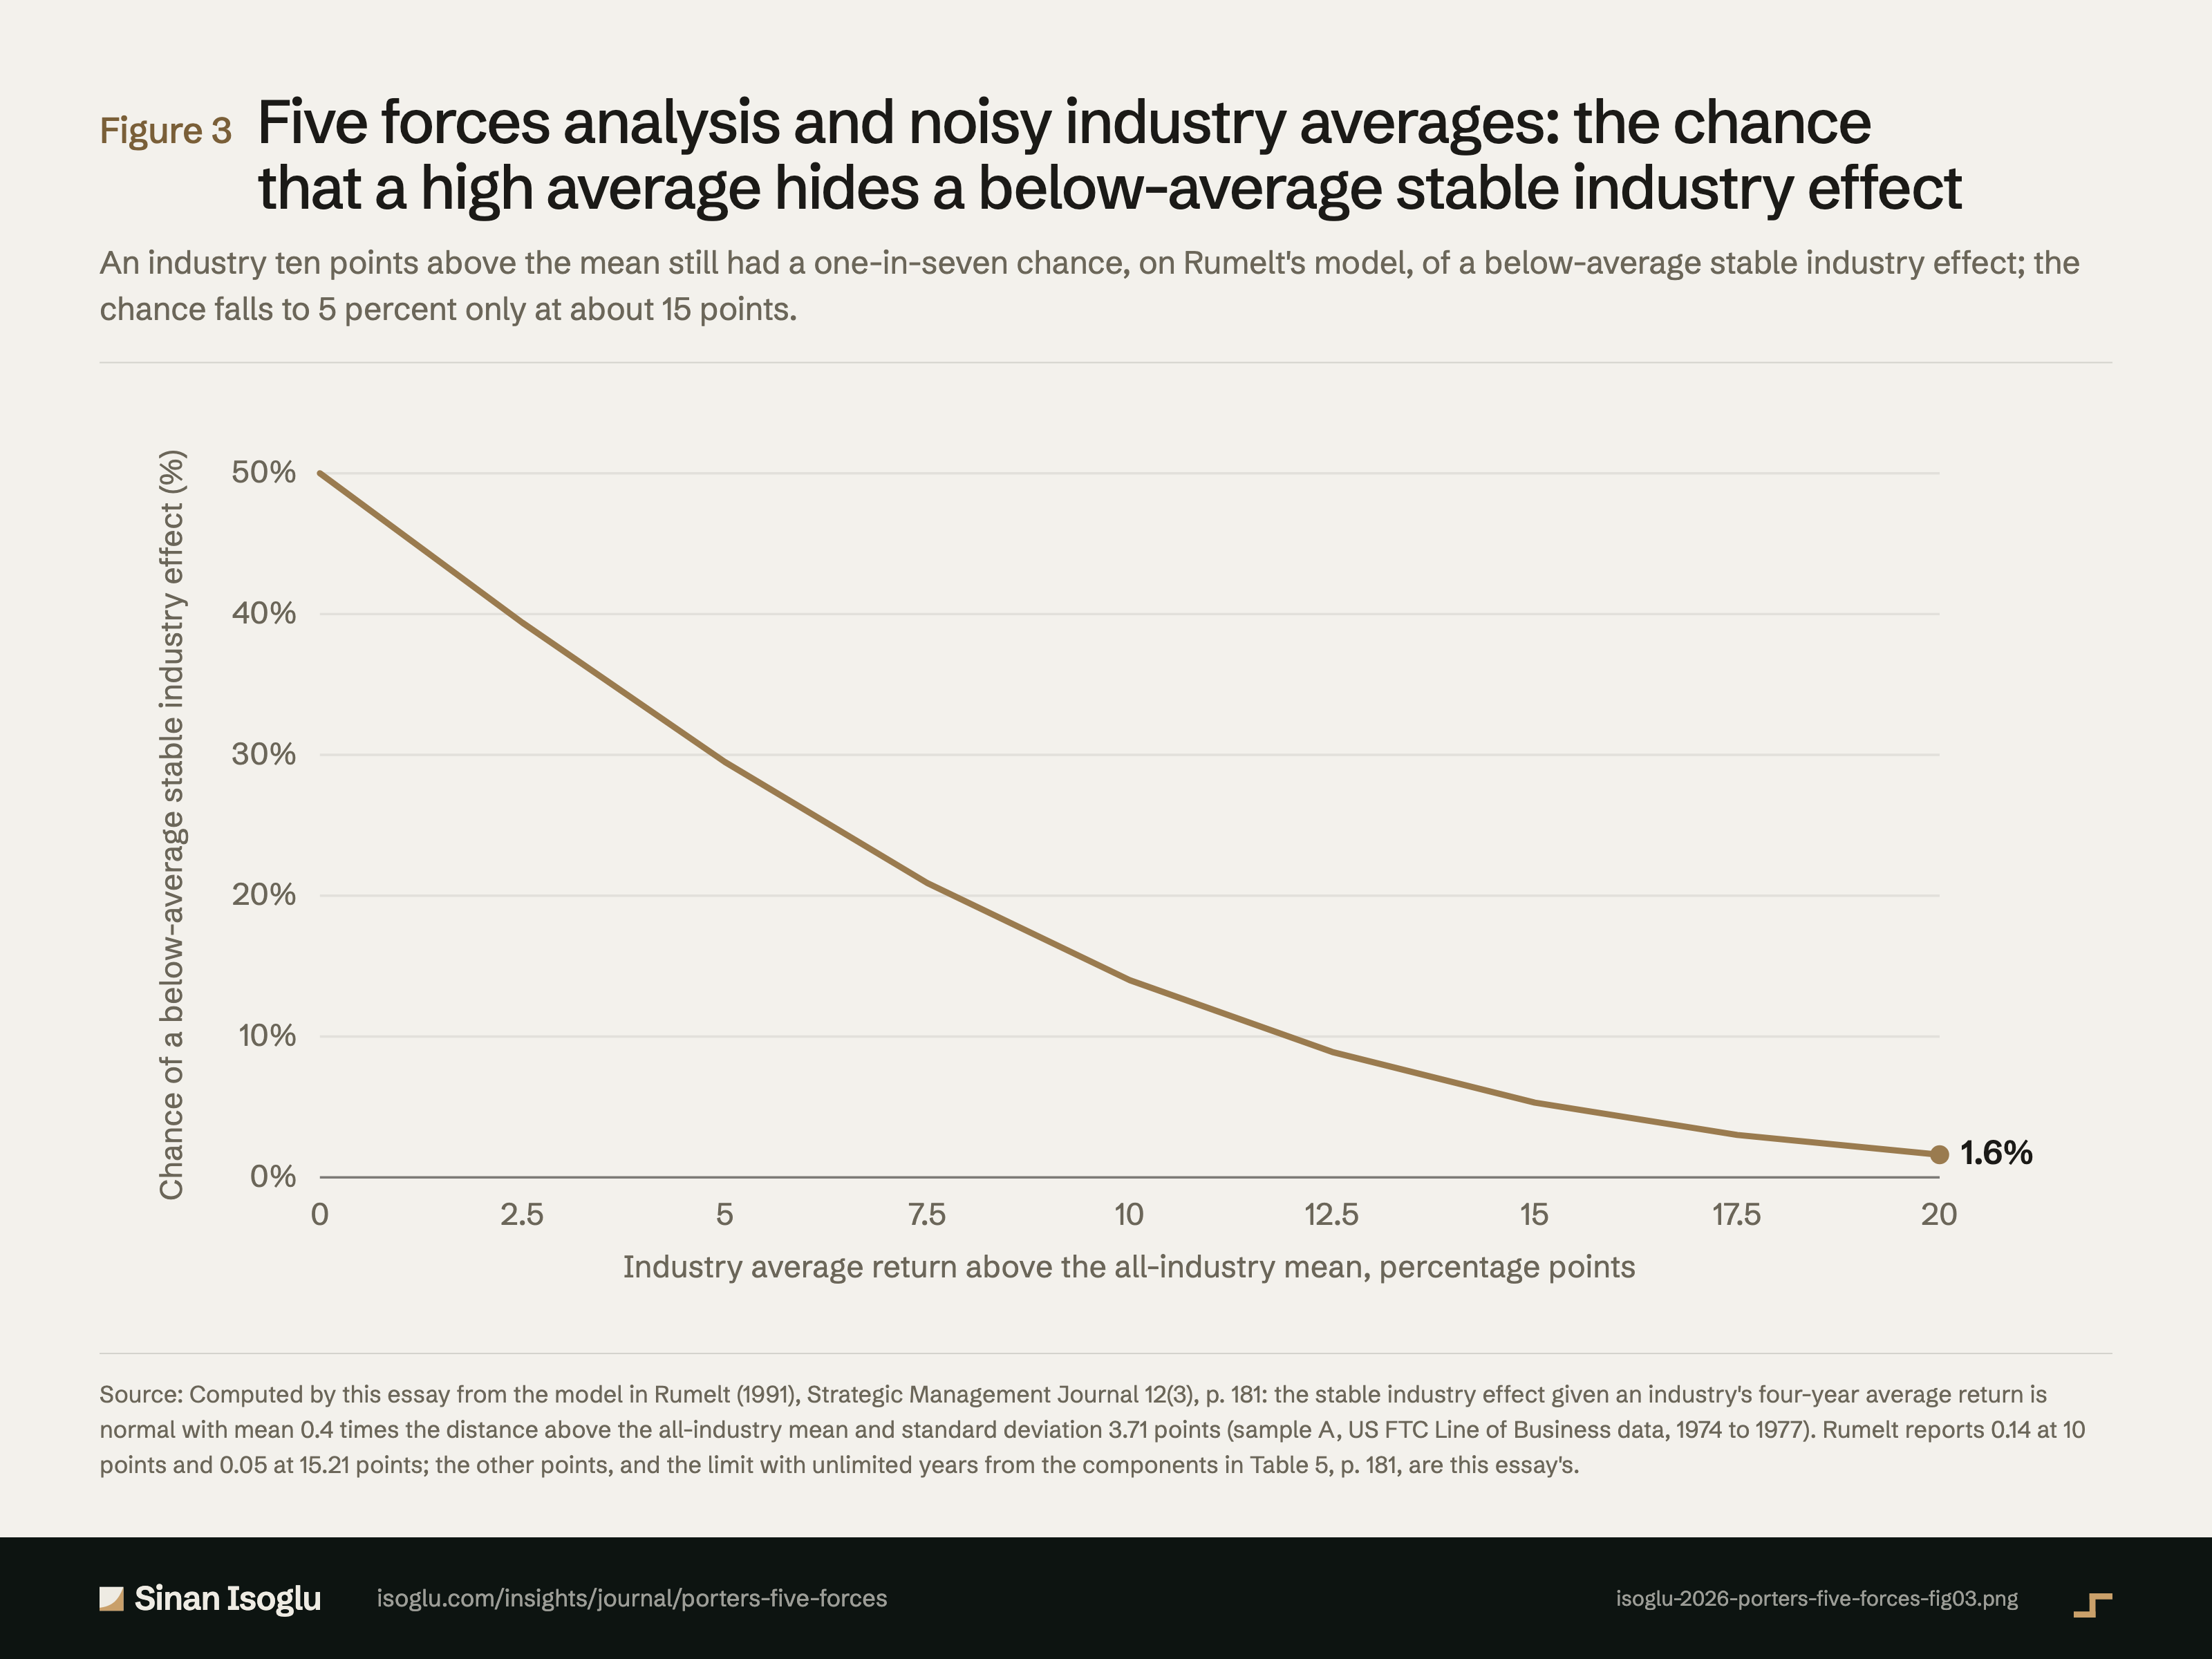
Figure 3Figure
Five forces analysis and noisy industry averages: the chance that a high average hides a below-average stable industry effect
Porter's five forces: industry explains less than the firm does
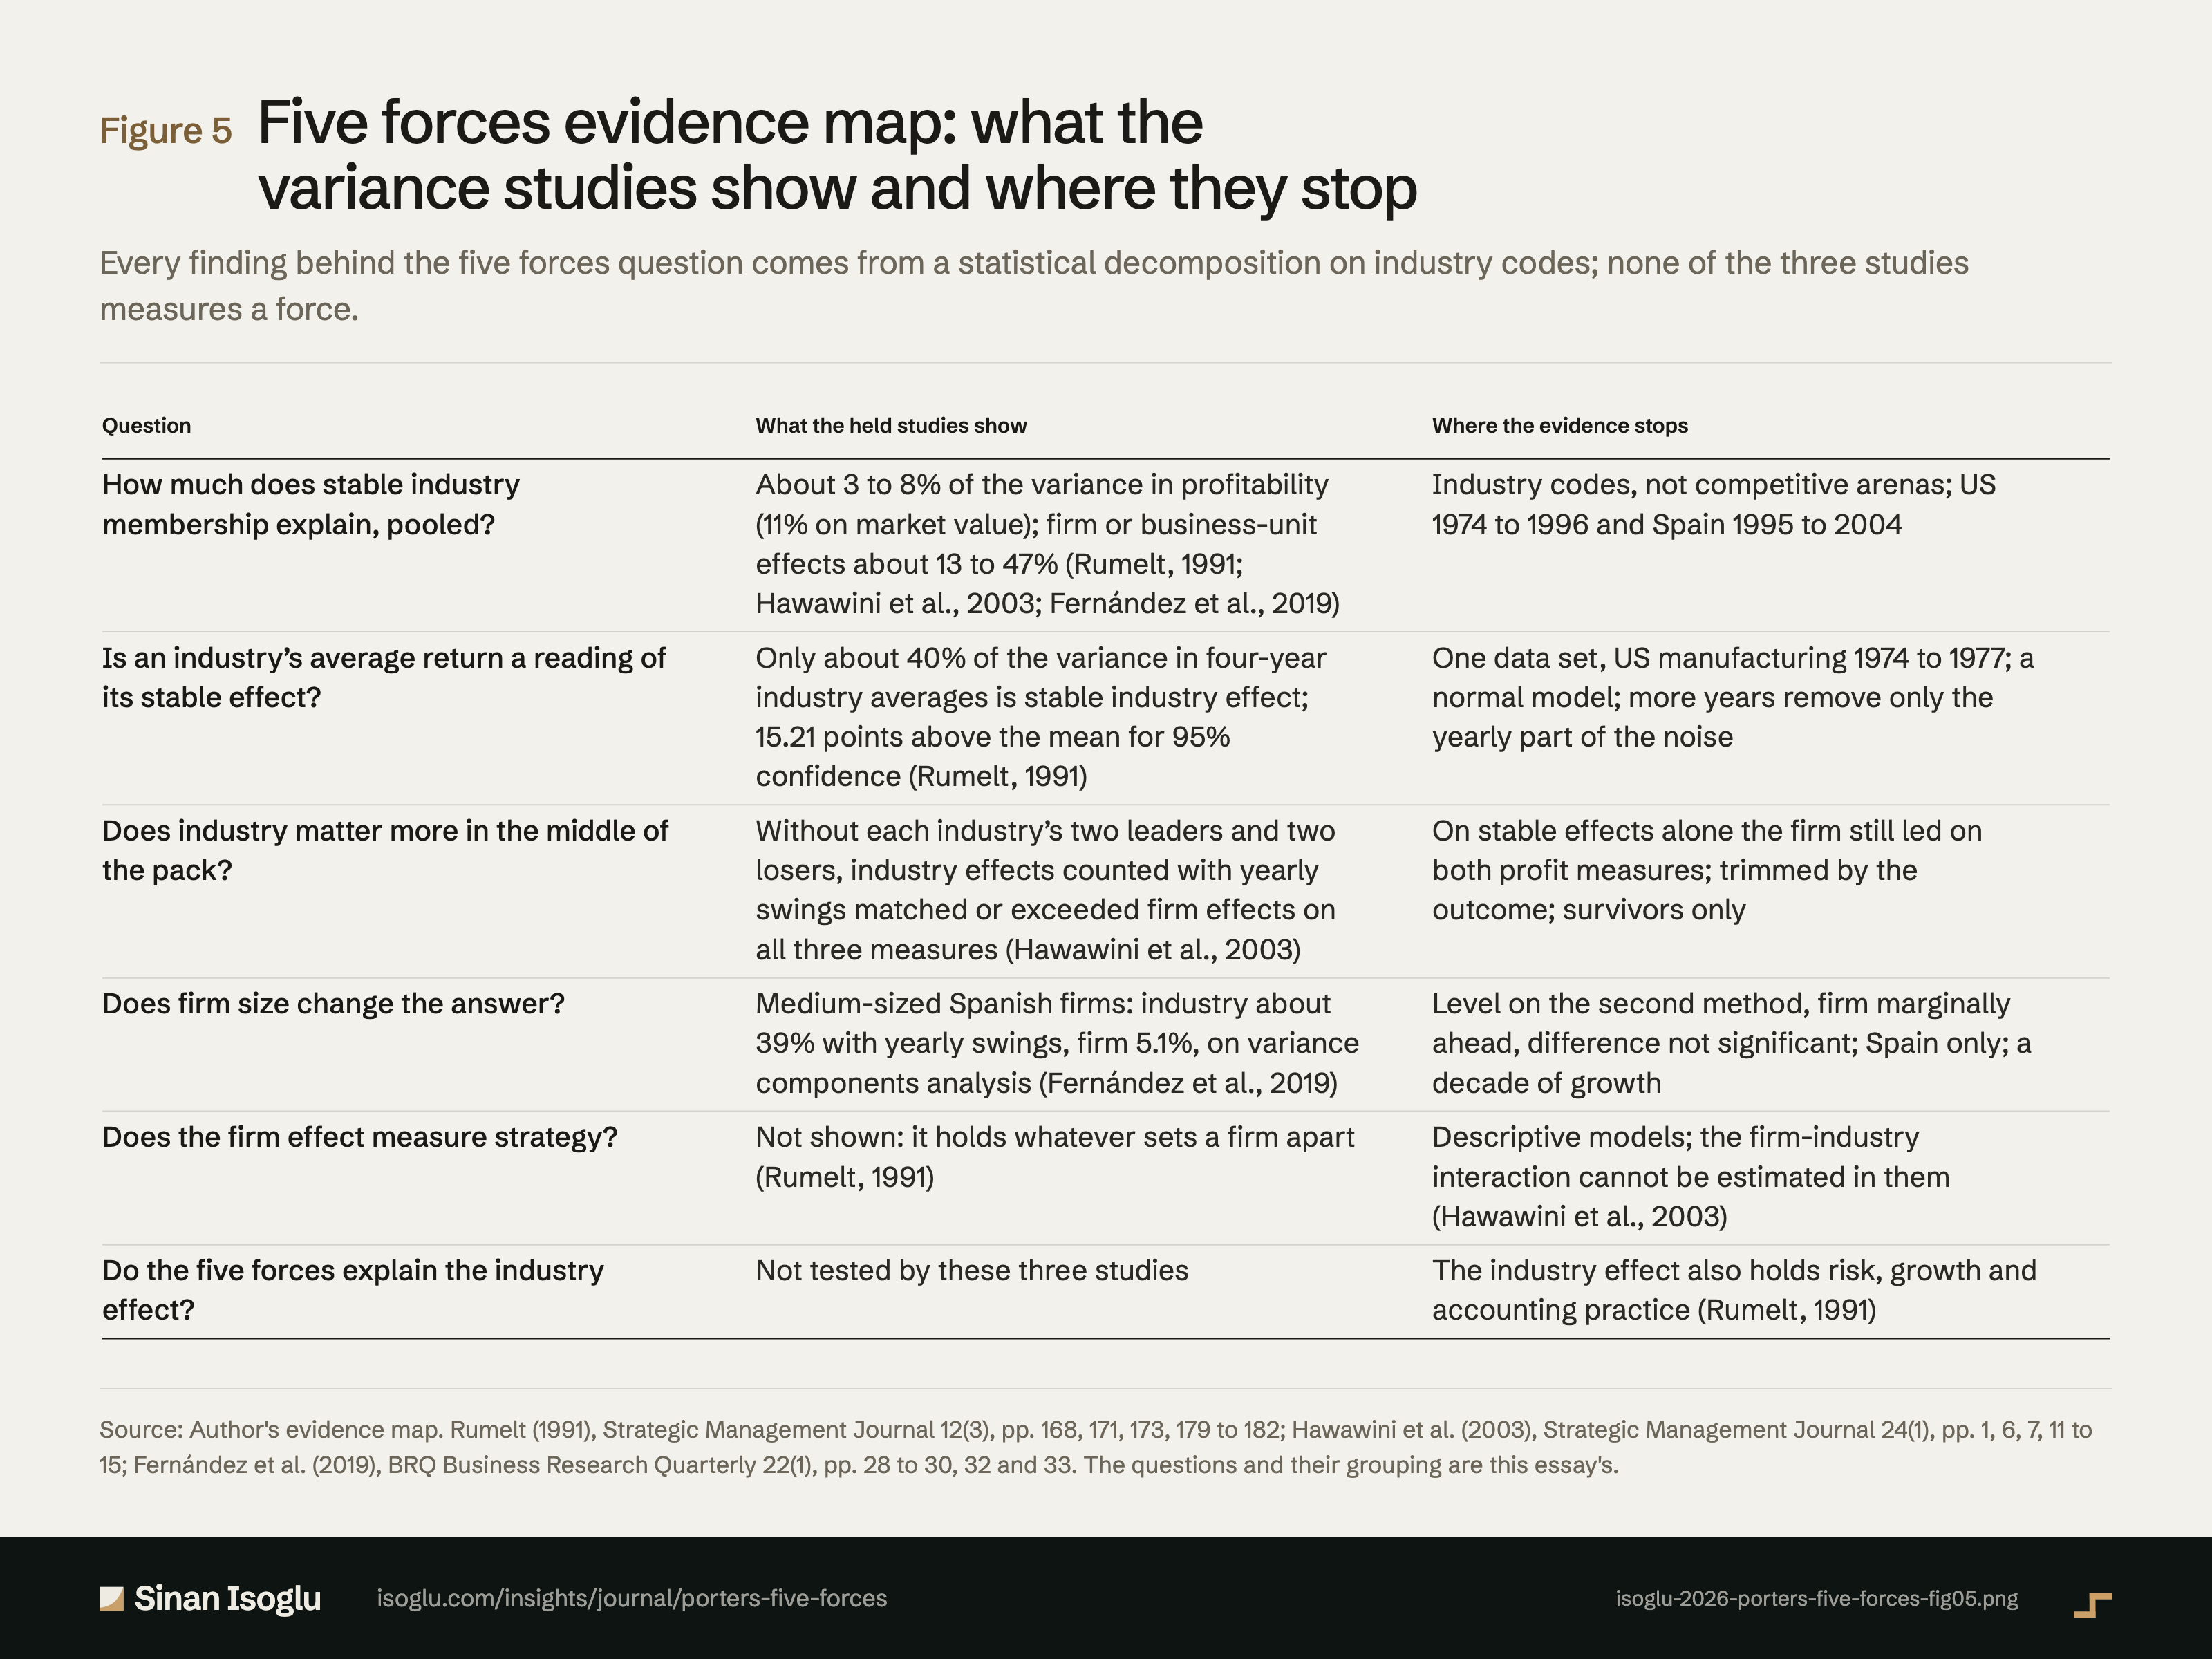
Figure 5Figure
Five forces evidence map: what the variance studies show and where they stop
Porter's five forces: industry explains less than the firm does
Contact
Bring the question you're working on.
Research, a guest lecture, or a commercial question.