Abbildung 3Aus „Porters Five Forces: warum die Firma mehr zählt als die Branche“
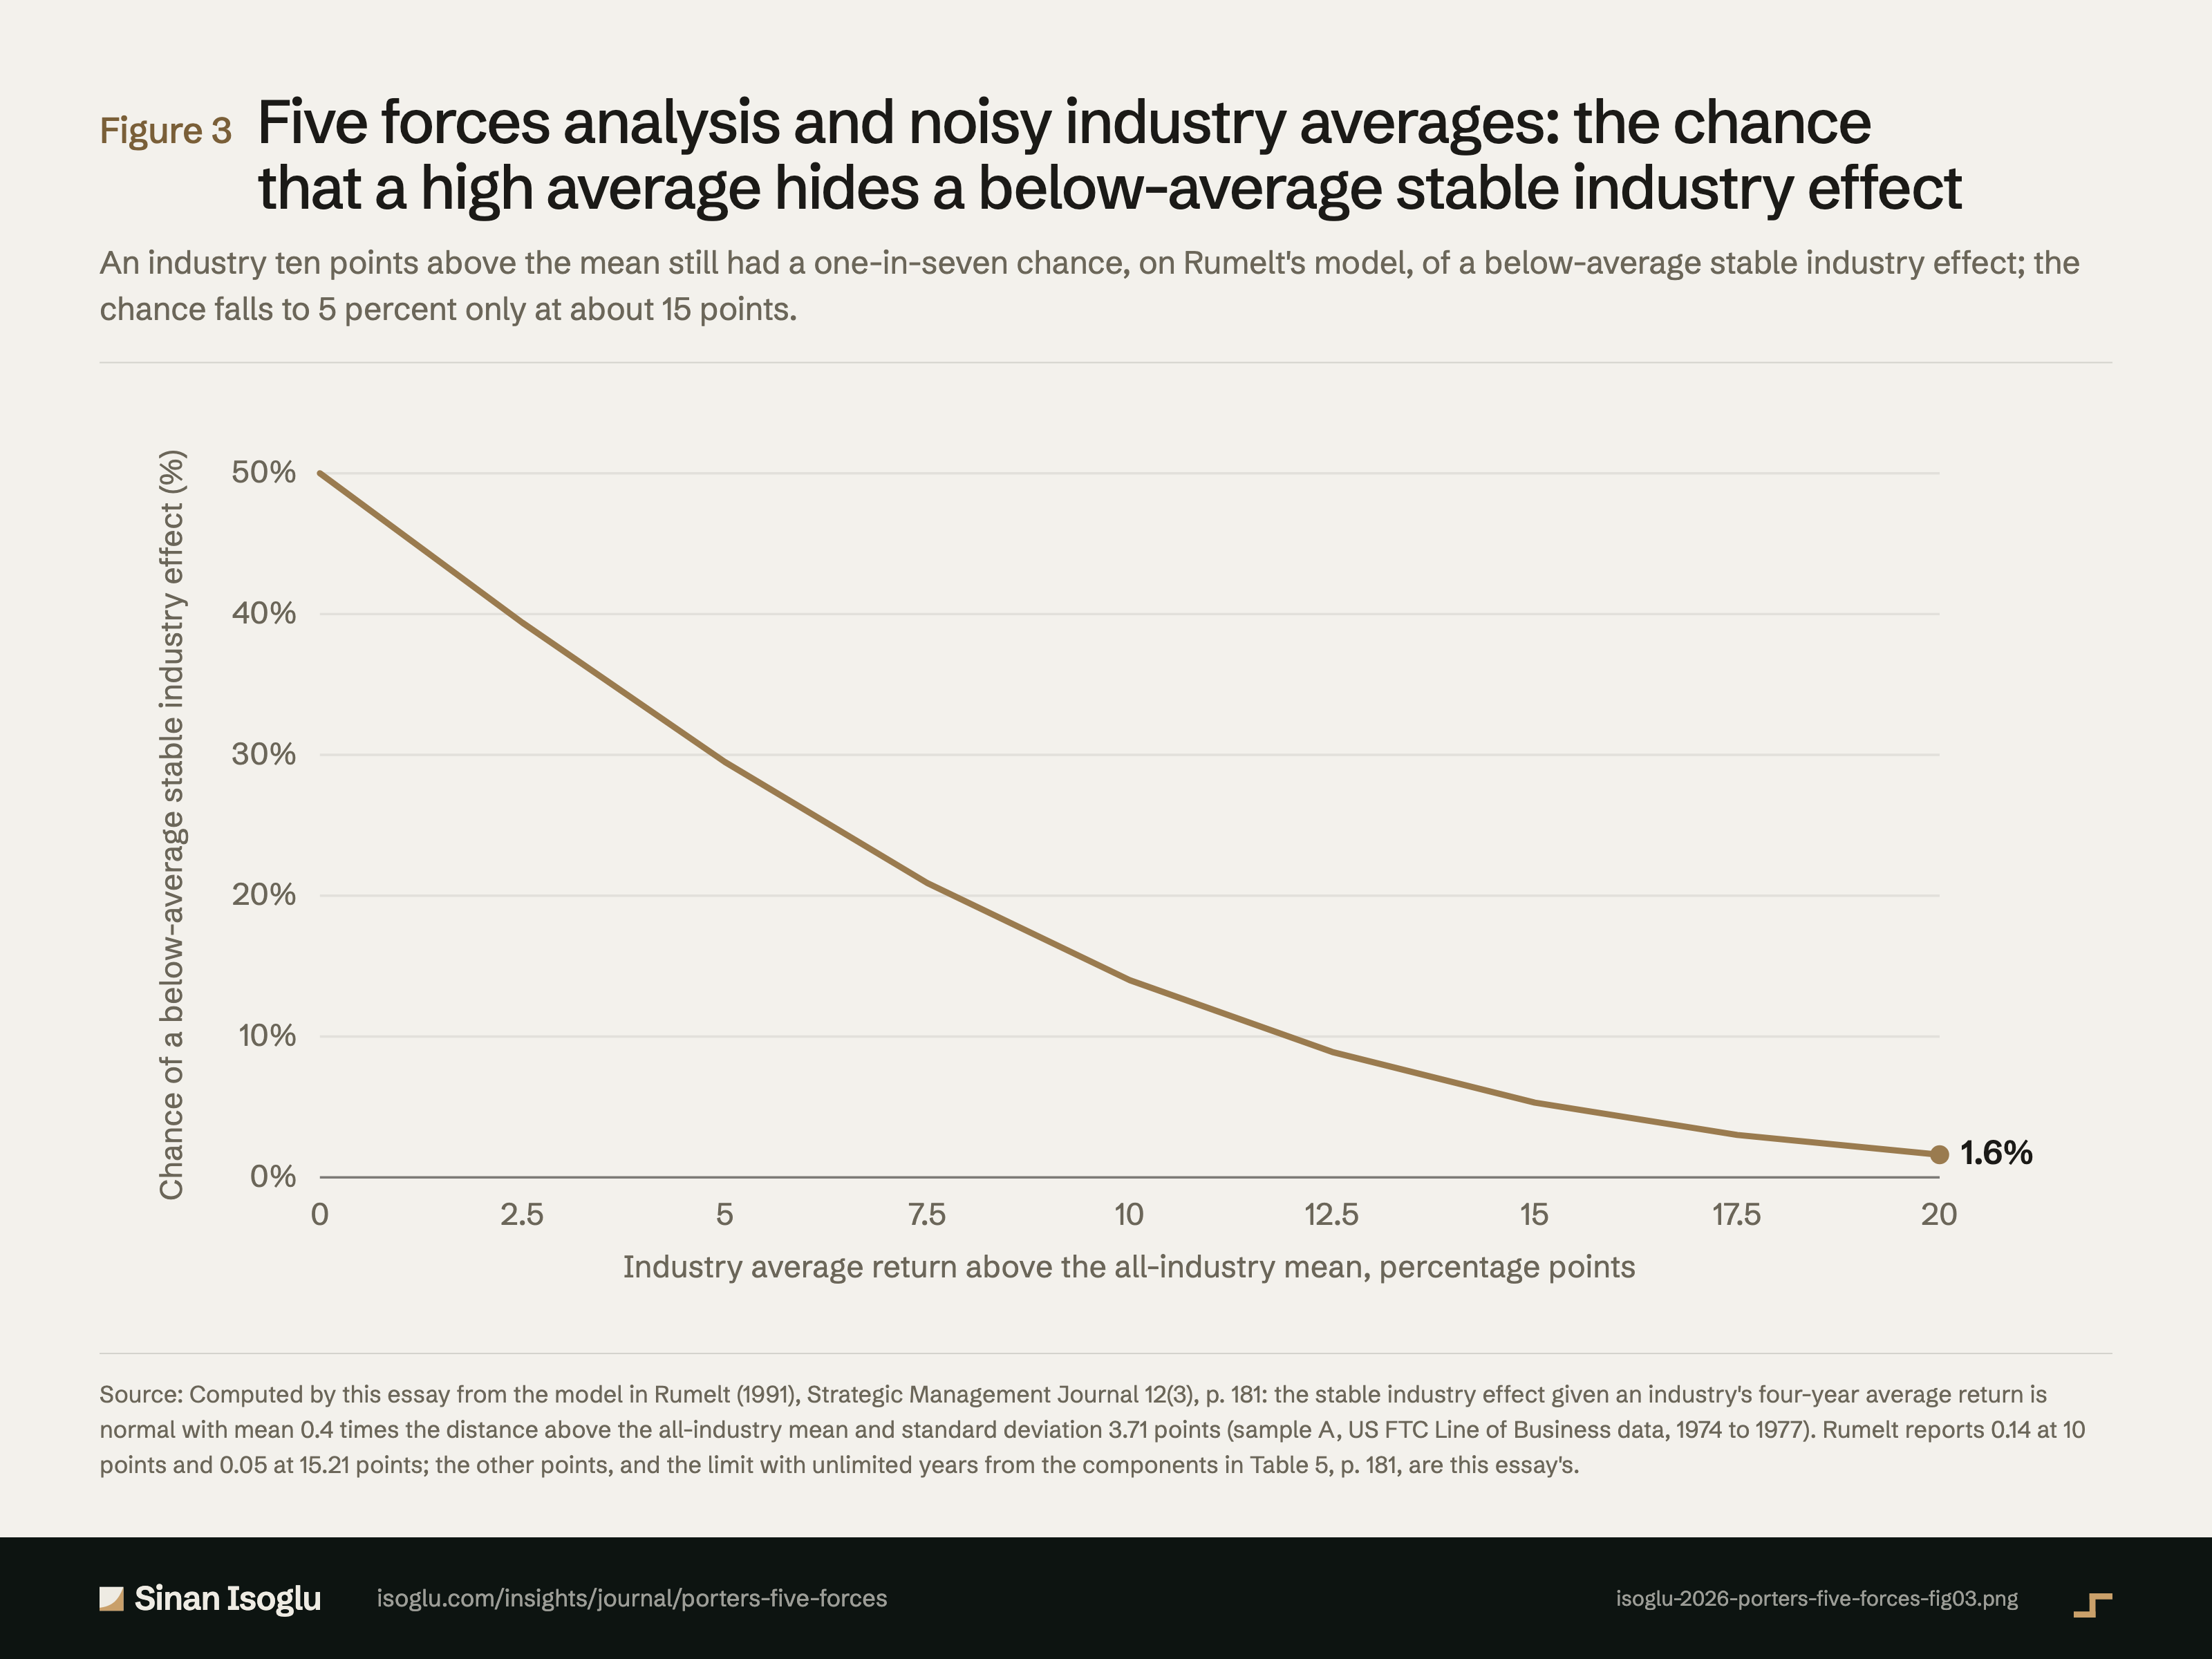
Five-Forces-Analyse und verrauschte Branchendurchschnitte: Wahrscheinlichkeit, dass ein hoher Durchschnitt einen unterdurchschnittlichen dauerhaften Brancheneffekt verdeckt
Eine Branche zehn Punkte über dem Mittel hatte nach dem Modell von Rumelt noch eine Wahrscheinlichkeit von etwa einem Siebtel (14 Prozent) für einen unterdurchschnittlichen dauerhaften Brancheneffekt; auf 5 Prozent sinkt sie erst bei etwa 15 Punkten.
Abbildung 3Five-Forces-Analyse und verrauschte Branchendurchschnitte: Wahrscheinlichkeit, dass ein hoher Durchschnitt einen unterdurchschnittlichen dauerhaften Brancheneffekt verdeckt
Quelle: Eigene Berechnung nach dem Modell in Rumelt (1991), Strategic Management Journal 12(3), S. 181: Der dauerhafte Brancheneffekt ist bei gegebener Vierjahres-Durchschnittsrendite einer Branche normalverteilt, mit dem 0,4-Fachen des Abstands zum Mittel aller Branchen als Mittelwert und einer Standardabweichung von 3,71 Punkten (Stichprobe A, FTC-Line-of-Business-Daten, 1974 bis 1977). Rumelt nennt 0,14 bei 10 Punkten und 0,05 bei 15,21 Punkten; die übrigen Punkte und der Grenzwert bei beliebig vielen Jahren aus den Komponenten in Tabelle 5, S. 181, sind eigene Berechnungen.
Quelle und Evidenz
Jede Zeile nennt eine Aussage zu dieser Abbildung, ihre Quelle und die Art ihrer Prüfung.
- A A gegen die gedruckte Seite der Primärquelle geprüftB Primärquelle, nur TextebeneC belastbare SekundärquelleD berichtet Industry averages are noisy: about 40 percent of the variance among four-year industry average returns is stable industry effect, about another 40 percent business-unit effects that randomly combine in industry averages, the remaining fifth (sample A) industry-year and business-unit-year fluctuations, the only part more years would shrink (Table 5); conditional model with mean 0.4 times the distance above the mean and standard deviation 3.71 (p. 181, read on the page image); at 10 points the estimate is 1.08 standard deviations above zero, probability 0.14 that the effect is negative; 15.21 points needed for 95 percent confidence; on the normal approximation about one in forty, some six of 242 industries, would pass, an expectation, not a tally (pp. 168, 180 to 182): "only about 40 percent of the variance among industry returns is actually due to stable industry effects"; "industry returns are noisy estimates of the true industry effects"; "this estimate is only 1.08 standard deviations above zero"; "the observed industry average must be at least 15.21 percentage points above the mean"; "could be judged (95 percent confidence) to have positive industry effects"; "This portion would be smaller had the averages been taken over more than 4 years"; "Fewer than one in forty industry returns are high enough to pass this test"; "effects which randomly combine to affect industry averages"; "The remaining variance (one-fifth in sample A, one-eighth in sample B) is due to various industry-year and business-unit-year fluctuations"Rumelt (1991)
- B A gegen die gedruckte Seite der Primärquelle geprüftB Primärquelle, nur TextebeneC belastbare SekundärquelleD berichtet Figure 3 curve: P(stable effect below average, given d) = Φ(−0.4 d / 3.71), from Rumelt’s p. 181 model; values 50.0, 39.4, 29.5, 20.9, 14.0, 8.9, 5.3, 3.0, 1.6 percent at 0 to 20 points in steps of 2.5; checks against Rumelt’s 0.14 at 10 and 0.05 at 15.21; with unlimited years only the industry (23.3) and business-unit (25.3) components of Table 5 remain, ζ = 0.479, σ = 3.48, so about 8.4 percent at 10 points (G5 N14); the strategy-deck implication is the author’sAuthor computation
Aus dem Beitrag
Go-to-Market-Strategie
Porters Five Forces: warum die Firma mehr zählt als die Branche
Die Five Forces nach Porter erfassen den Druck auf Branchengewinne. In drei Studien unterscheiden sich Firmen stärker als Branchen, im Mittelfeld kaum.
Den Beitrag lesenDiese Abbildung gehört zu einem Essay: Die Zahlen stehen hier, das Argument dort.
Zitieren oder einbetten
Verwandte Abbildungen
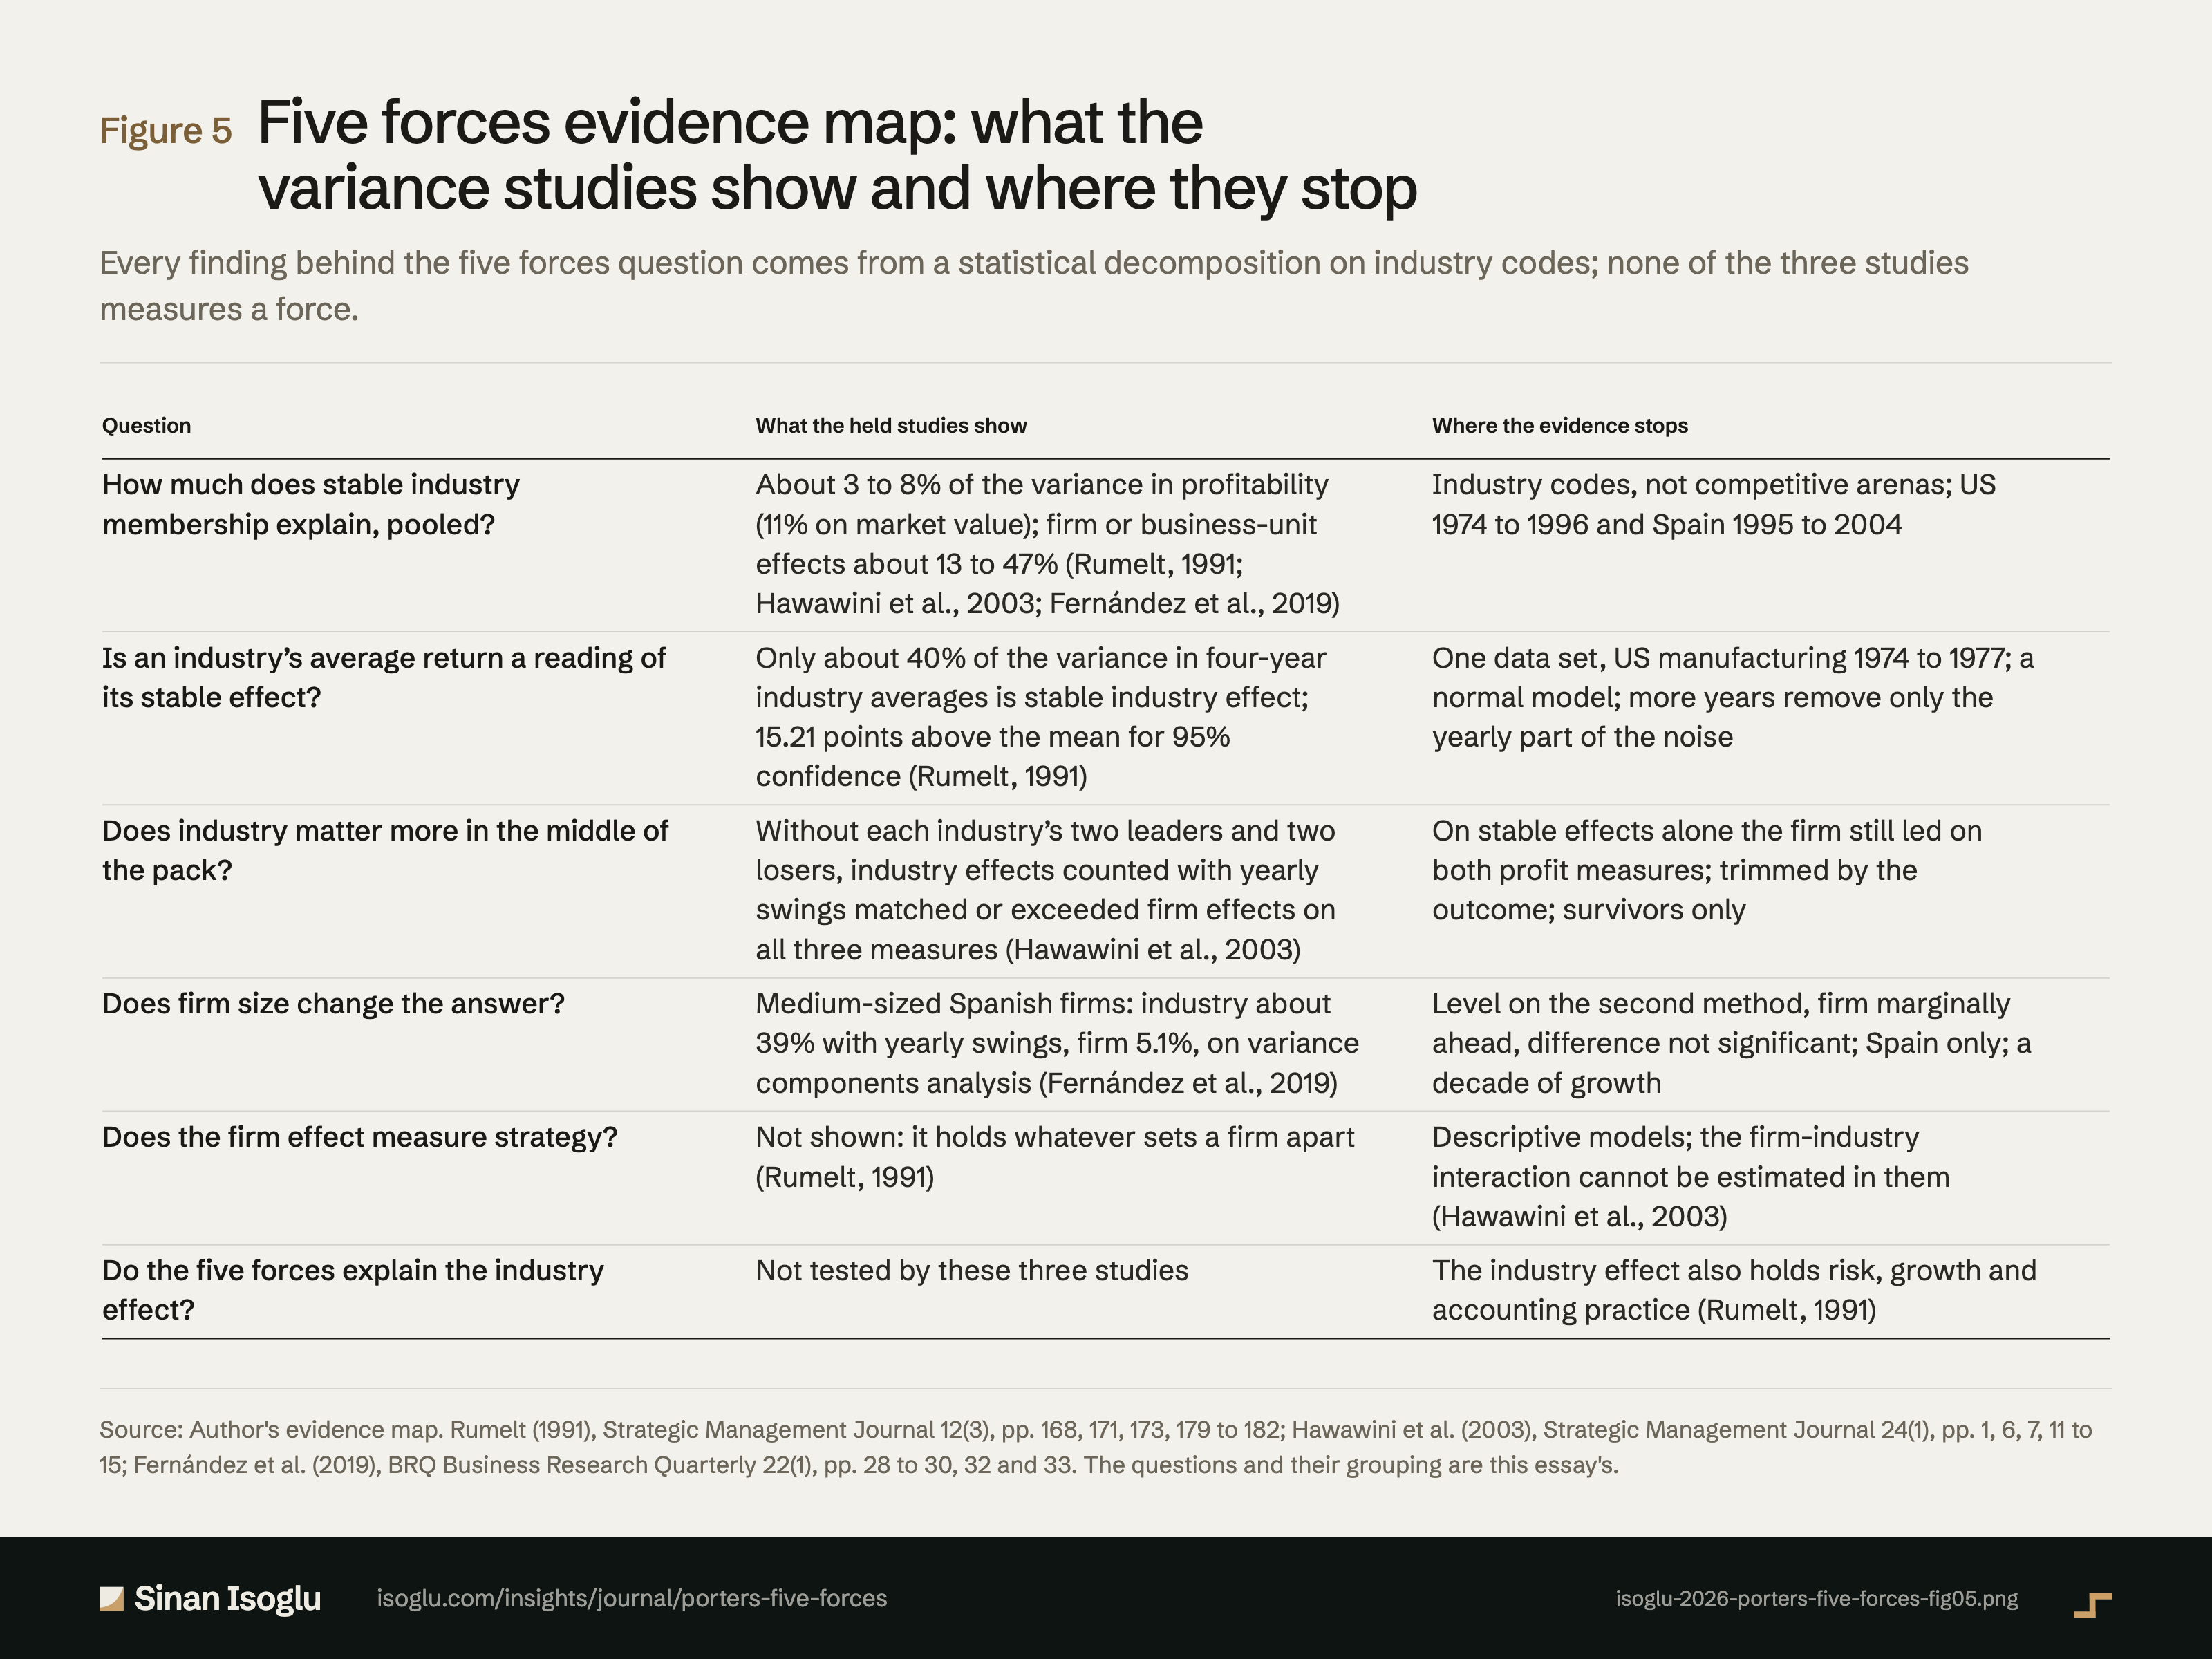
Abbildung 5Grafik
Five-Forces-Evidenzkarte: was die Varianzstudien zeigen und wo sie enden
Porters Five Forces: warum die Firma mehr zählt als die Branche
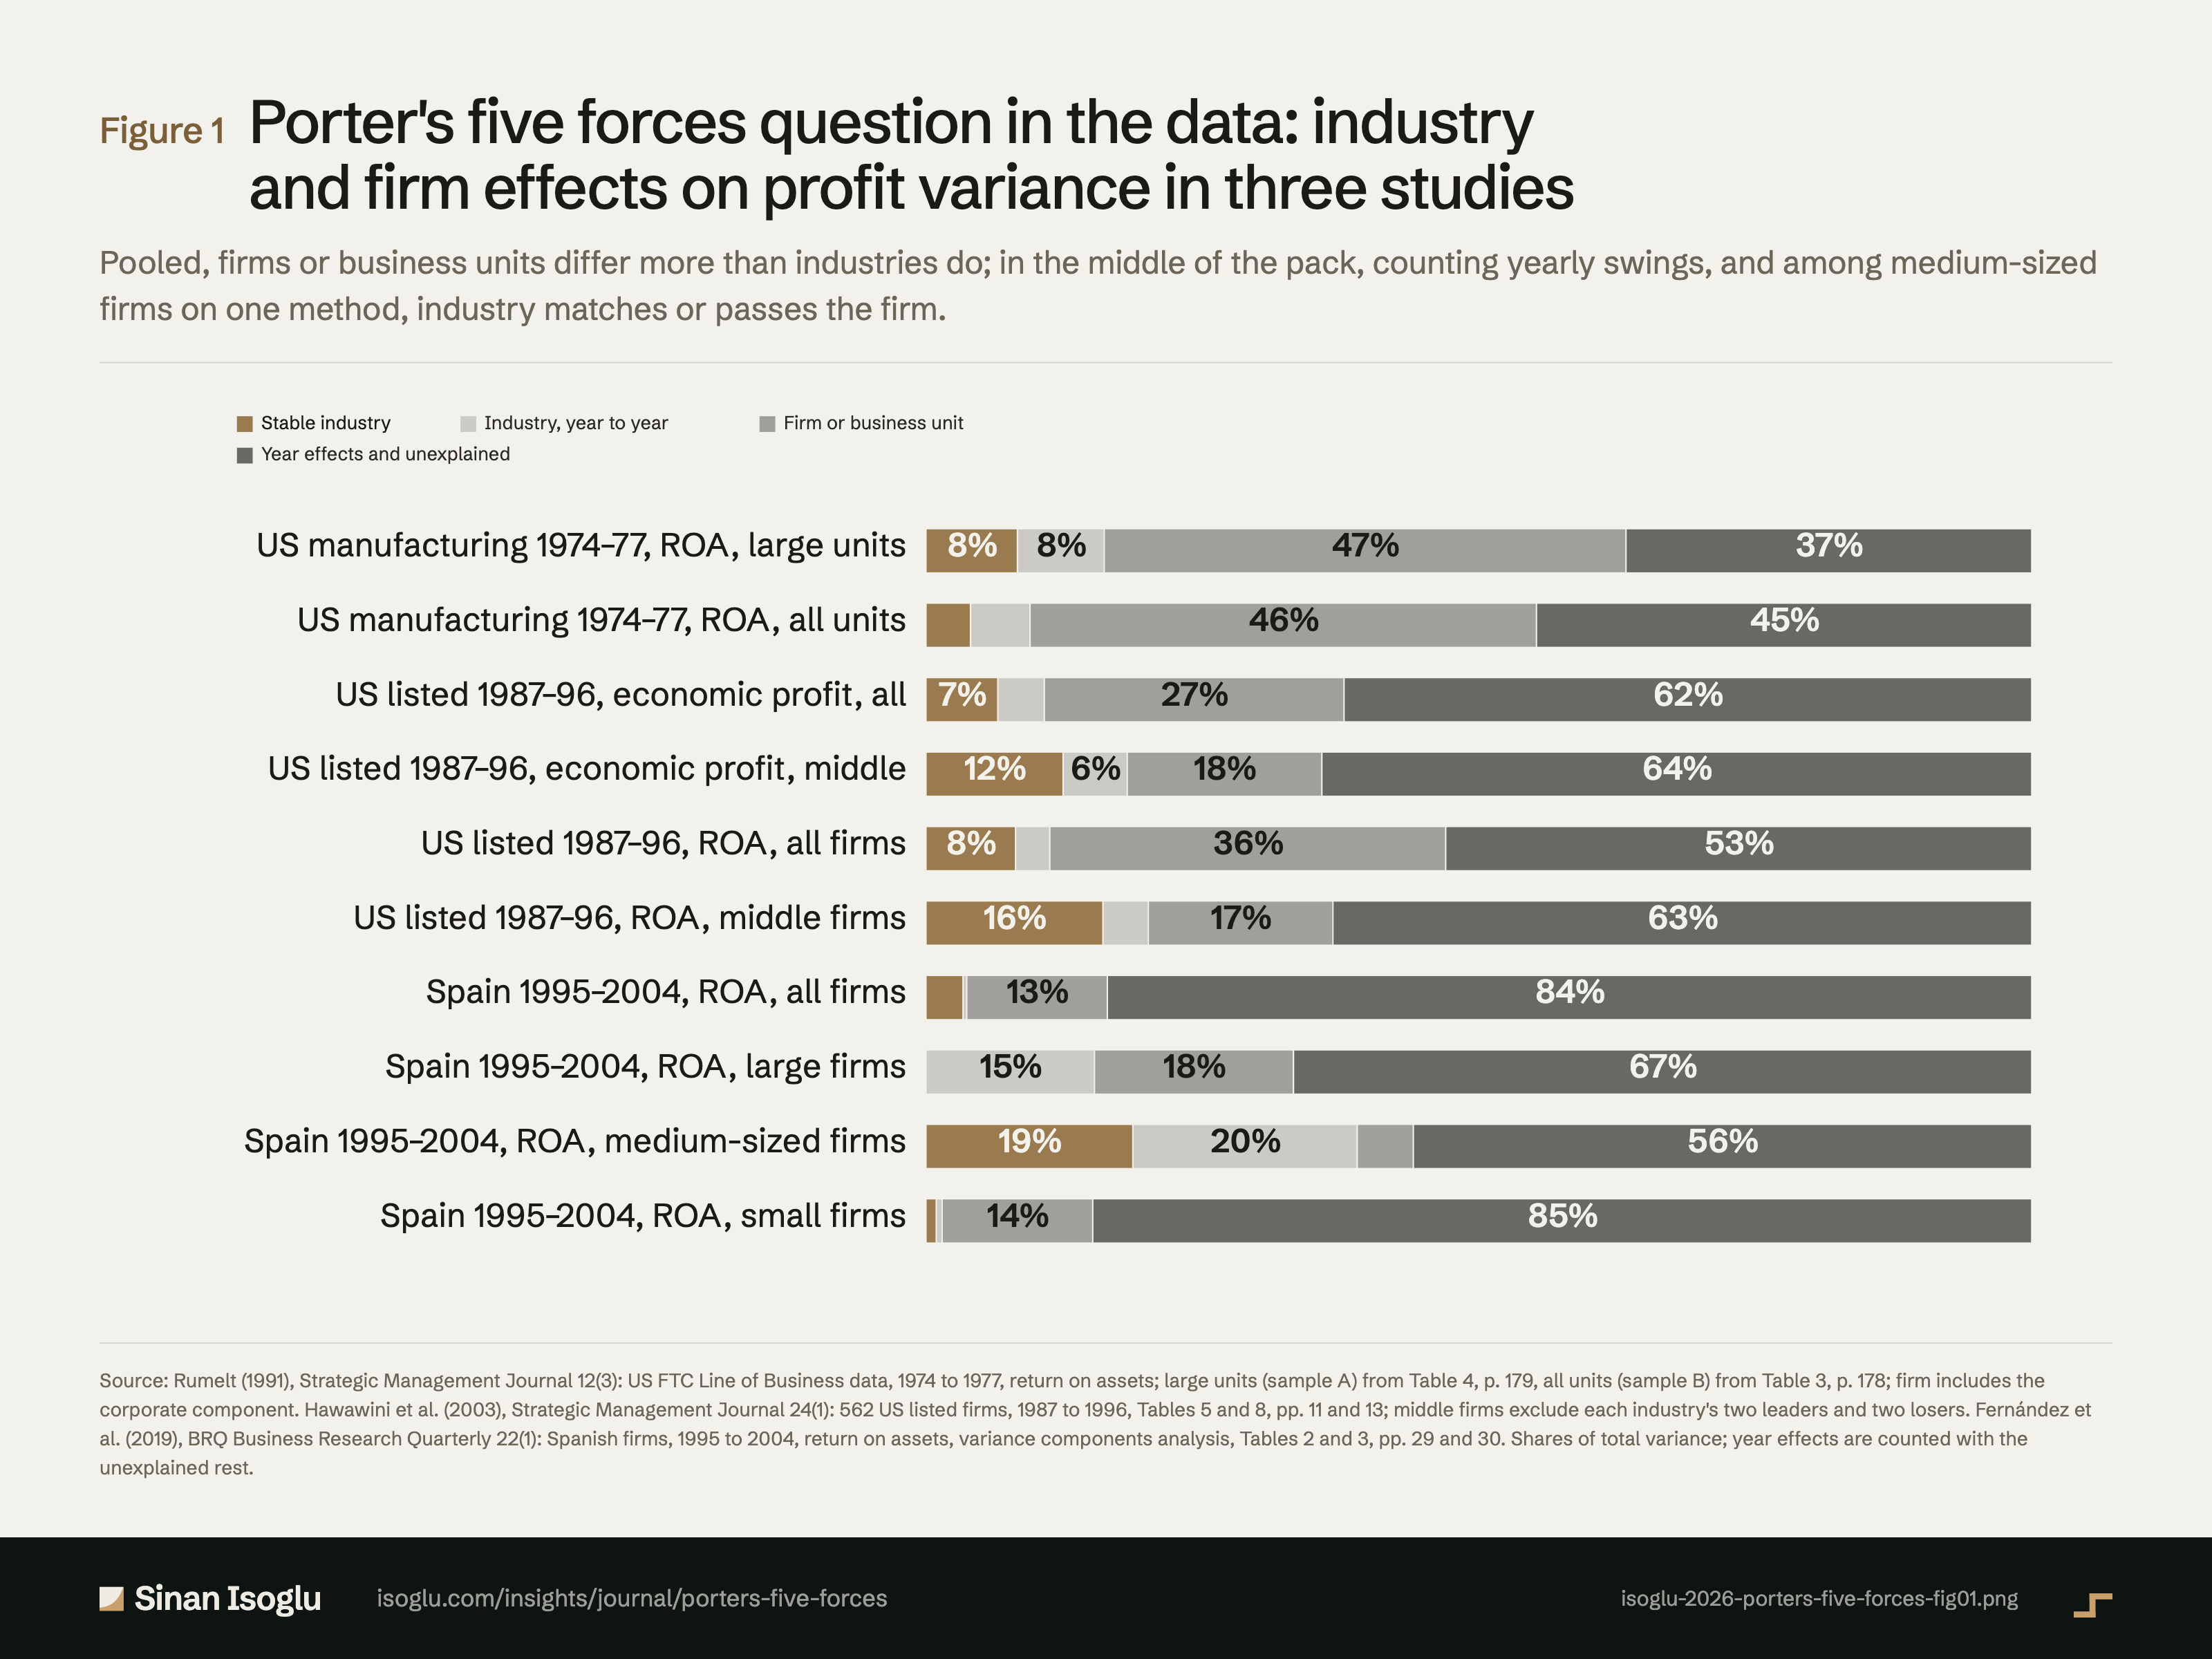
Abbildung 1Grafik
Die Five-Forces-Frage in den Daten: Branchen- und Unternehmenseffekte in drei Studien
Porters Five Forces: warum die Firma mehr zählt als die Branche
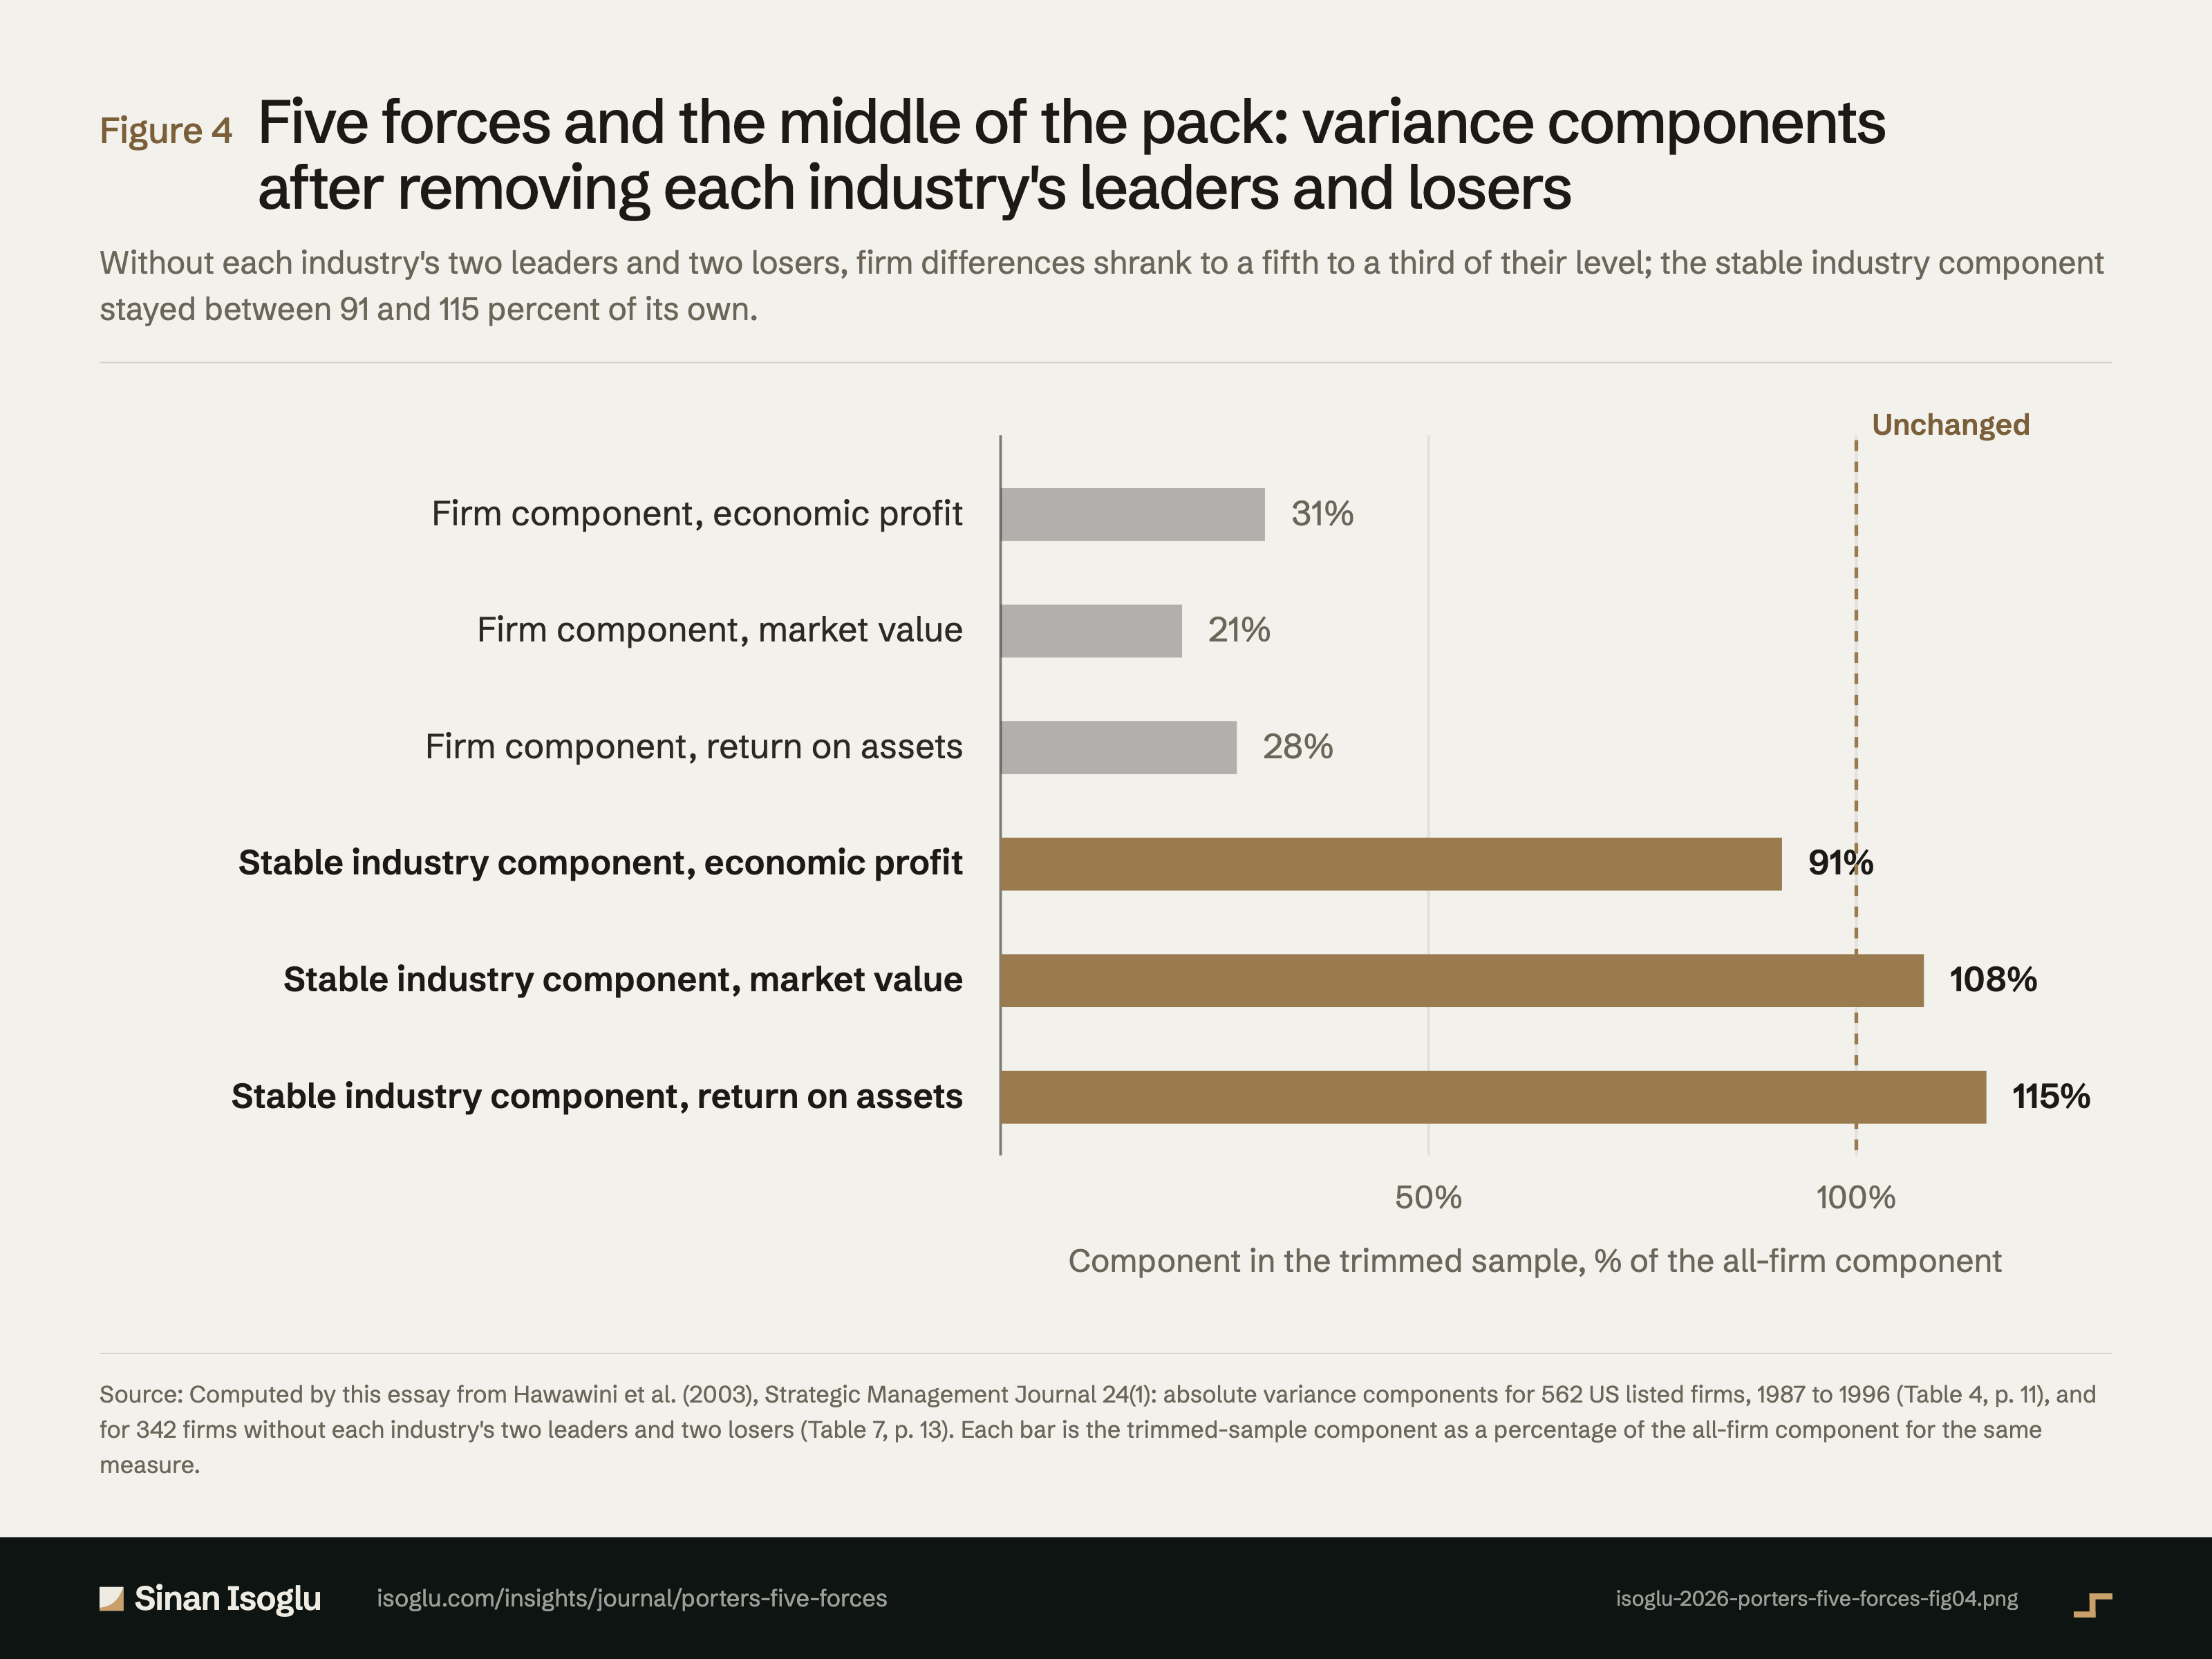
Abbildung 4Grafik
Five Forces und das Mittelfeld: Varianzkomponenten ohne die Spitzenreiter und Schlusslichter jeder Branche
Porters Five Forces: warum die Firma mehr zählt als die Branche
Kontakt
Schicken Sie die Frage, an der Sie arbeiten.
Forschung, ein Gastvortrag oder eine Frage aus der Praxis.