Abbildung 1Aus „Porters Five Forces: warum die Firma mehr zählt als die Branche“
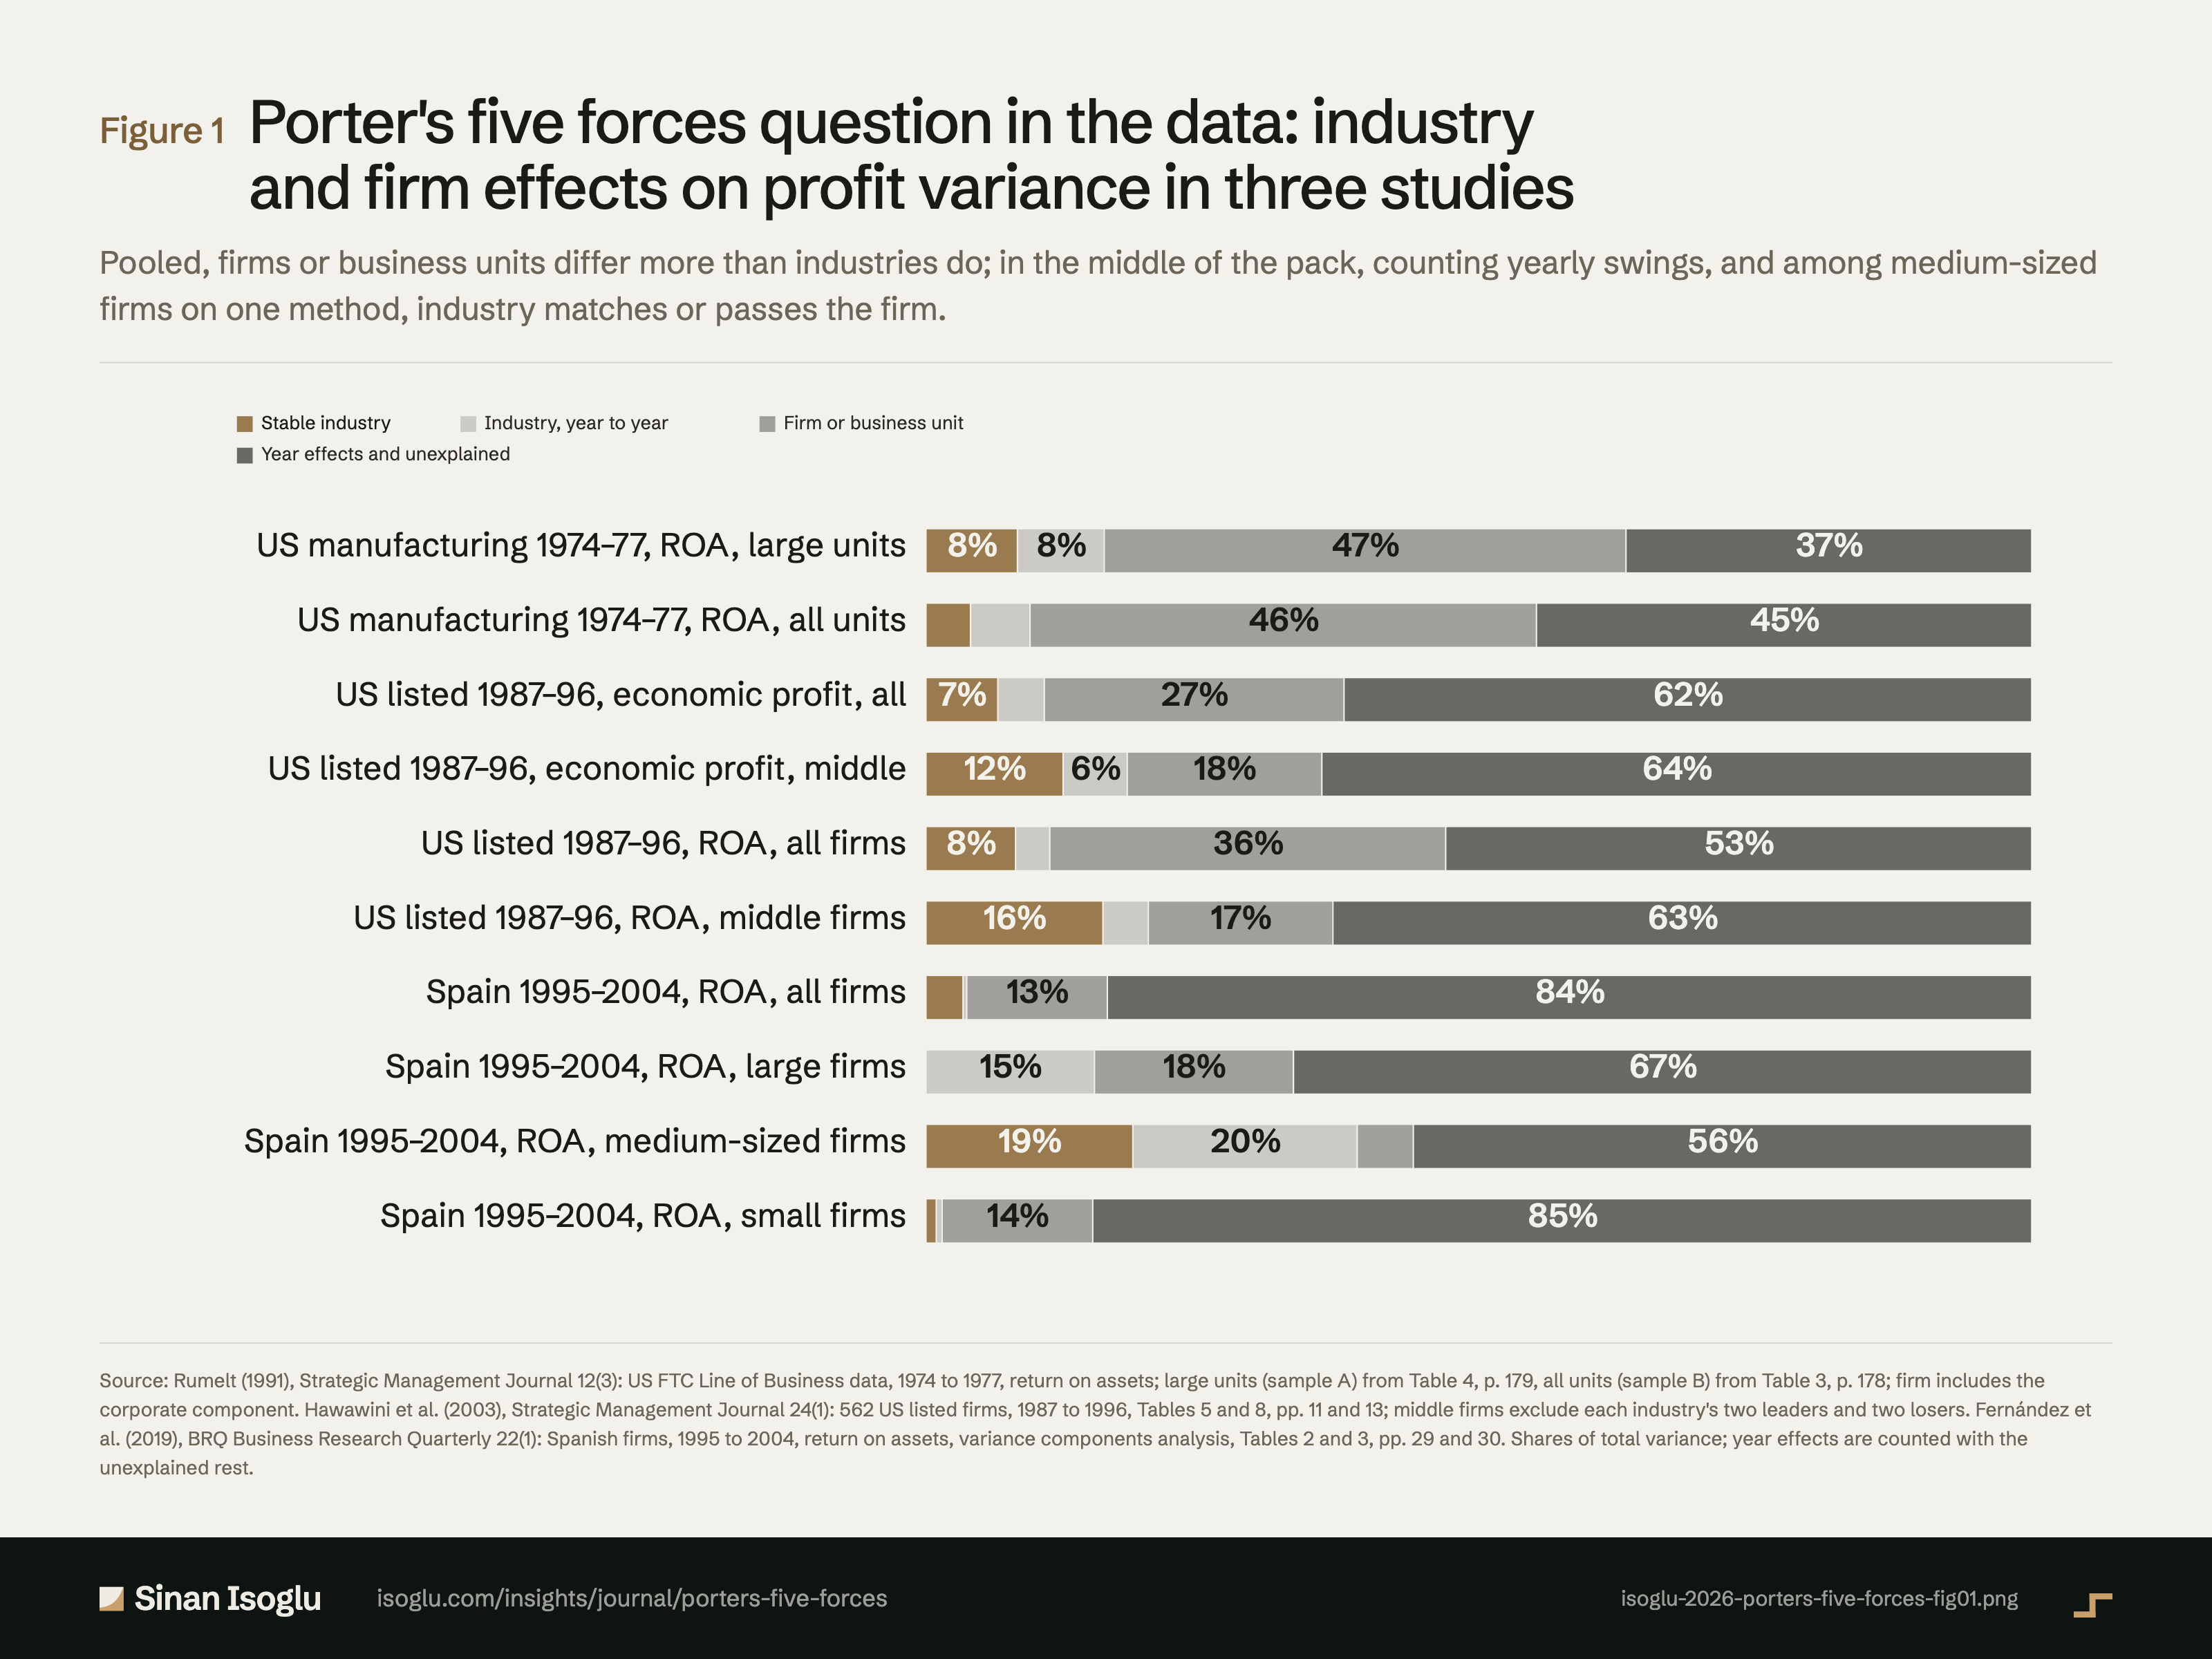
Die Five-Forces-Frage in den Daten: Branchen- und Unternehmenseffekte in drei Studien
Über alle Unternehmen unterscheiden sich Unternehmen oder Geschäftseinheiten stärker als Branchen; im Mittelfeld mit den jährlichen Schwankungen und bei mittleren Unternehmen nach einer Methode erreicht oder übertrifft die Branche das Unternehmen.
Abbildung 1Die Five-Forces-Frage in den Daten: Branchen- und Unternehmenseffekte in drei Studien
Quelle: Rumelt (1991), Strategic Management Journal 12(3): Line-of-Business-Daten der US-Handelsbehörde FTC, 1974 bis 1977, Gesamtkapitalrentabilität; große Einheiten (Stichprobe A) aus Tabelle 4, S. 179, alle Einheiten (Stichprobe B) aus Tabelle 3, S. 178; der Unternehmenseffekt schließt den Konzerneffekt ein. Hawawini u. a. (2003), Strategic Management Journal 24(1): 562 börsennotierte US-Unternehmen, 1987 bis 1996, Tabellen 5 und 8, S. 11 und 13; das Mittelfeld ohne die zwei Spitzenreiter und die zwei Schlusslichter jeder Branche. Fernández u. a. (2019), BRQ Business Research Quarterly 22(1): spanische Unternehmen, 1995 bis 2004, Gesamtkapitalrentabilität, Varianzkomponentenanalyse, Tabellen 2 und 3, S. 29 und 30. Anteile an der Gesamtvarianz; Jahreseffekte sind dem unerklärten Rest zugeschlagen.
Quelle und Evidenz
Jede Zeile nennt eine Aussage zu dieser Abbildung, ihre Quelle und die Art ihrer Prüfung.
- A A gegen die gedruckte Seite der Primärquelle geprüftB Primärquelle, nur TextebeneC belastbare SekundärquelleD berichtet Data and measure: US FTC Line of Business data on the domestic operations of large corporations in 261 four-digit manufacturing industries, 1974 to 1977; sample A 1,774 business units of 457 corporations in 242 industries (6,932 observations), sample B 2,810 units adding small ones (10,866 observations); return on assets as profit before interest and taxes over total assets (pp. 170, 171): "The FTC collected data on the domestic operations of large corporations in each of 261 4-digit FTC manufacturing industry categories"; "Sample A then contained 6932 observations provided by 457 corporations on 1774 business-units operating in a total of 242 4-digit FTC industries"; "Sample B then contained 10,866 observations provided by 463 corporations on 2810 business-units operating in a total of 242 4-digit FTC industries"; "The rate of return was taken to be the ratio of profit before interest and taxes to total assets, expressed as a percentage"Rumelt (1991)
- A A gegen die gedruckte Seite der Primärquelle geprüftB Primärquelle, nur TextebeneC belastbare SekundärquelleD berichtet Partition of business-unit returns, restricted model: sample A (B) 8 (4) percent stable industry, 1 (2) corporate, 46 (44) business unit, 8 (5) industry-year, 37 (45) residual; Table 4 for sample A: 8.28, 7.84, 0.80, 46.38, 36.70 (sum 100.00); Table 3 for sample B: 4.03, 5.38, 1.64, 44.17, 44.79; business-unit variance six (eleven) times the industry variance; Table 3 prints 36.87 for the sample A error, Table 4 36.70, which sums (pp. 178, 179): "8 (4) percent industry effects, 1 (2) percent corporate effects, 46 (44) percent business-unit effects, 8 (5) percent industry-year effects, and 37 (45) percent residual error"; "business-units differ from one another within industries much more than industries differ from one another"; "six times larger in sample A and eleven times larger in sample B"Rumelt (1991)
- A A gegen die gedruckte Seite der Primärquelle geprüftB Primärquelle, nur TextebeneC belastbare SekundärquelleD berichtet Sample: Stern Stewart data set of 1,000 US listed firms ranked by market value added; 1987 to 1996; three-digit SIC; 562 firms in 55 industries, 5,620 observations; survivors only; may be dominated by large firms (pp. 6, 7): "The U.S. data set covers 1000 listed firms for periods of up to 21 years"; "The sample set covers the 10-year period from 1987 to 1996"; "The firms are classified into industries based on the SIC system"; "The final sample contains 5620 observations for 562 firms across 55 industry classifications"; "The data set only contains firms that survived during the time period"Hawawini, Subramanian and Verdin (2003)
- A A gegen die gedruckte Seite der Primärquelle geprüftB Primärquelle, nur TextebeneC belastbare SekundärquelleD berichtet Full sample, Table 5: firm effects 27.1, 32.5 and 35.8 percent (EP/CE, TMV/CE, ROA); stable industry 6.5, 11.4 and 8.1; industry-year 4.2, 2.9 and 3.1; total industry 10.7, 14.3 and 11.2; stable firm effects more than four times stable industry effects for EP/CE and ROA (p. 11): "Total industry effects for EP/CE, TMV/CE and ROA are 10.7 percent, 14.3 percent, and 11.2 percent, respectively"; "the corresponding figures for stable firm effects are 27.1 percent, 32.5 percent, and 35.8 percent"; "stable firm effects dominate stable industry effects by a factor of more than four"Hawawini, Subramanian and Verdin (2003)
- A A gegen die gedruckte Seite der Primärquelle geprüftB Primärquelle, nur TextebeneC belastbare SekundärquelleD berichtet Middle of the pack, Table 8: industry effects (stable plus transient, as the authors compare them) 18.2 against firm 17.6 percent for EP/CE, 20.1 against 16.7 for ROA, 35.2 against 17.0 for TMV/CE; on stable industry effects alone 12.4 against 17.6 (EP/CE), 16.0 against 16.7 (ROA), 30.2 against 17.0 (TMV/CE); the transient component measures sensitivity to business cycles; firm-specific assets matter more only for the few leaders and losers (pp. 1, 7, 12, 13, 14): "overall industry effects (the sum of stable and transient industry effects) explain 35.2 percent in variation compared to only 17.0 percent for firm effects"; "In the case of EP/CE it is 18.2 percent for industry effects vs. 17.6 percent for firm effects and for ROA it is 20.1 percent against 16.7 percent"; "only for a few dominant value creators (leaders) and destroyers (losers) do firm-specific assets seem to matter significantly more than industry factors"; "Industry factors may have a large impact on the performance of the ‘also-ran’ firms, while for the industry leaders and losers it is firm factors that dominate"; "the transient component of industry effects measures the sensitivity of profitability to the impact of business cycles on the industry"Hawawini, Subramanian and Verdin (2003)
- A A gegen die gedruckte Seite der Primärquelle geprüftB Primärquelle, nur TextebeneC belastbare SekundärquelleD berichtet Sample and measure: Spanish firms from SABI, manufacturing and services, with accounts for all of 1995 to 2004 (14,204 originally); final 7,843 after excluding micro firms, 87.58 percent small, 10.97 medium, 1.45 large; EU size classes of the 2003 Commission recommendation as the authors apply them, on employees and turnover in the last sample year, 2004 (medium: fewer than 250 employees, up to 50 million euros turnover; large: 250 or more and over 50 million); ROA; NCEA three-digit sectors; a decade of expansion with no year of GDP decline (pp. 26, 28): "The original sample comprised 14,204 Spanish firms with accounting data for the entire"; "The final sample consisted of 7843 firms, of which 87.58% were small, 10.97% medium, and just 1.45% large"; "medium-sized firms, fewer than 250 employees and up to 50 million euros turnover"; "we follow the European Commission recommendation of 6 May 2003"; "In this paper the analysis was carried out using ROA"; "covering an expansive phase of the economic cycle"; "In this work we use a broad sample of Spanish firms, both manufacturing and services"; "The assignment of each firm to a size category was made taking into account the value of the employment and turnover variables of the last year of the sample period"Fernández et al. (2019)
- A A gegen die gedruckte Seite der Primärquelle geprüftB Primärquelle, nur TextebeneC belastbare SekundärquelleD berichtet Pooled, Table 2: firm 12.71 percent, industry 3.35, year 0.48, industry-year 0.34, residual 83.12 (the printed total 156.82 is the small-firm total; the shares are of 211.14) (p. 29): "These show that the firm effect has the greatest explanatory power, while the industry effect is less important"; "a significant part of the variance of ROA is not explained by the model"Fernández et al. (2019)
- A A gegen die gedruckte Seite der Primärquelle geprüftB Primärquelle, nur TextebeneC belastbare SekundärquelleD berichtet By size, variance components analysis, Table 3: large firm 17.99, stable industry 0.00, industry-year 15.24; medium firm 5.07, industry 18.71, industry-year 20.29; small firm 13.62, industry 0.93, industry-year 0.53 percent; industry about 39 percent against 5.07 for medium firms (pp. 29, 30, 32): "In the case of large firms, the transient industry effect explains almost as much as the firm effect, but the stable component of the industry effect has no significance whatever"; "In the case of medium-sized firms, the importance of the industry effect is eight times that of the firm effect, and is almost equally split between its two components, stable and transient"; "approximately 39% of variance explained by the industry and industry-year effects and 5.07% by the firm effect"Fernández et al. (2019)
- B A gegen die gedruckte Seite der Primärquelle geprüftB Primärquelle, nur TextebeneC belastbare SekundärquelleD berichtet First-screen synthesis across the three studies, one comparator per claim (G5 F1, F2): pooled stable industry share on profitability measures 3.35 (Fernández, all firms, ROA) to 8.28 percent (Rumelt A, ROA), so about 3 to 8, and 11.4 on HSV’s market-value measure (TMV/CE); firm or business-unit share 12.71 (Fernández) to 47.18 percent (Rumelt A, business unit 46.38 plus corporate 0.80), so about 13 to 47; middle of the pack: industry matches the firm only with yearly swings counted; medium-sized Spanish firms: industry exceeds the firm on the variance components method only; Figure 1 composition rows sum to 100 within roundingAuthor synthesis
Aus dem Beitrag
Go-to-Market-Strategie
Porters Five Forces: warum die Firma mehr zählt als die Branche
Die Five Forces nach Porter erfassen den Druck auf Branchengewinne. In drei Studien unterscheiden sich Firmen stärker als Branchen, im Mittelfeld kaum.
Den Beitrag lesenDiese Abbildung gehört zu einem Essay: Die Zahlen stehen hier, das Argument dort.
Zitieren oder einbetten
Verwandte Abbildungen
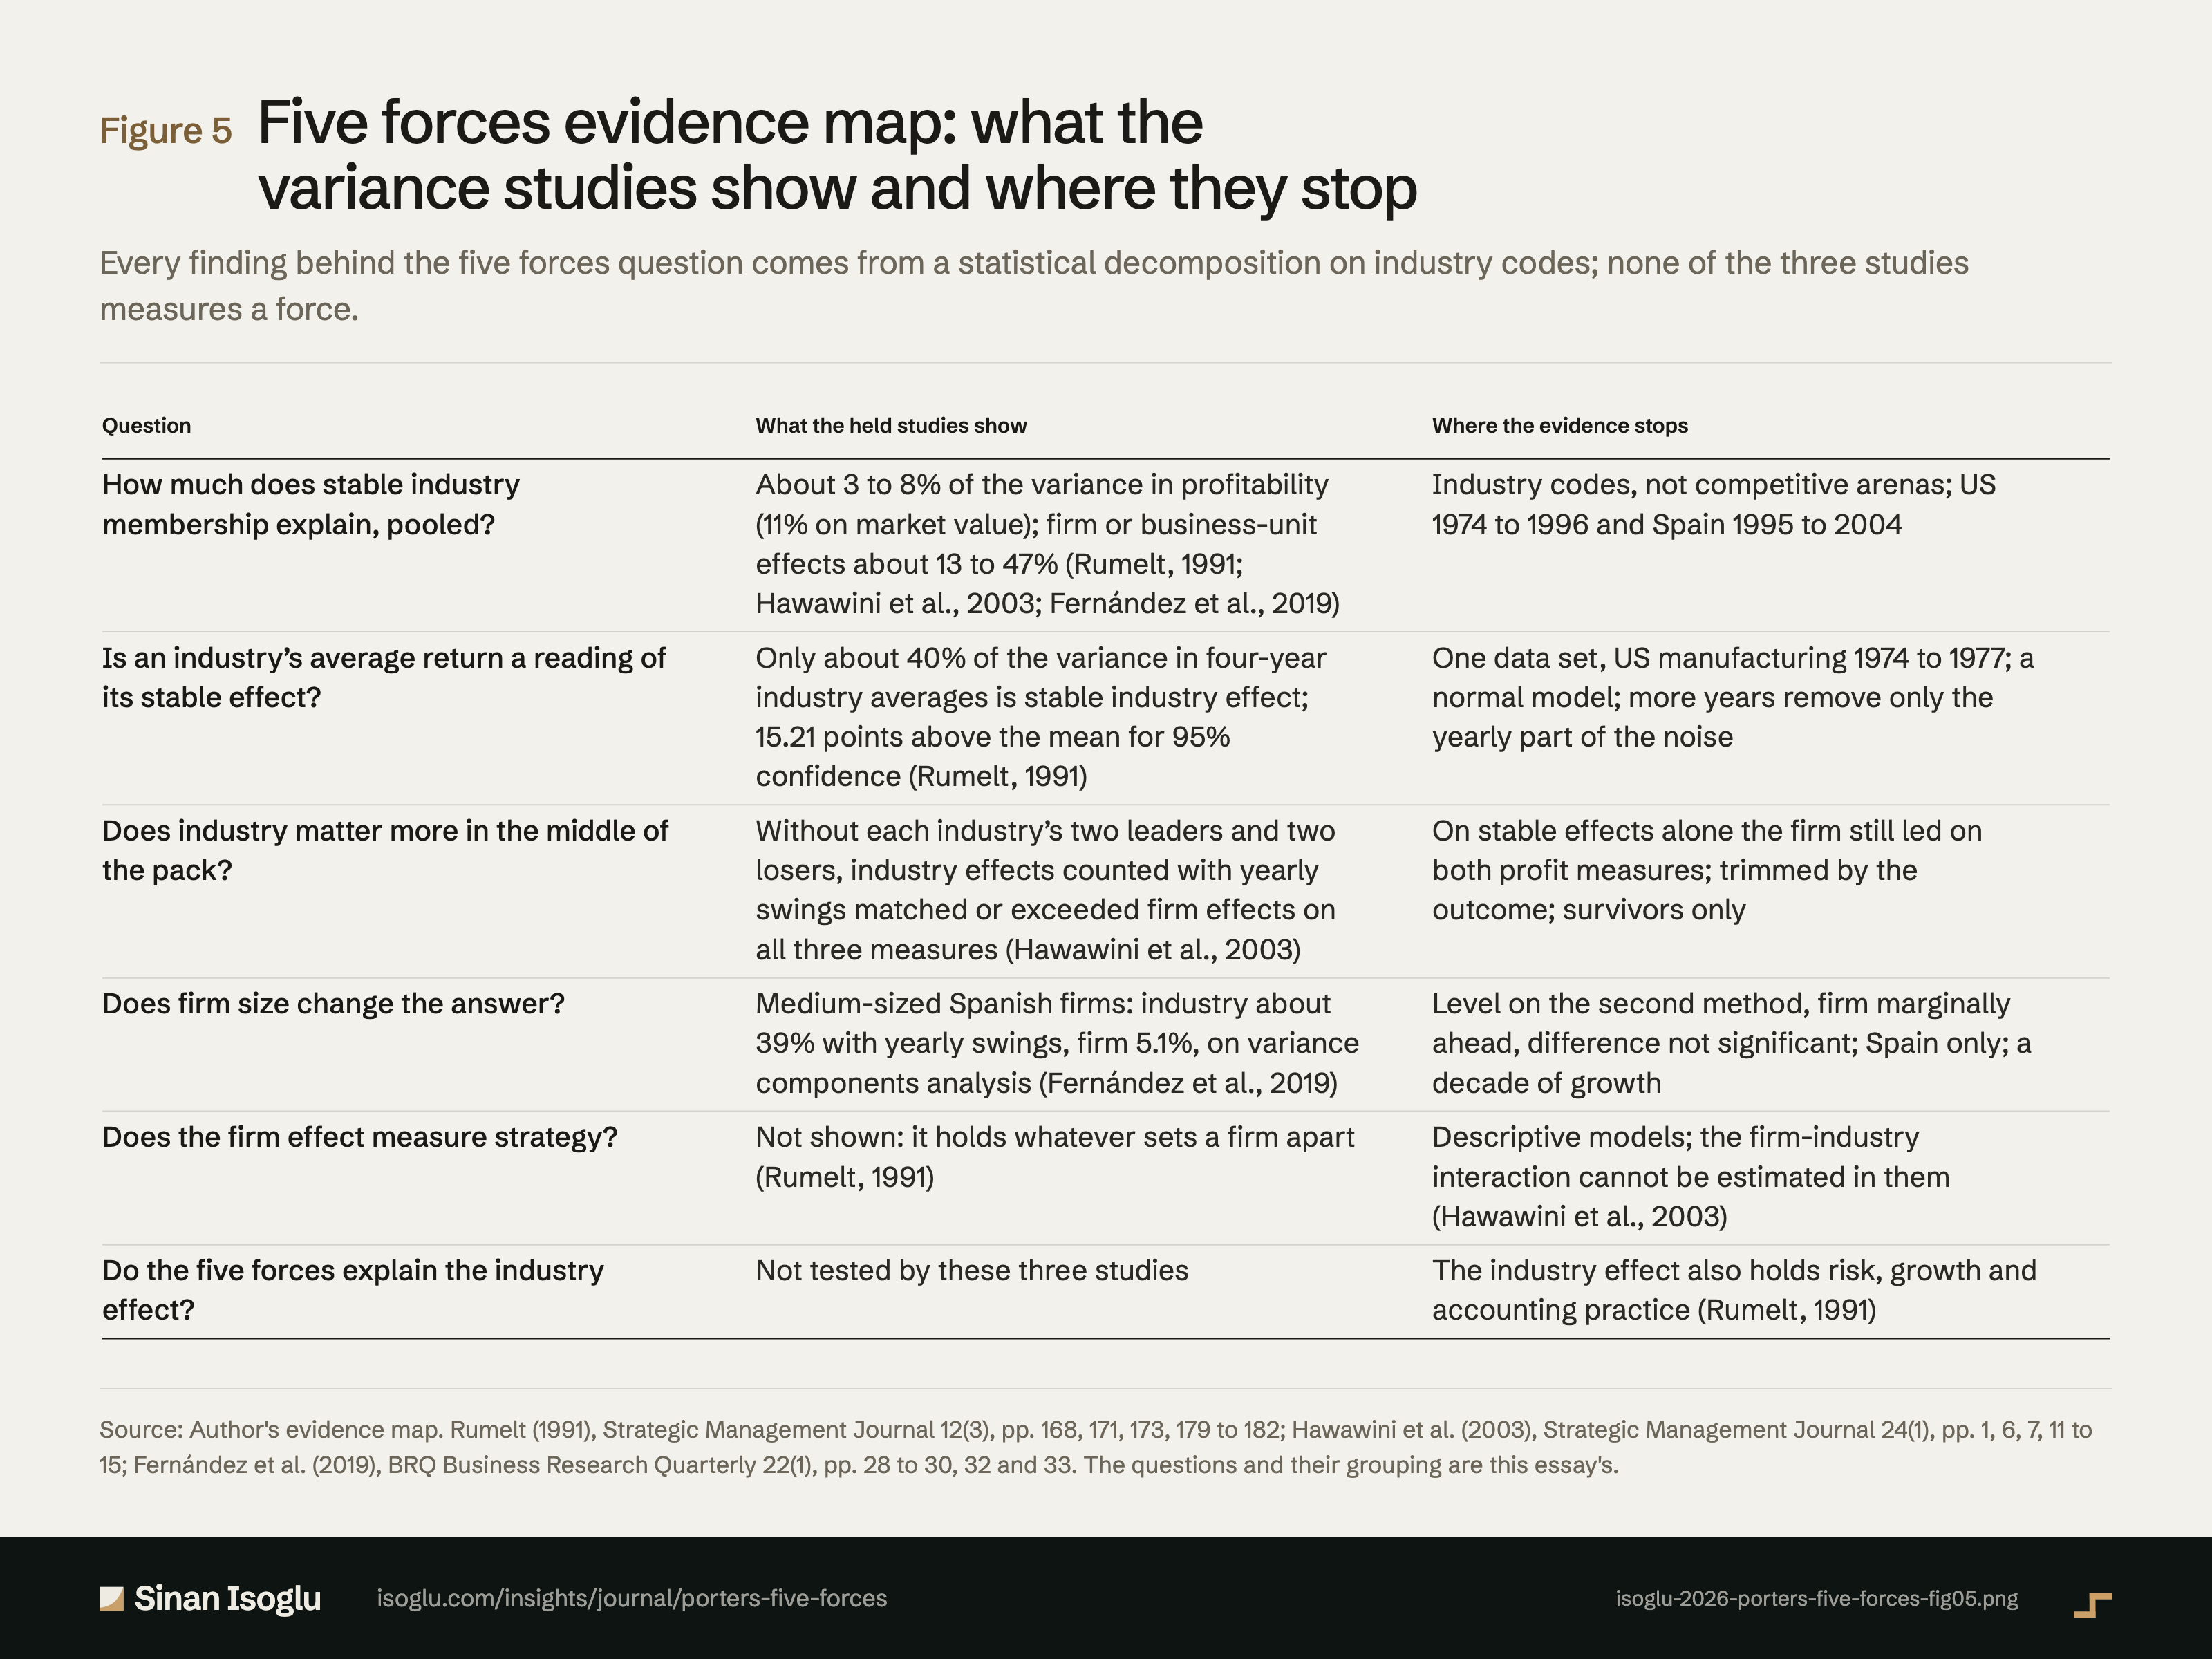
Abbildung 5Grafik
Five-Forces-Evidenzkarte: was die Varianzstudien zeigen und wo sie enden
Porters Five Forces: warum die Firma mehr zählt als die Branche
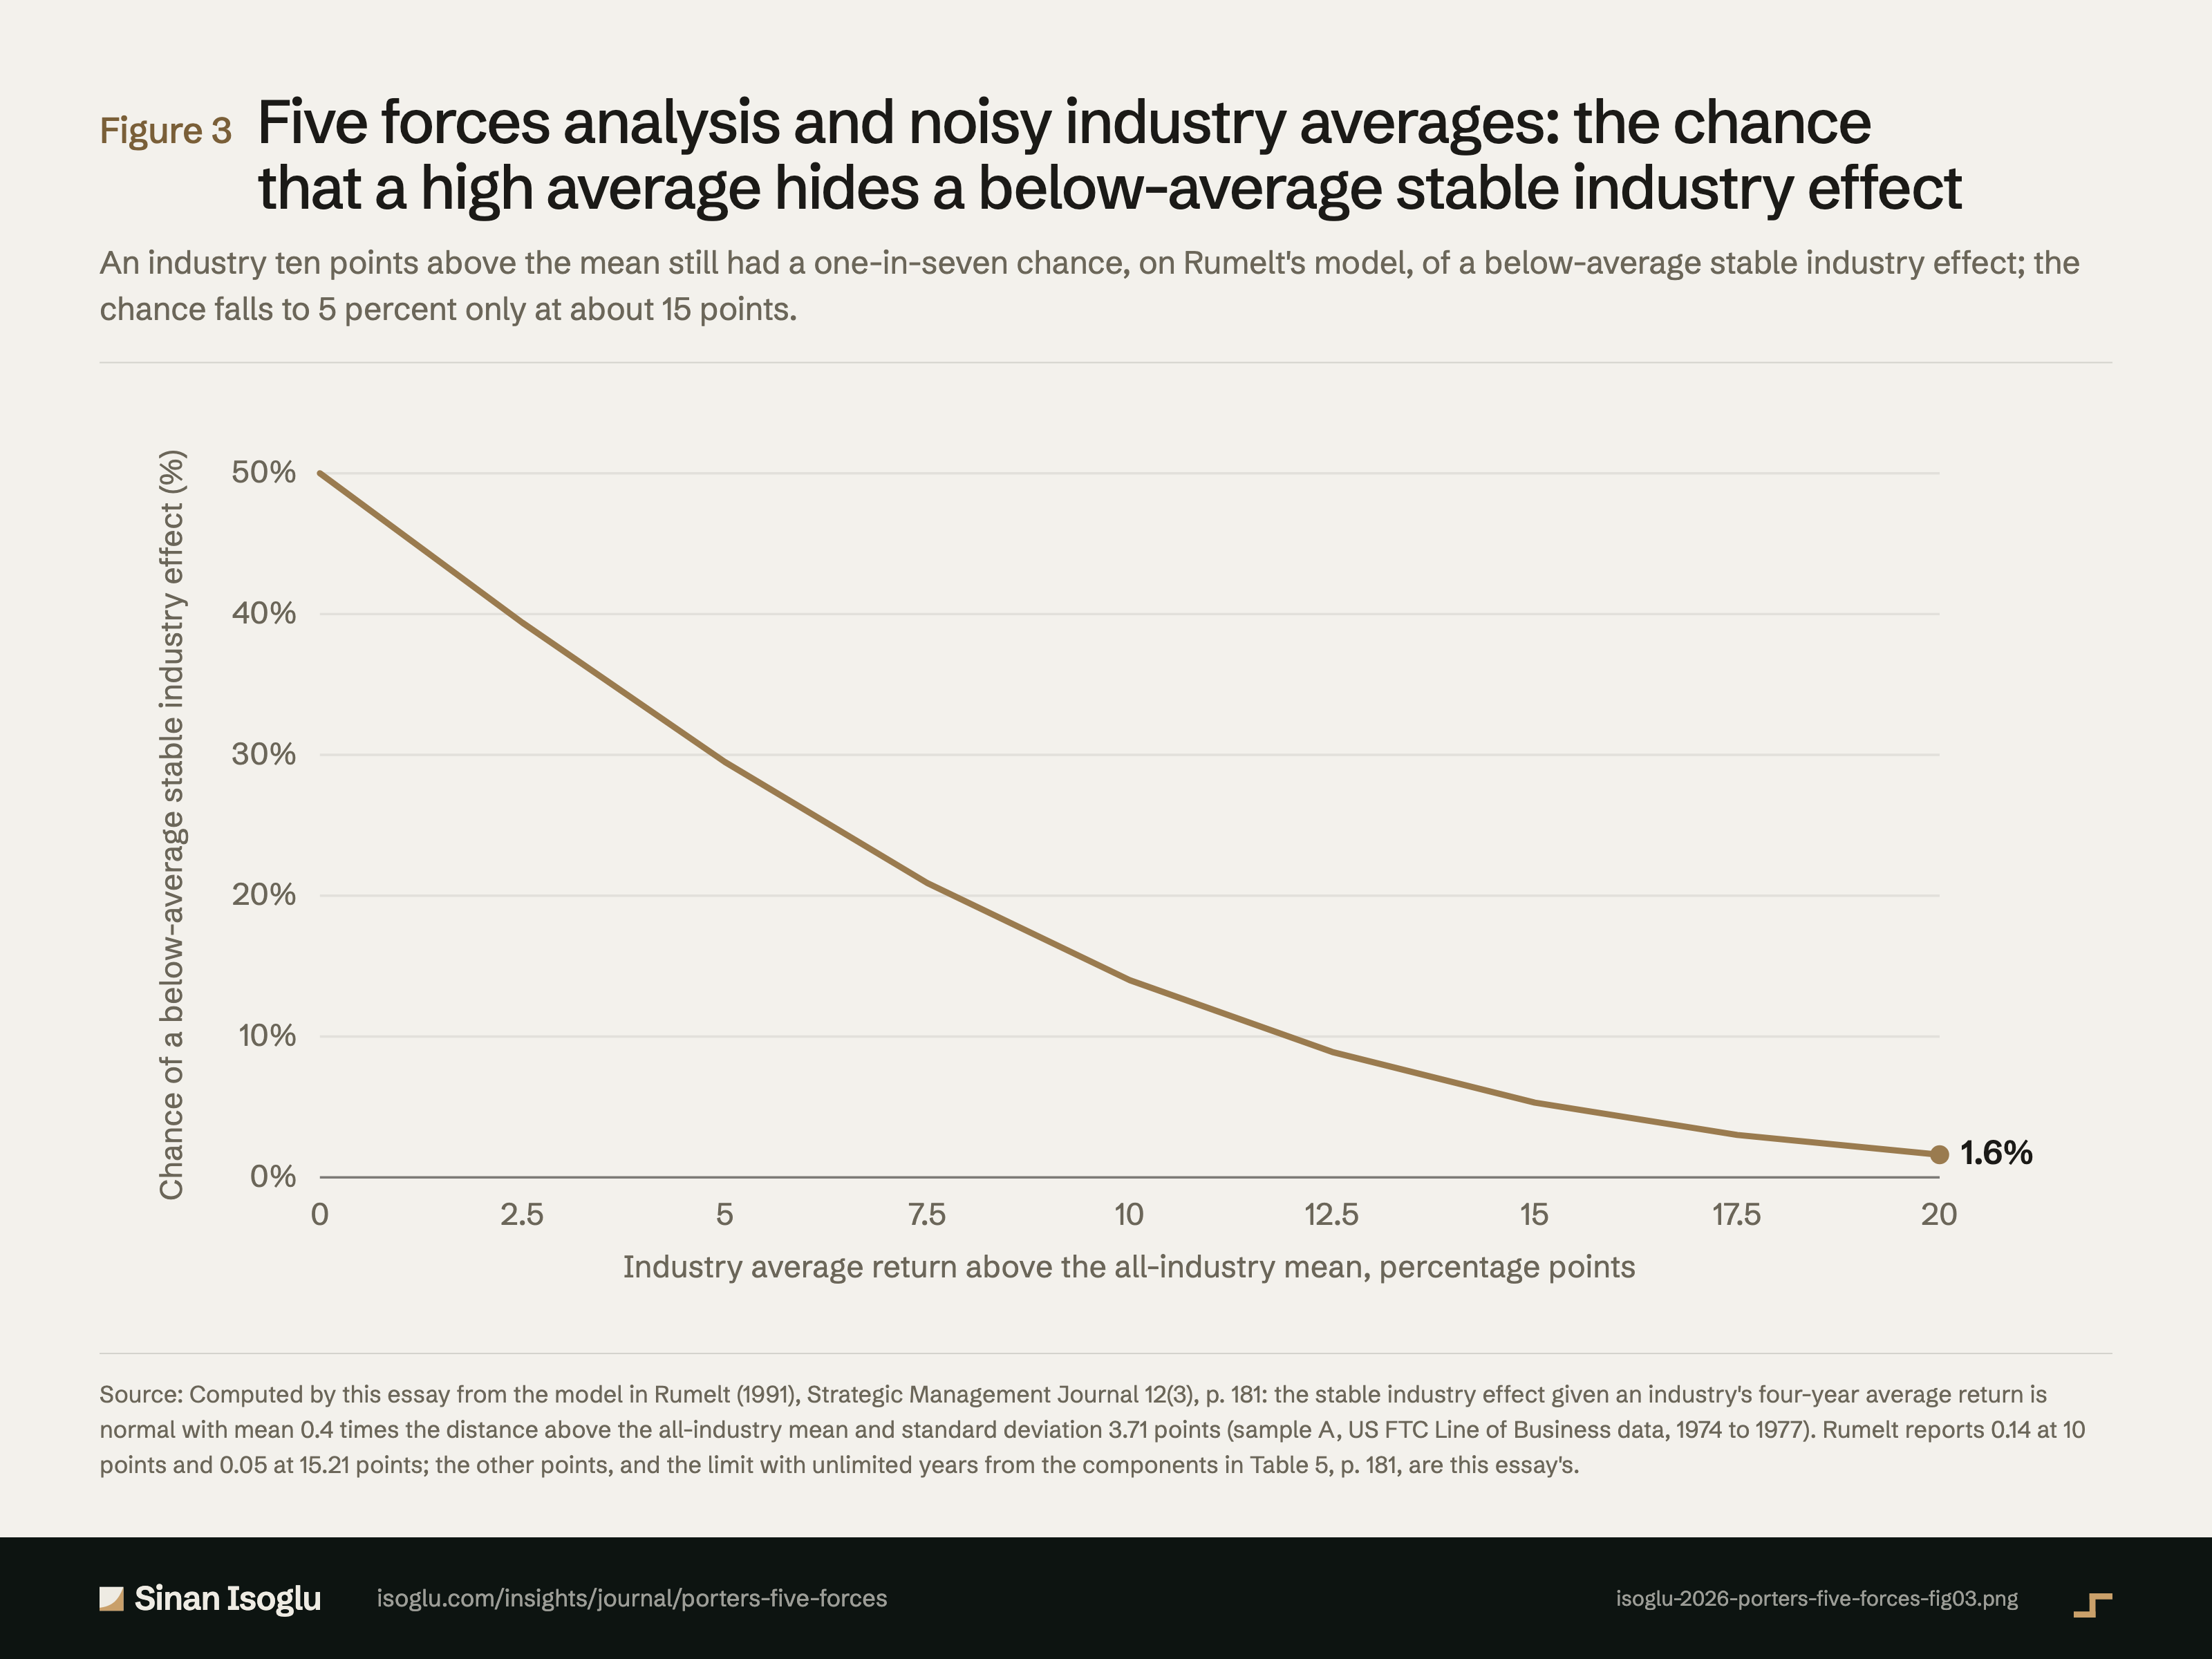
Abbildung 3Grafik
Five-Forces-Analyse und verrauschte Branchendurchschnitte: Wahrscheinlichkeit, dass ein hoher Durchschnitt einen unterdurchschnittlichen dauerhaften Brancheneffekt verdeckt
Porters Five Forces: warum die Firma mehr zählt als die Branche
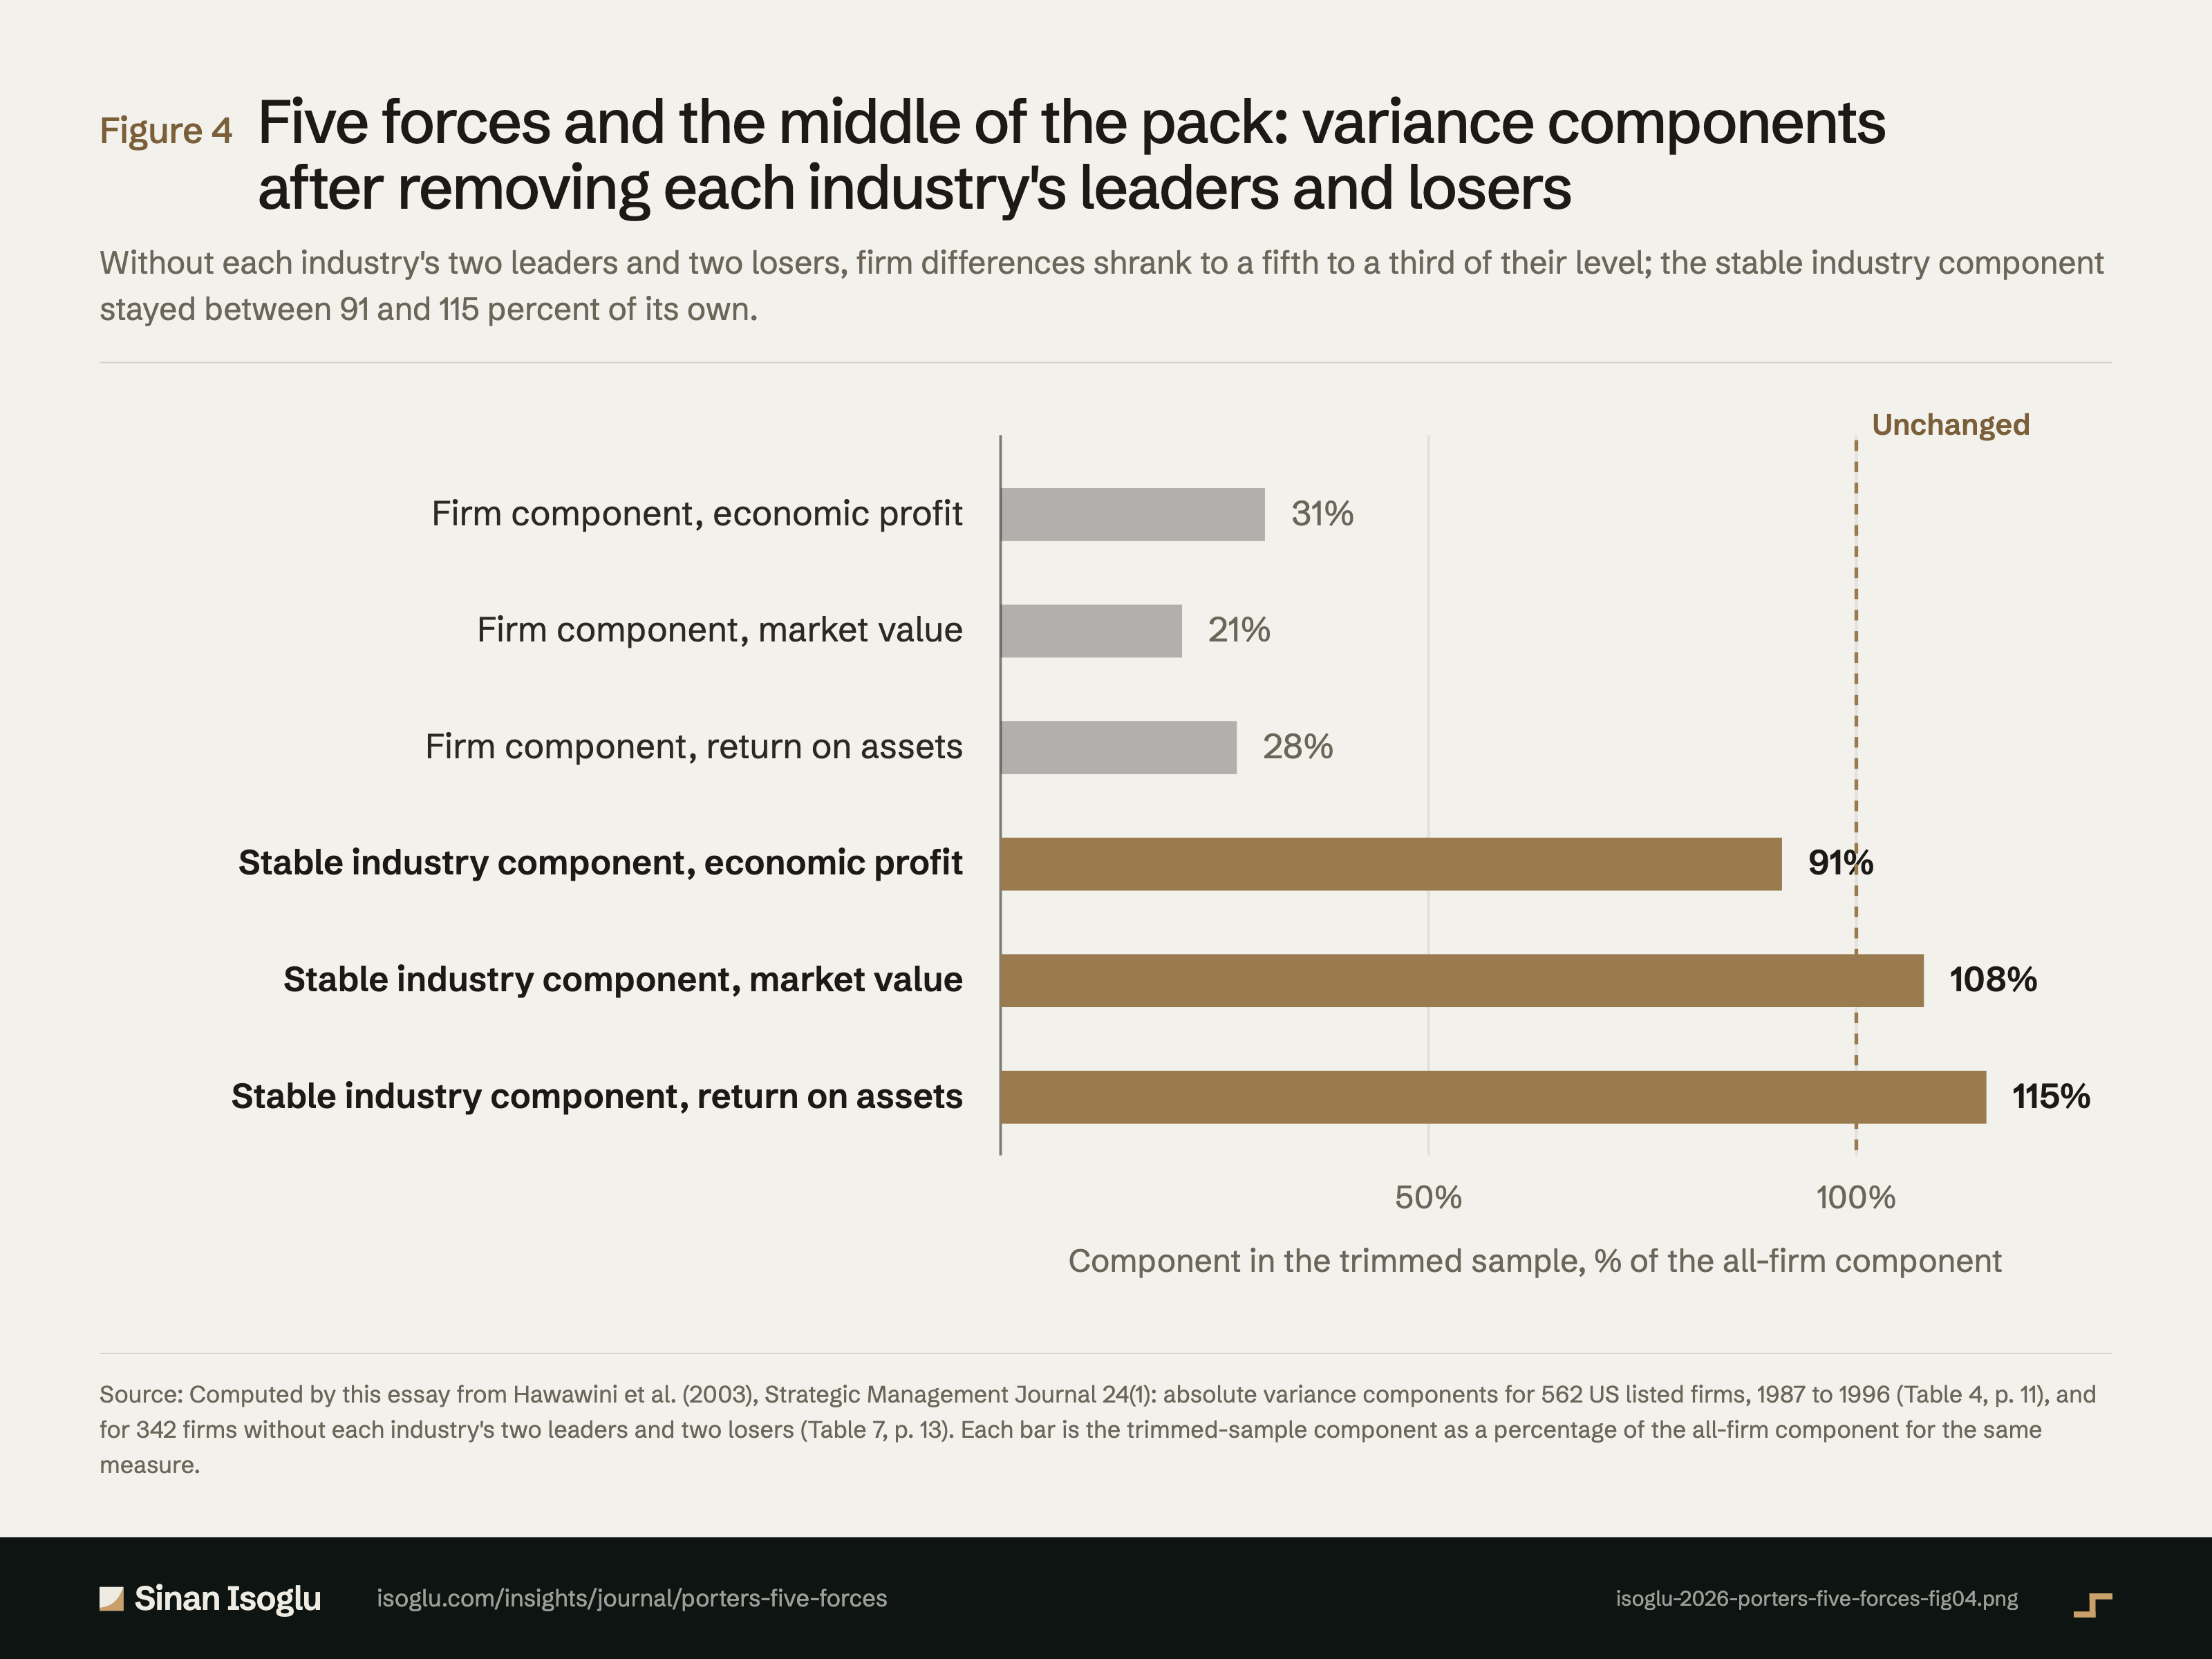
Abbildung 4Grafik
Five Forces und das Mittelfeld: Varianzkomponenten ohne die Spitzenreiter und Schlusslichter jeder Branche
Porters Five Forces: warum die Firma mehr zählt als die Branche
Kontakt
Schicken Sie die Frage, an der Sie arbeiten.
Forschung, ein Gastvortrag oder eine Frage aus der Praxis.