Figure 4From “BANT vs MEDDIC: a qualification checklist is a hypothesis”
Conversion rate against sales in tight and loose lead qualification, 1988
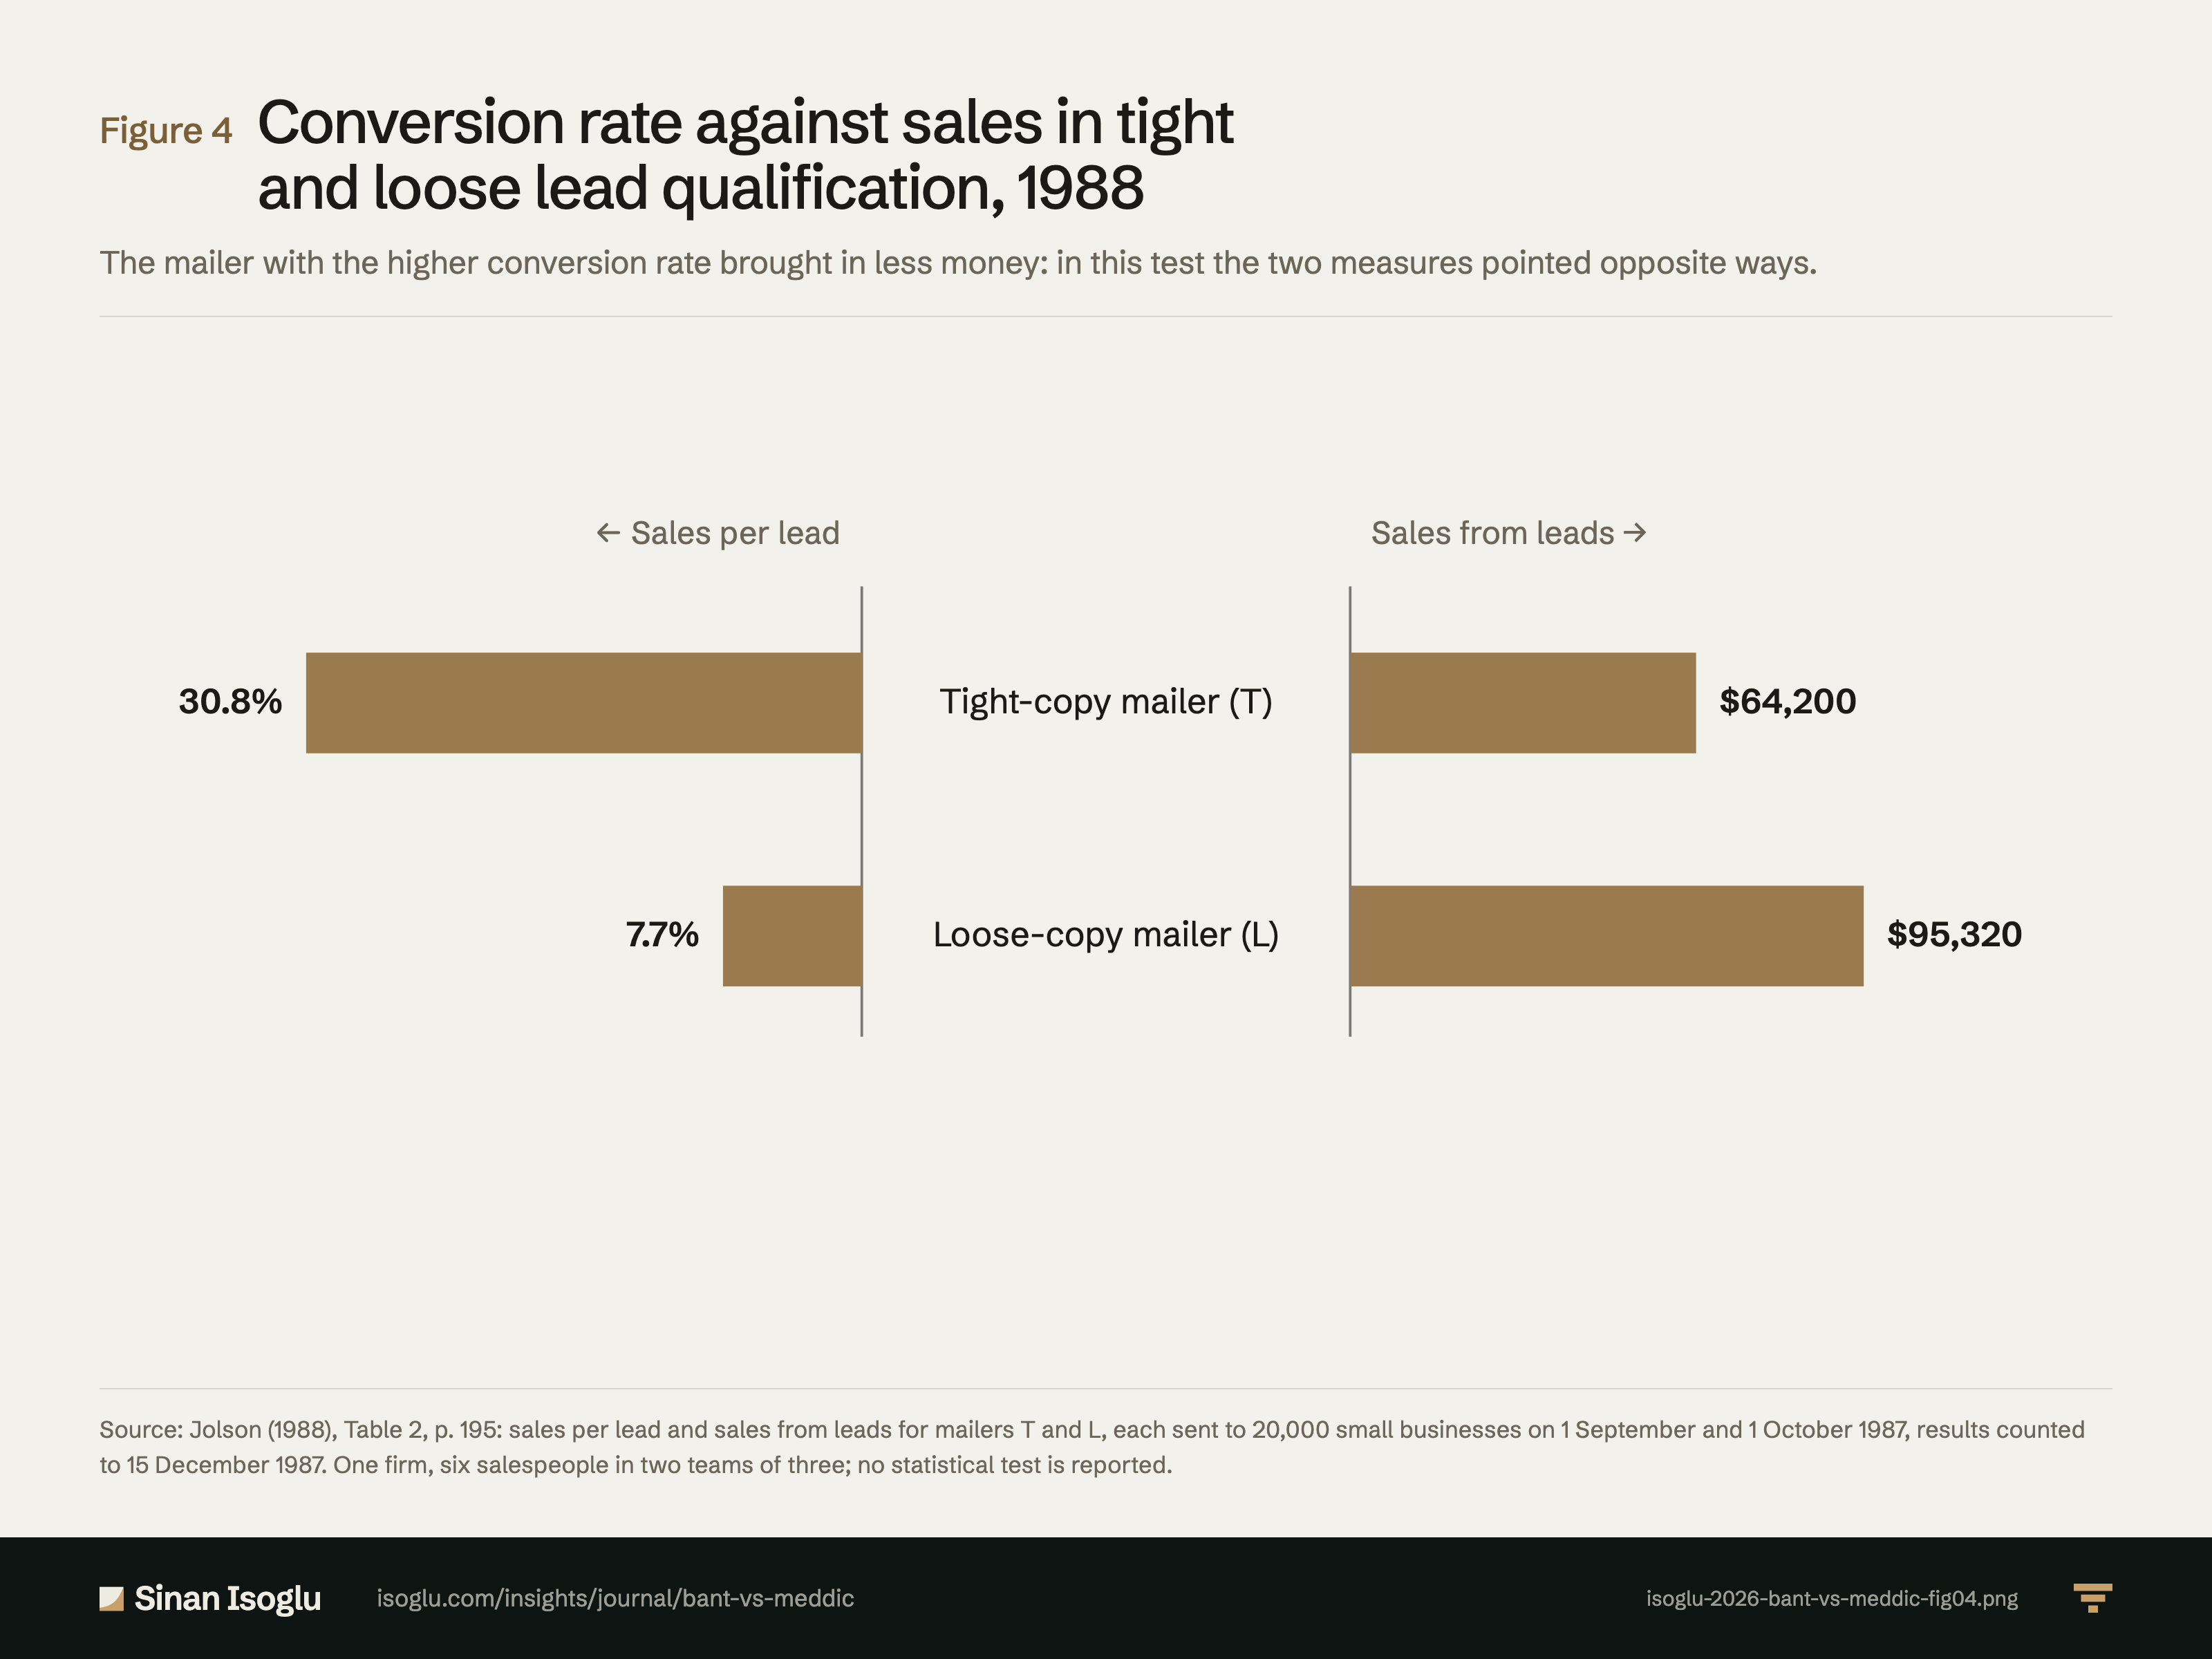
The mailer with the higher conversion rate brought in less money: in this test the two measures pointed opposite ways.
Figure 4Conversion rate against sales in tight and loose lead qualification, 1988
Source: Jolson (1988), Table 2, p. 195: sales per lead and sales from leads for mailers T and L, each sent to 20,000 small businesses on 1 September and 1 October 1987, results counted to 15 December 1987. One firm, six salespeople in two teams of three; no statistical test is reported.
Source and evidence
Each line names a claim related to this exhibit, its source, and how it was checked.
- A A verified against the printed page of the primary sourceB primary source, text layer onlyC authoritative secondaryD reported Results, read from the page images of pp. 194 and 195: leads returned 104 (tight) and 622 (loose), appointments 66 and 174, presentations 48 and 104, sales on leads 32 and 48, other sales 3 and 4; Table 2: sales from leads $64,200 and $95,320, salesperson earnings $10,144 and $12,761, sales per lead 30.8% and 7.7%, sales per presentation 66.7% and 46.2%, cost per lead $92.30 and $15.43, lead cost per sale $300.00 and $200.00; the tight team ran out of places to go; loose leads produced more volume, earnings and returns at lower cost per sale, tight leads a higher conversion rate and more motivation (pp. 194 to 196): "A Comparison of Tight vs. Loose Sales Leads"; "Almost one third of the T leads were converted into sales, whereas 13 loose leads were required for a sale."; "The sales emerging from tight leads cost 50% more."; "The T sales group seemed to run out of places to go and demonstrated little initiative and weak work habits in developing their own prospects."; "loose leads produced more sales volume, higher earnings for salespeople, a larger lead return rate, a lower lead cost per sale, and a lower compensation-cost ratio"; "Tight leads produced a higher conversion rate into sales and an increased level of motivation for sales force members."Jolson (1988)
From the essay
Revenue operations & AI
BANT vs MEDDIC: a qualification checklist is a hypothesis
BANT checks budget, authority, need and timing; MEDDIC maps how a buying group decides. In a 1988 field test, tight leads converted better and sold less.
Read the essayThis exhibit belongs to an essay: the numbers live here, the argument lives there.
Cite or embed
Related exhibits
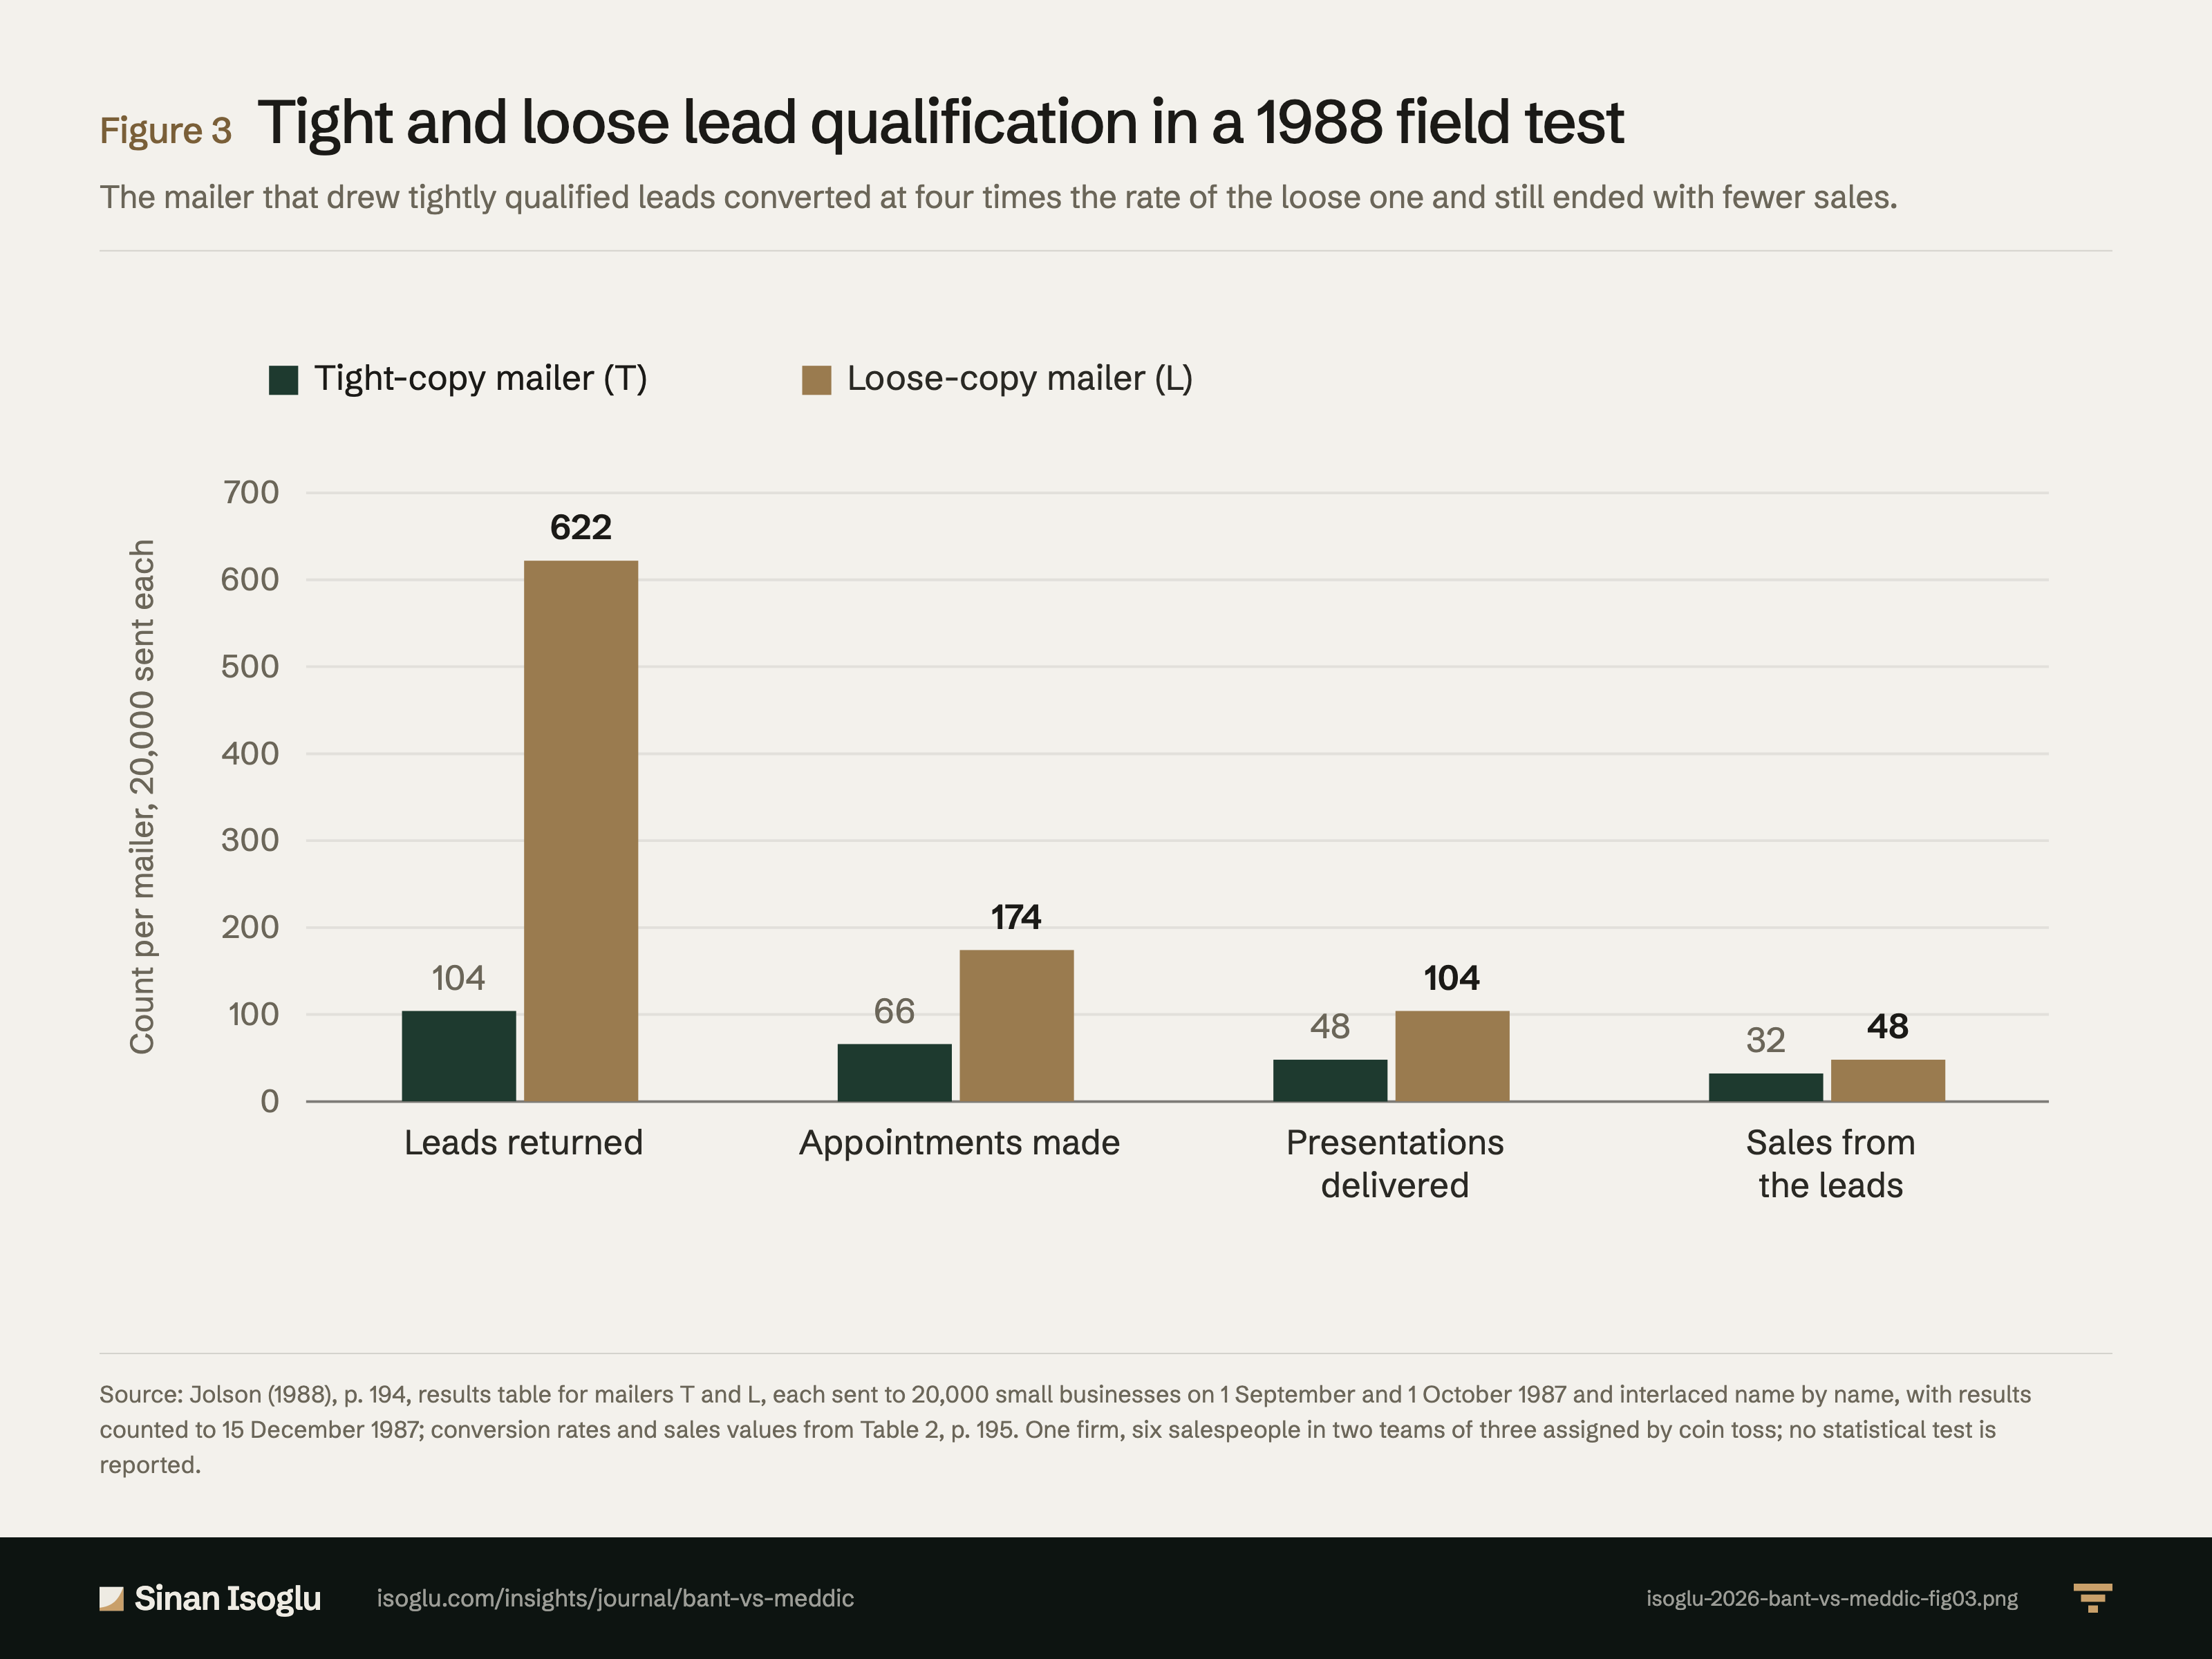
Figure 3Figure
Tight and loose lead qualification in a 1988 field test
BANT vs MEDDIC: a qualification checklist is a hypothesis
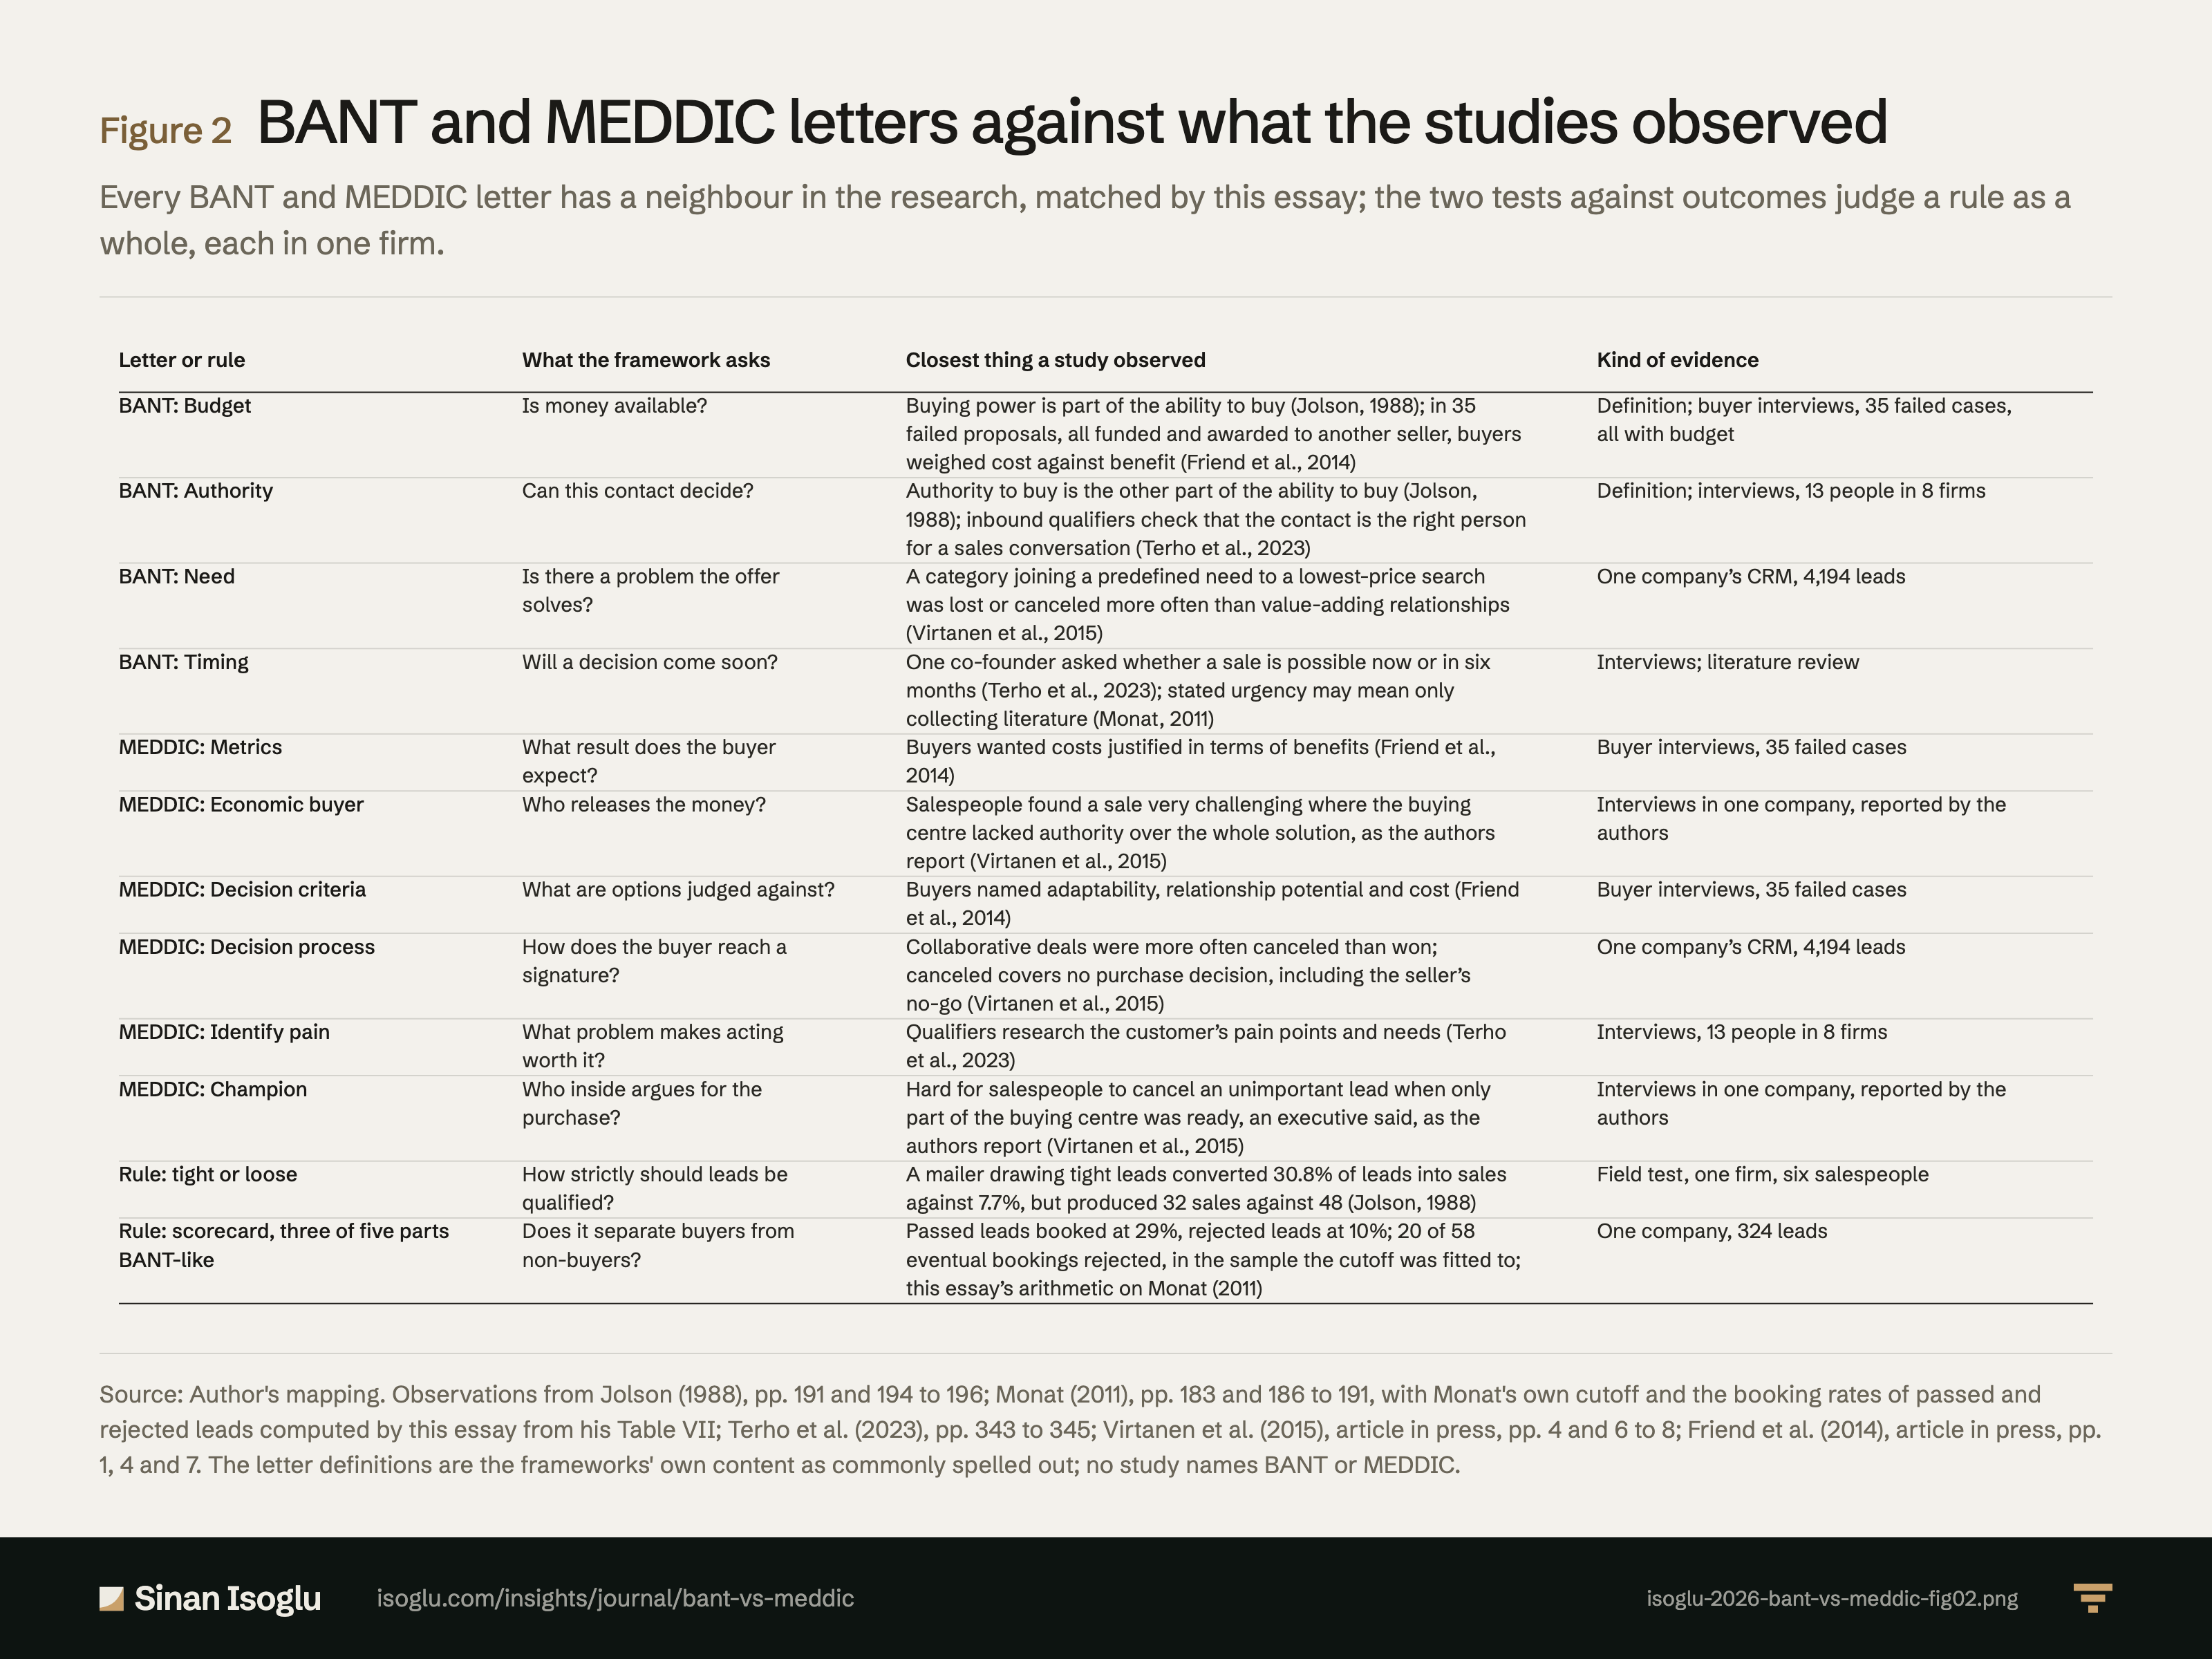
Figure 2Figure
BANT and MEDDIC letters against what the studies observed
BANT vs MEDDIC: a qualification checklist is a hypothesis
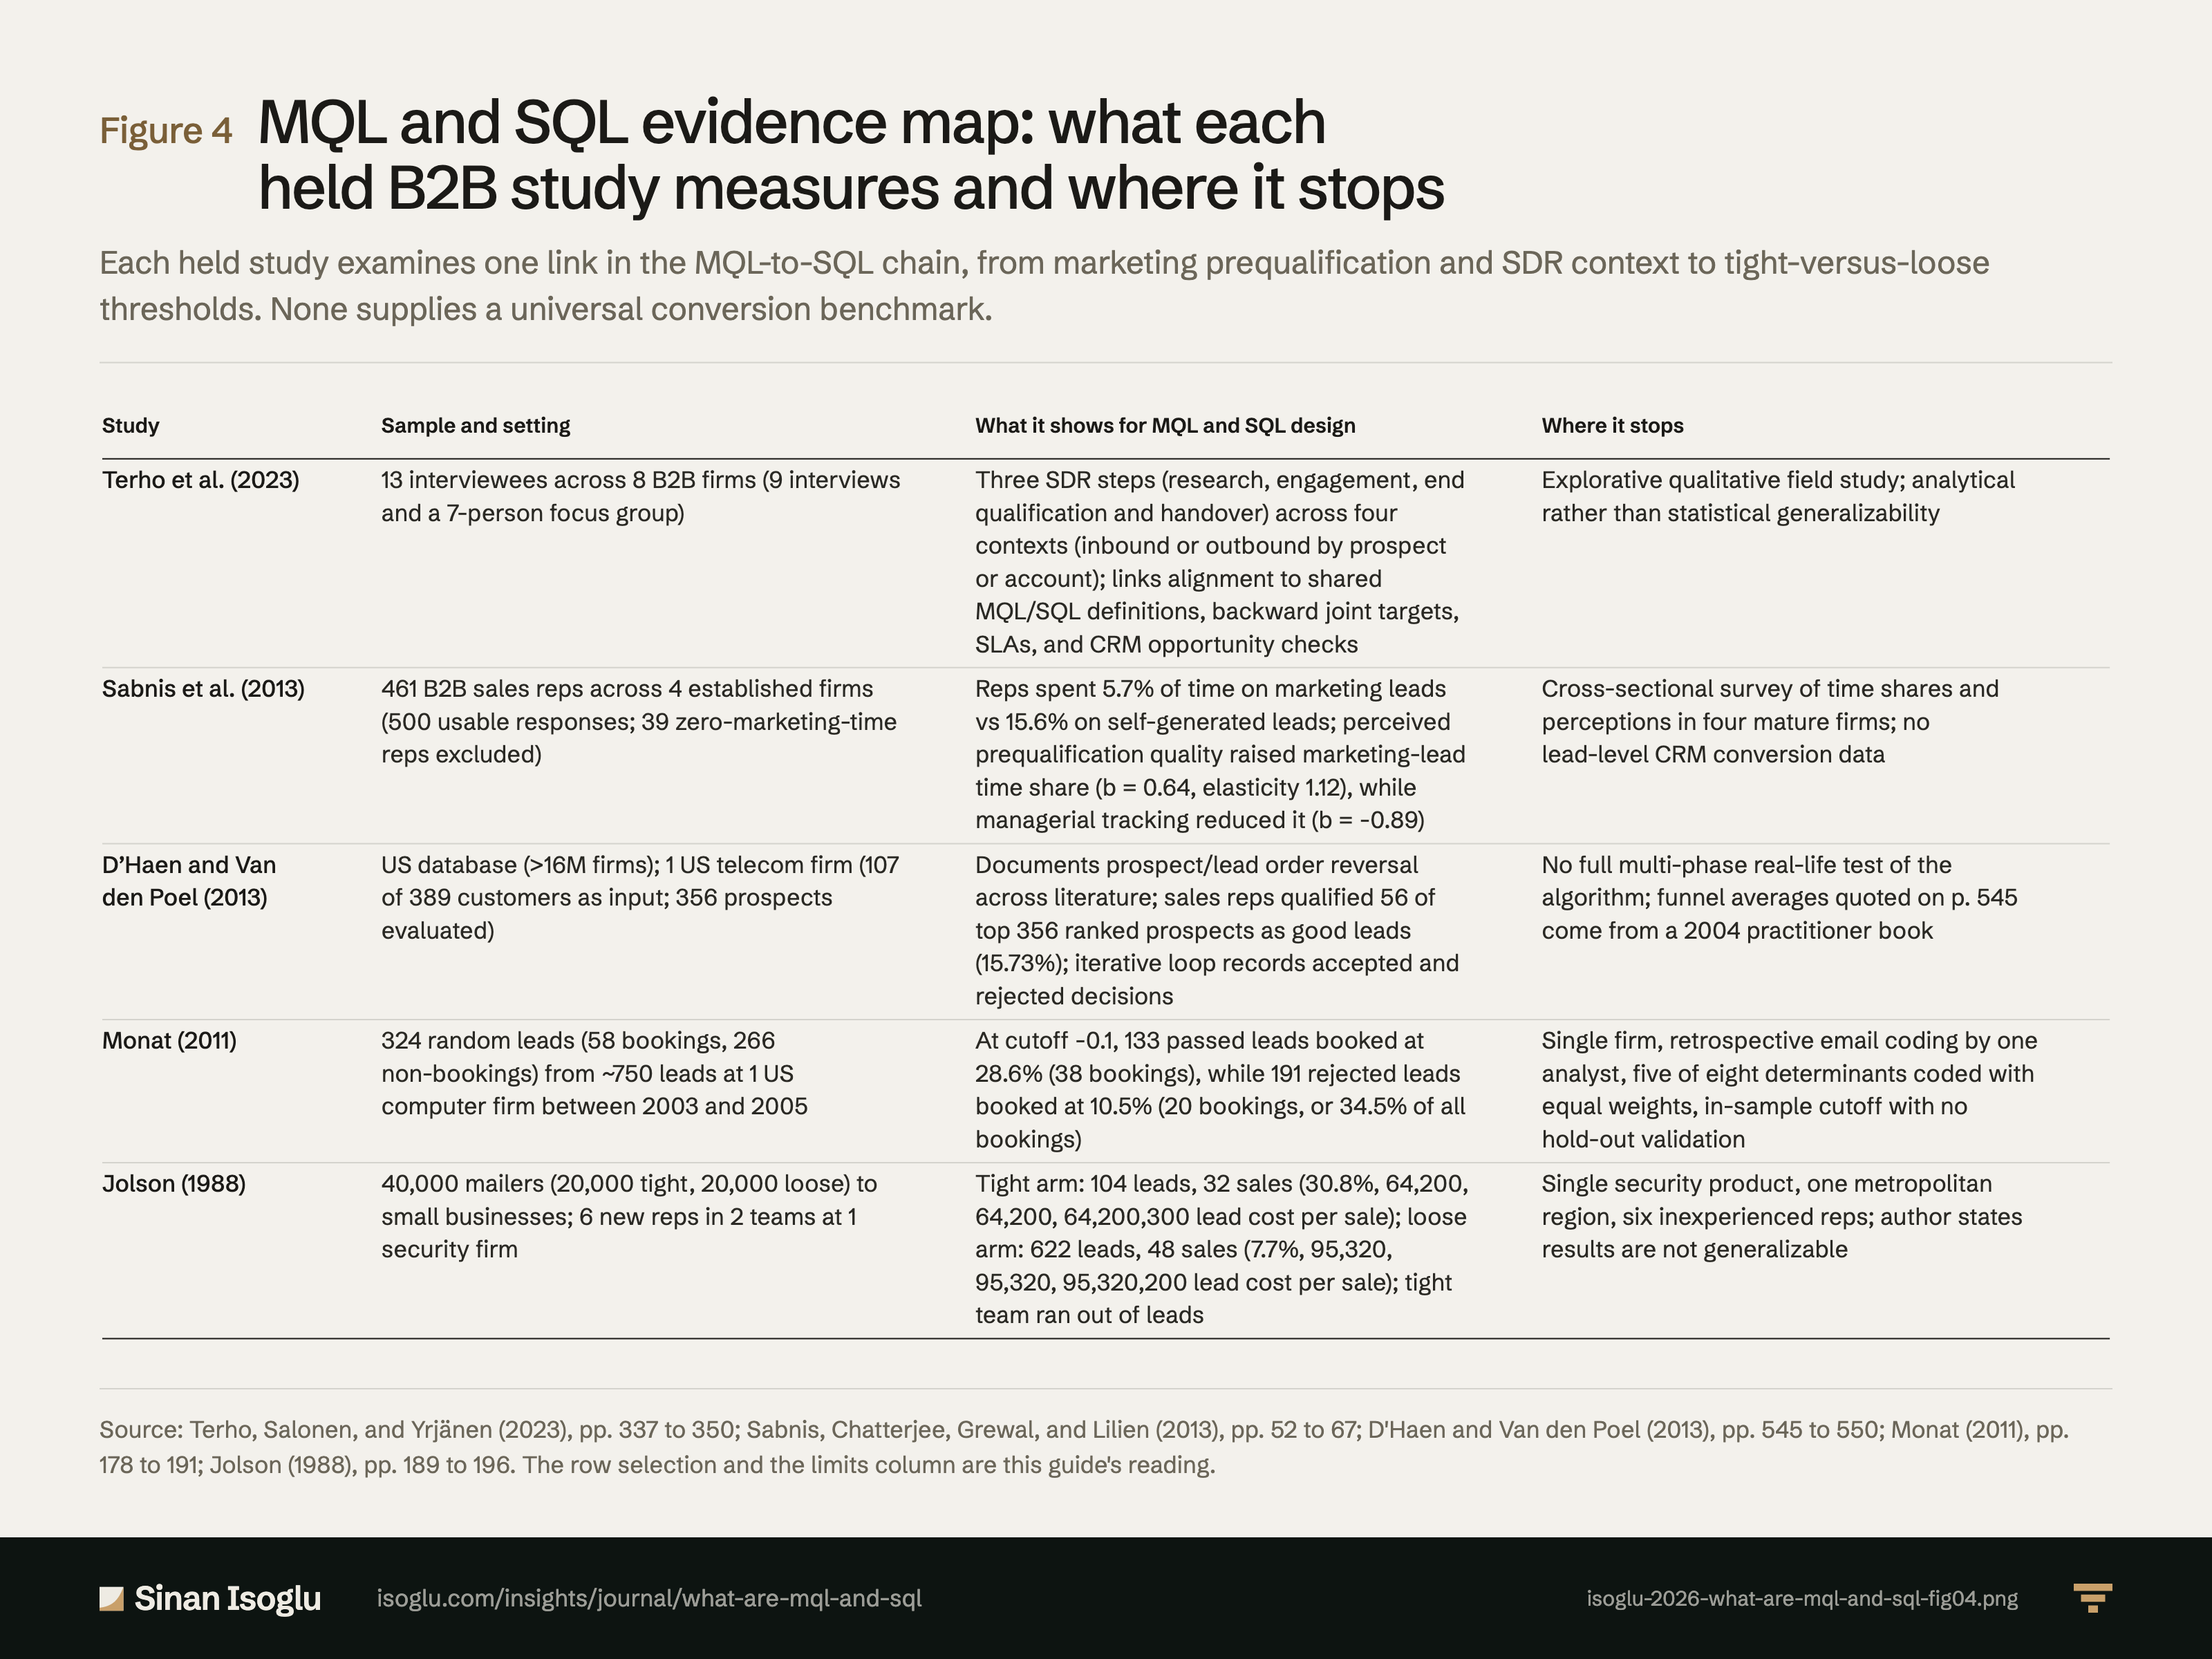
Figure 4Figure
MQL and SQL evidence map: what each held B2B study measures and where it stops
MQL and SQL: what are marketing- and sales-qualified leads?
Contact
Bring the question you're working on.
Research, a guest lecture, or a commercial question.