Figure 3From “BANT vs MEDDIC: a qualification checklist is a hypothesis”
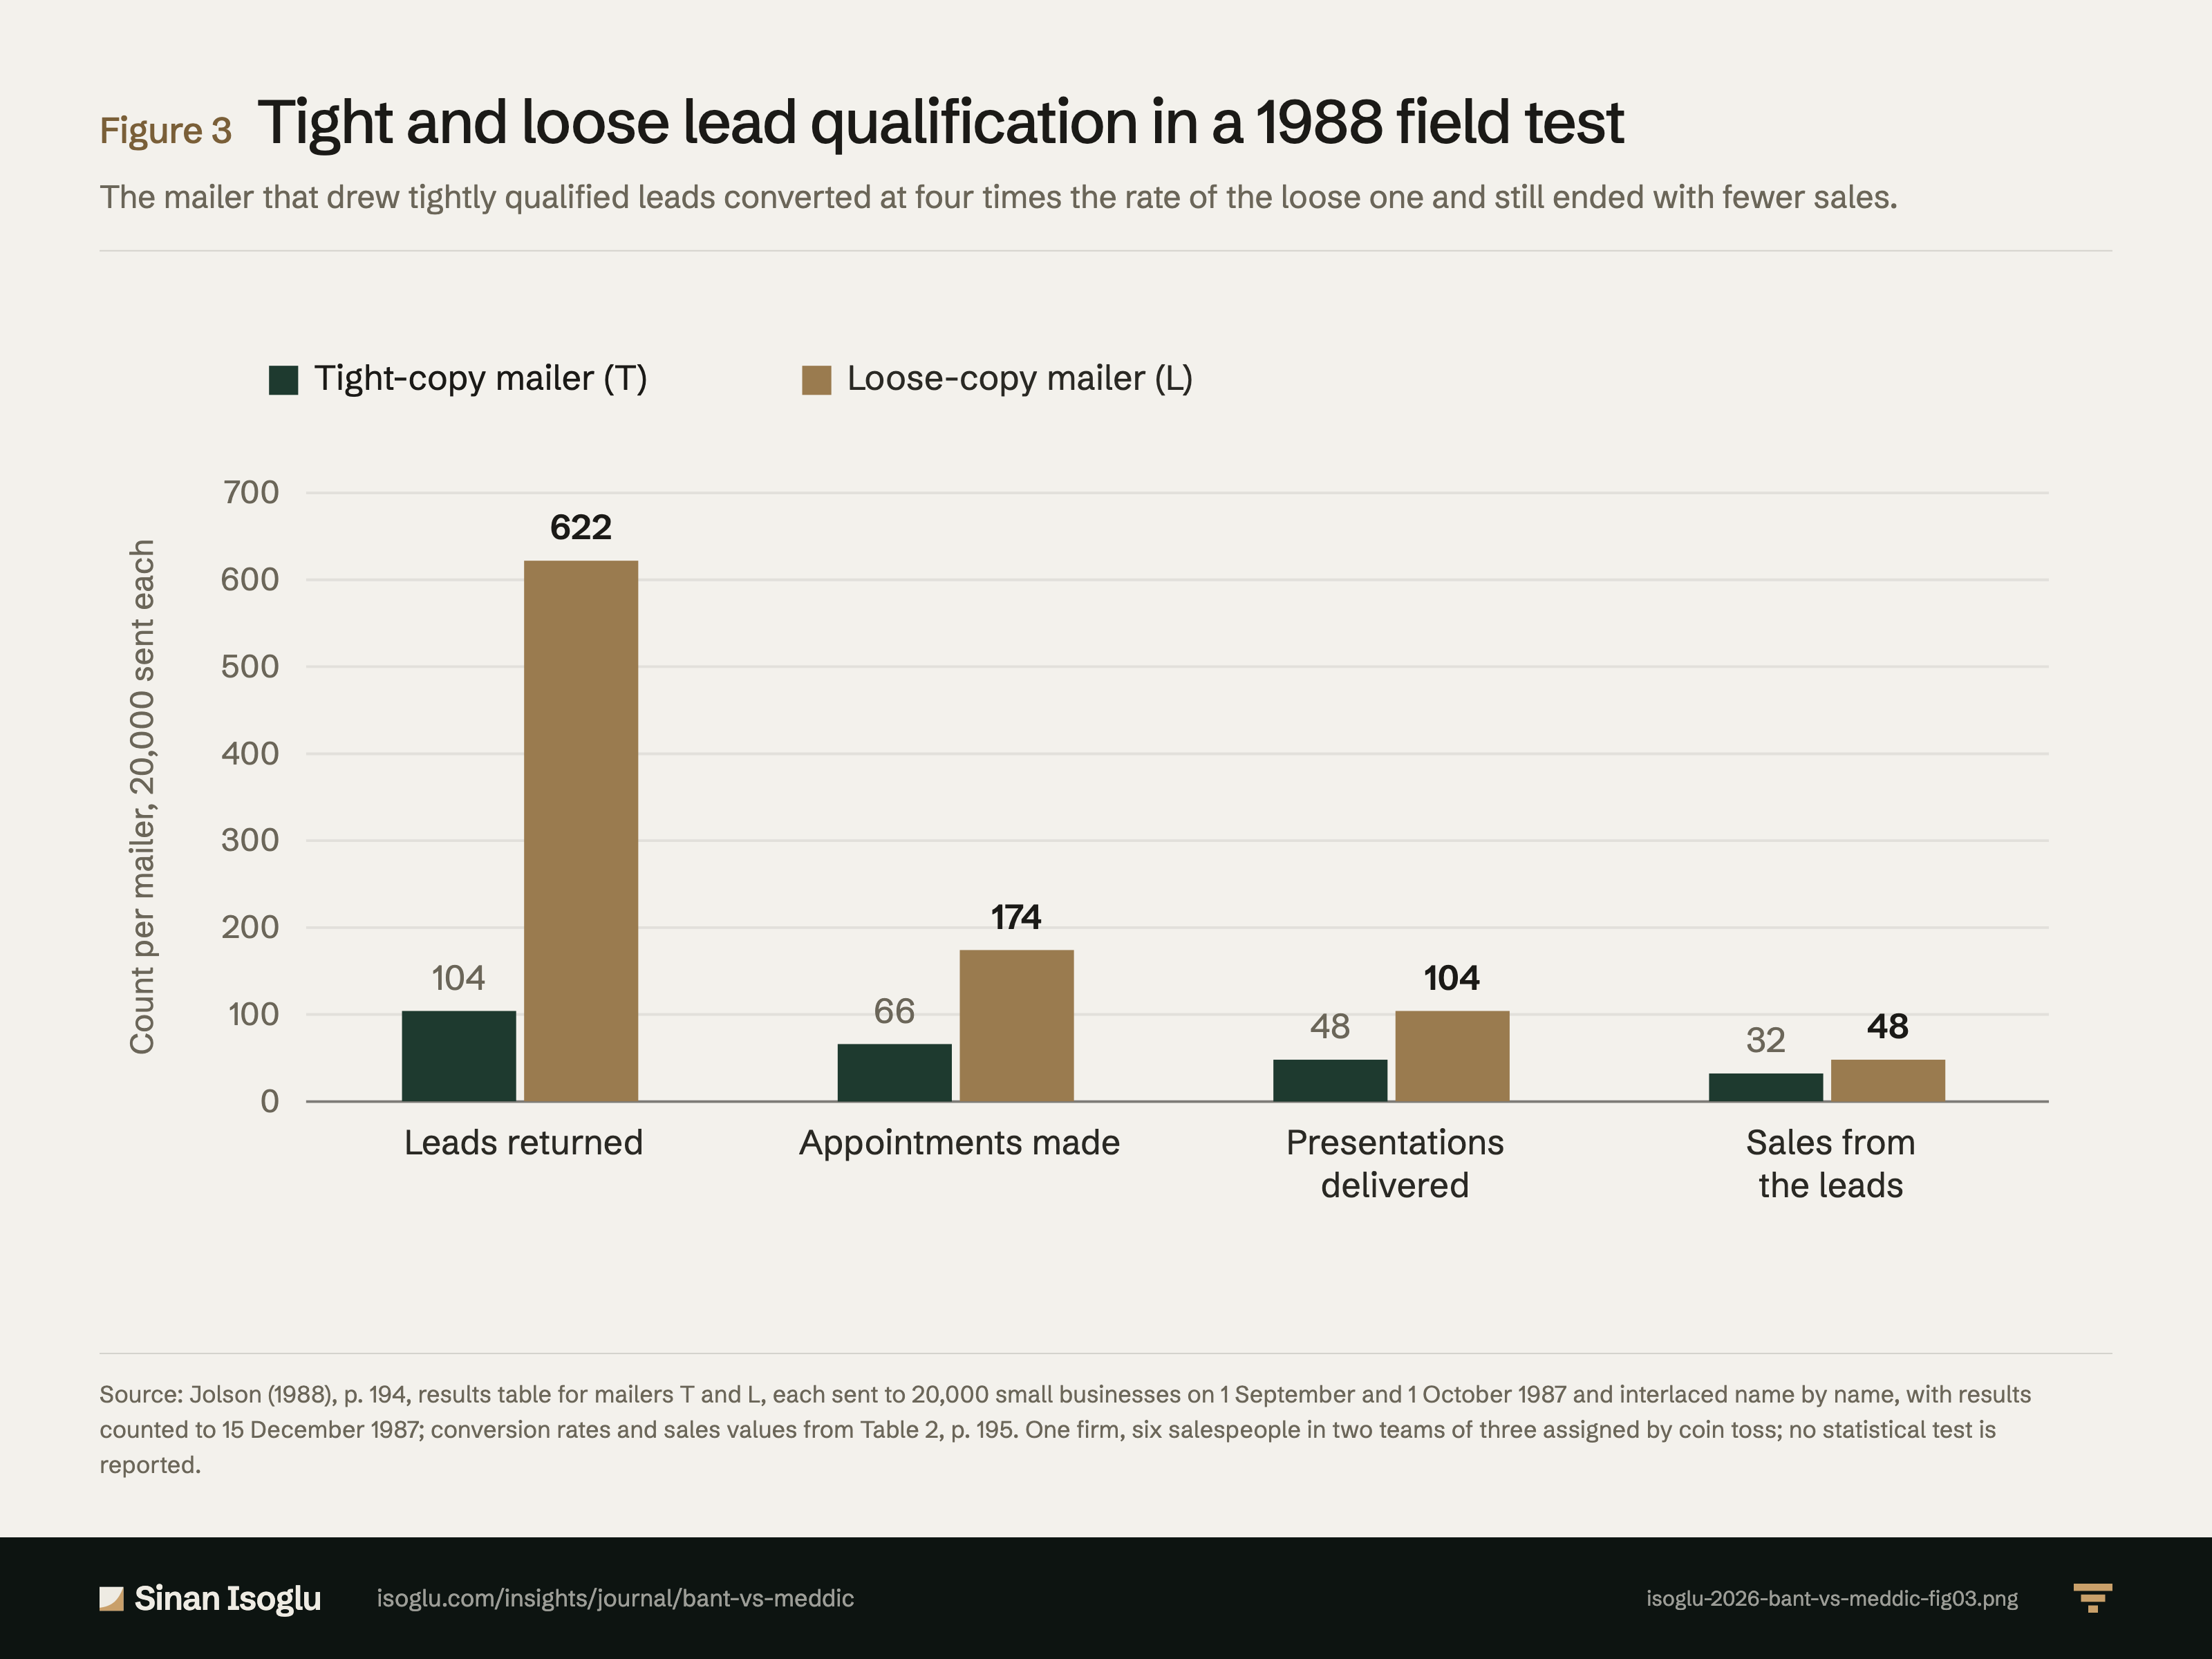
Tight and loose lead qualification in a 1988 field test
The mailer that drew tightly qualified leads converted at four times the rate of the loose one and still ended with fewer sales.
Figure 3Tight and loose lead qualification in a 1988 field test
Source: Jolson (1988), p. 194, results table for mailers T and L, each sent to 20,000 small businesses on 1 September and 1 October 1987 and interlaced name by name, with results counted to 15 December 1987; conversion rates and sales values from Table 2, p. 195. One firm, six salespeople in two teams of three assigned by coin toss; no statistical test is reported.
Source and evidence
Each line names a claim related to this exhibit, its source, and how it was checked.
- A A verified against the printed page of the primary sourceB primary source, text layer onlyC authoritative secondaryD reported Design of the 1987 field test: the author was hired as the firm's consultant; a tight mailer requesting a call about a demonstration and security analysis and a loose mailer offering a booklet, each sent to 10,000 small businesses on 1 September and 1 October 1987 (20,000 each), interlaced name by name; results counted to 15 December 1987; leads worked by six relatively inexperienced salespeople in two teams of three formed by coin toss, in a sales contest, allowed to add referrals and cold calls (pp. 193, 194): "In February 1987, the author was hired as a consultant to assist the company in introducing a direct mail circularization campaign"; "Please phone me to discuss a free demonstration and security analysis."; "Please mail me the 20-page booklet"; "of each type of circular were mailed in the firm’s market area"; "Bias was eliminated by interlacing the two types of mailers throughout the mailing list"; "it was assumed that all returns and selling activities relating to these leads would be finalized by December 15, 1987"; "All returned leads were assigned to six relatively inexperienced salespeople"; "Two teams of three people each were formed (by a coin toss), with one team assigned to work loose leads and the other to work tight leads."; "Each salesperson was promised a company-paid four-day trip to San Juan"; "the salespeople were told they were permitted to supplement their prospecting effort with customer referrals or cold calling"Jolson (1988)
- A A verified against the printed page of the primary sourceB primary source, text layer onlyC authoritative secondaryD reported Results, read from the page images of pp. 194 and 195: leads returned 104 (tight) and 622 (loose), appointments 66 and 174, presentations 48 and 104, sales on leads 32 and 48, other sales 3 and 4; Table 2: sales from leads $64,200 and $95,320, salesperson earnings $10,144 and $12,761, sales per lead 30.8% and 7.7%, sales per presentation 66.7% and 46.2%, cost per lead $92.30 and $15.43, lead cost per sale $300.00 and $200.00; the tight team ran out of places to go; loose leads produced more volume, earnings and returns at lower cost per sale, tight leads a higher conversion rate and more motivation (pp. 194 to 196): "A Comparison of Tight vs. Loose Sales Leads"; "Almost one third of the T leads were converted into sales, whereas 13 loose leads were required for a sale."; "The sales emerging from tight leads cost 50% more."; "The T sales group seemed to run out of places to go and demonstrated little initiative and weak work habits in developing their own prospects."; "loose leads produced more sales volume, higher earnings for salespeople, a larger lead return rate, a lower lead cost per sale, and a lower compensation-cost ratio"; "Tight leads produced a higher conversion rate into sales and an increased level of motivation for sales force members."Jolson (1988)
From the essay
Revenue operations & AI
BANT vs MEDDIC: a qualification checklist is a hypothesis
BANT checks budget, authority, need and timing; MEDDIC maps how a buying group decides. In a 1988 field test, tight leads converted better and sold less.
Read the essayThis exhibit belongs to an essay: the numbers live here, the argument lives there.
Cite or embed
Related exhibits
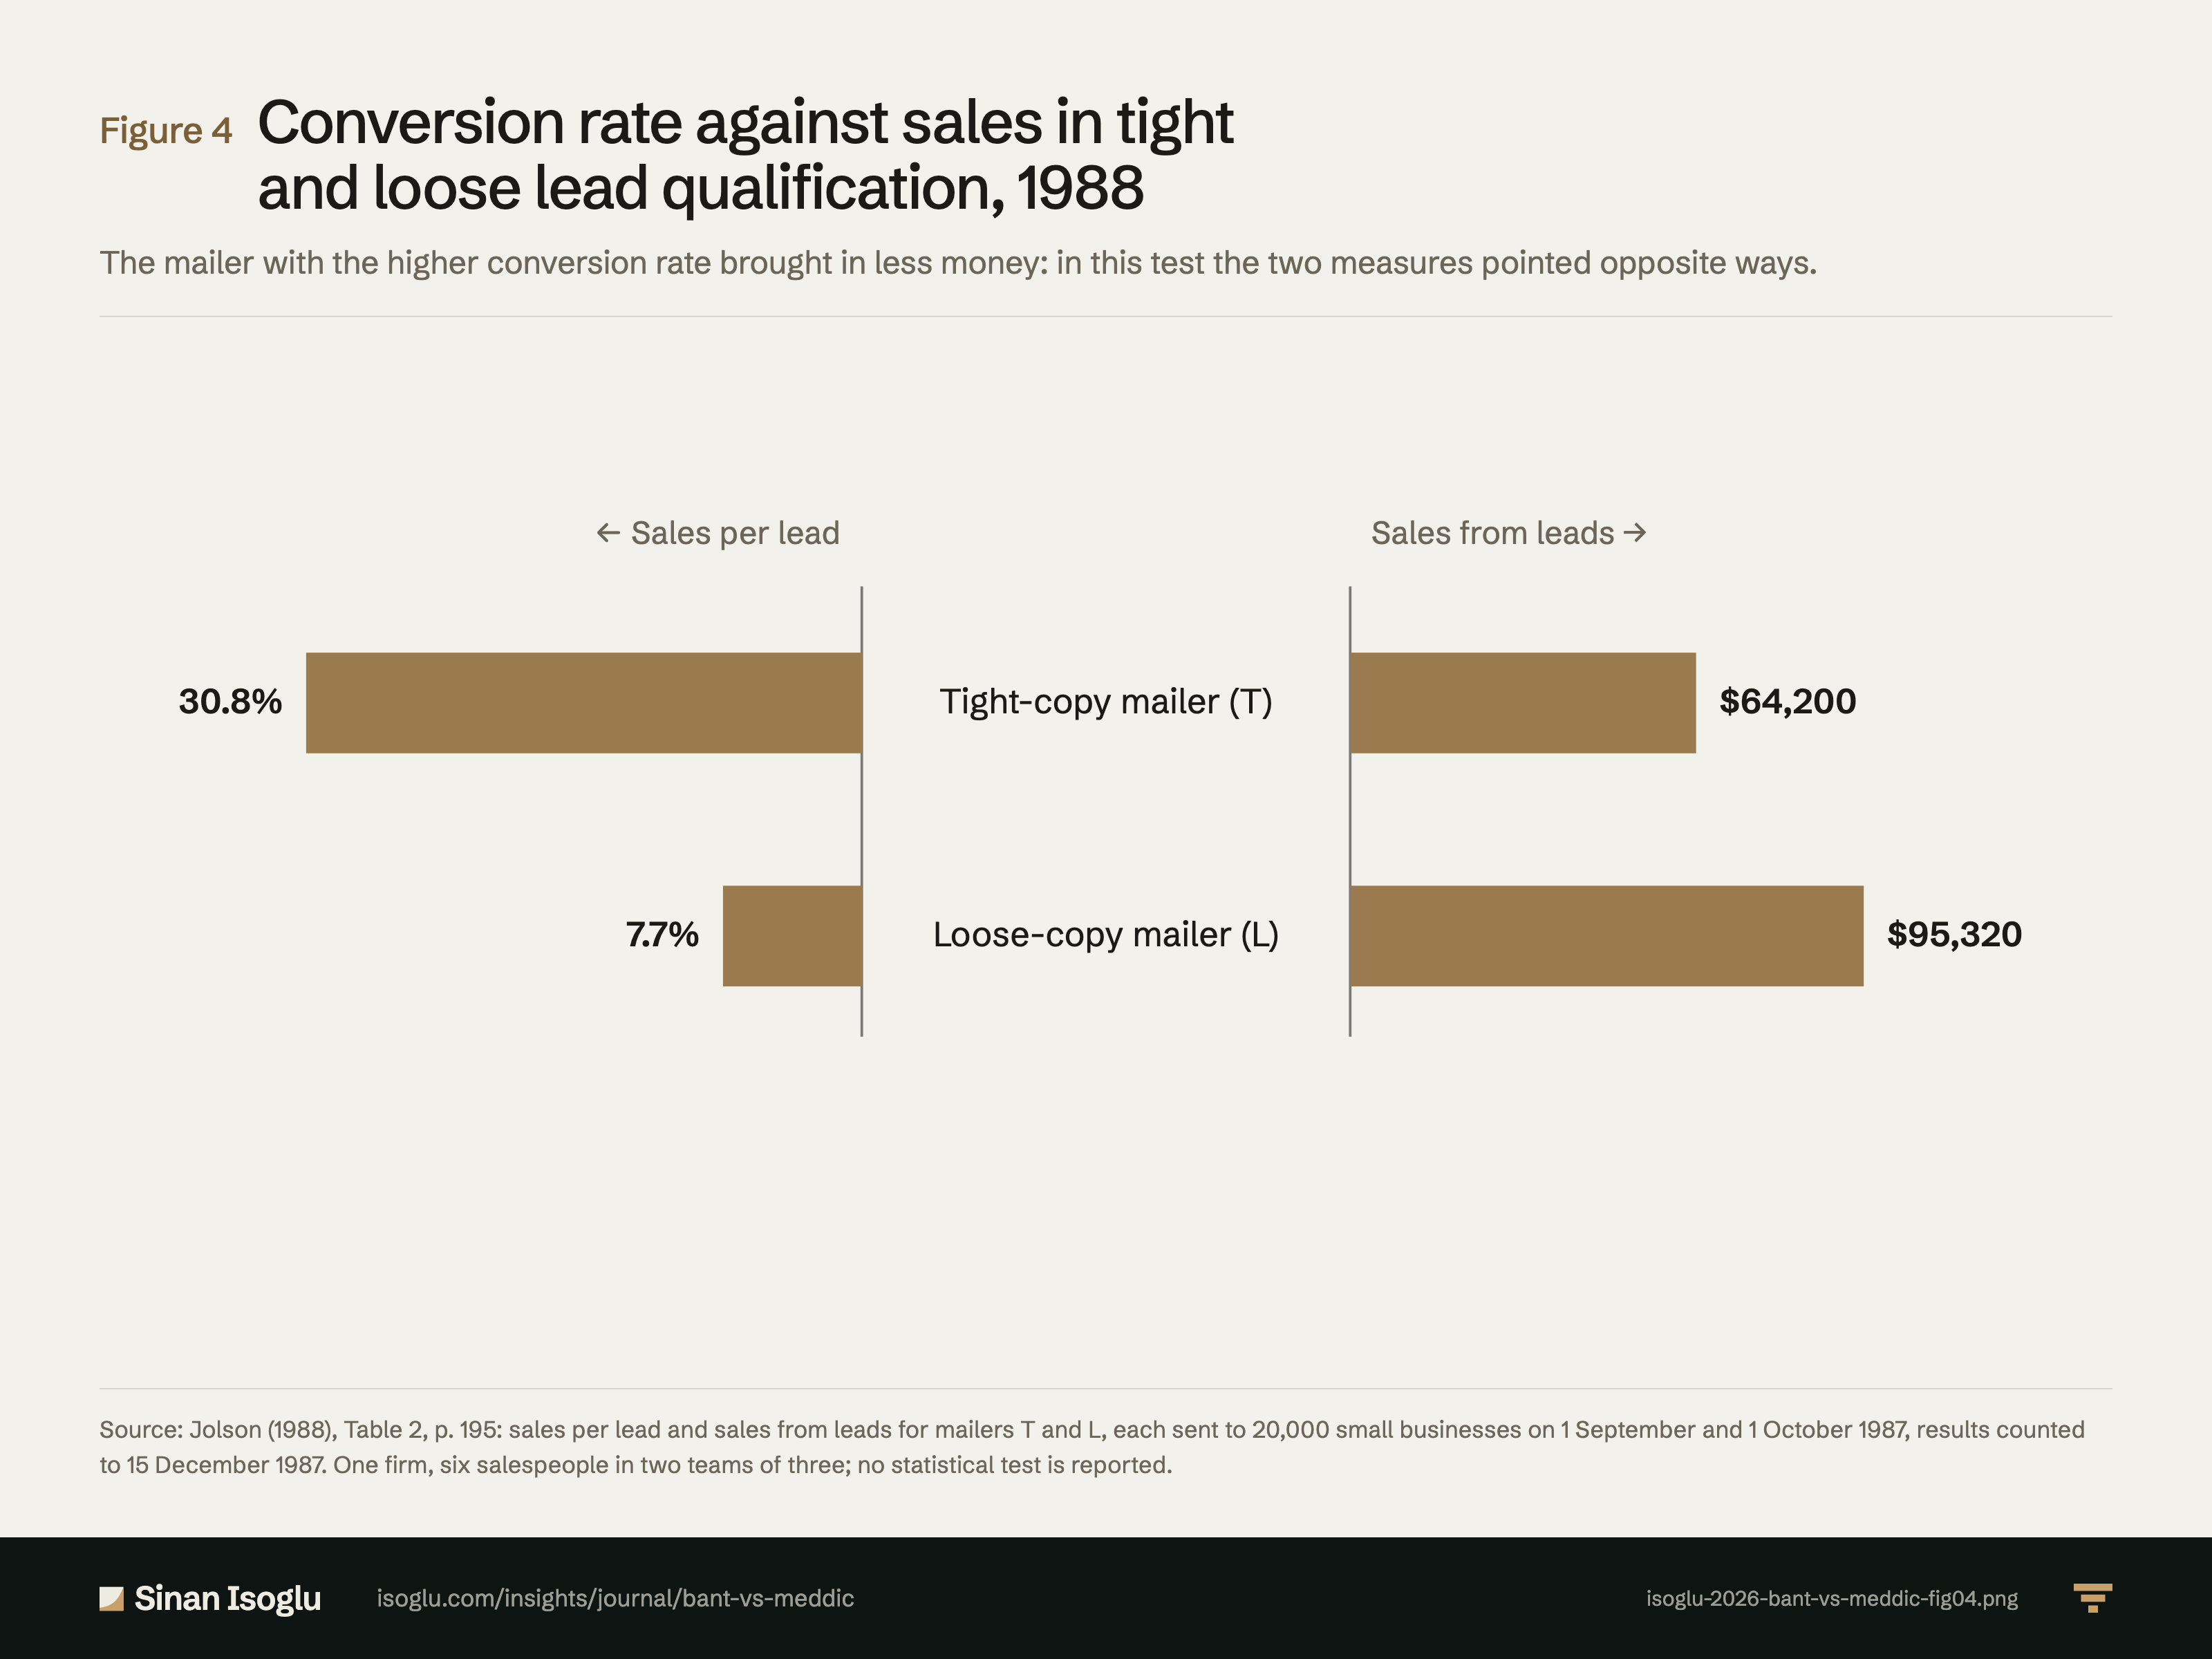
Figure 4Figure
Conversion rate against sales in tight and loose lead qualification, 1988
BANT vs MEDDIC: a qualification checklist is a hypothesis
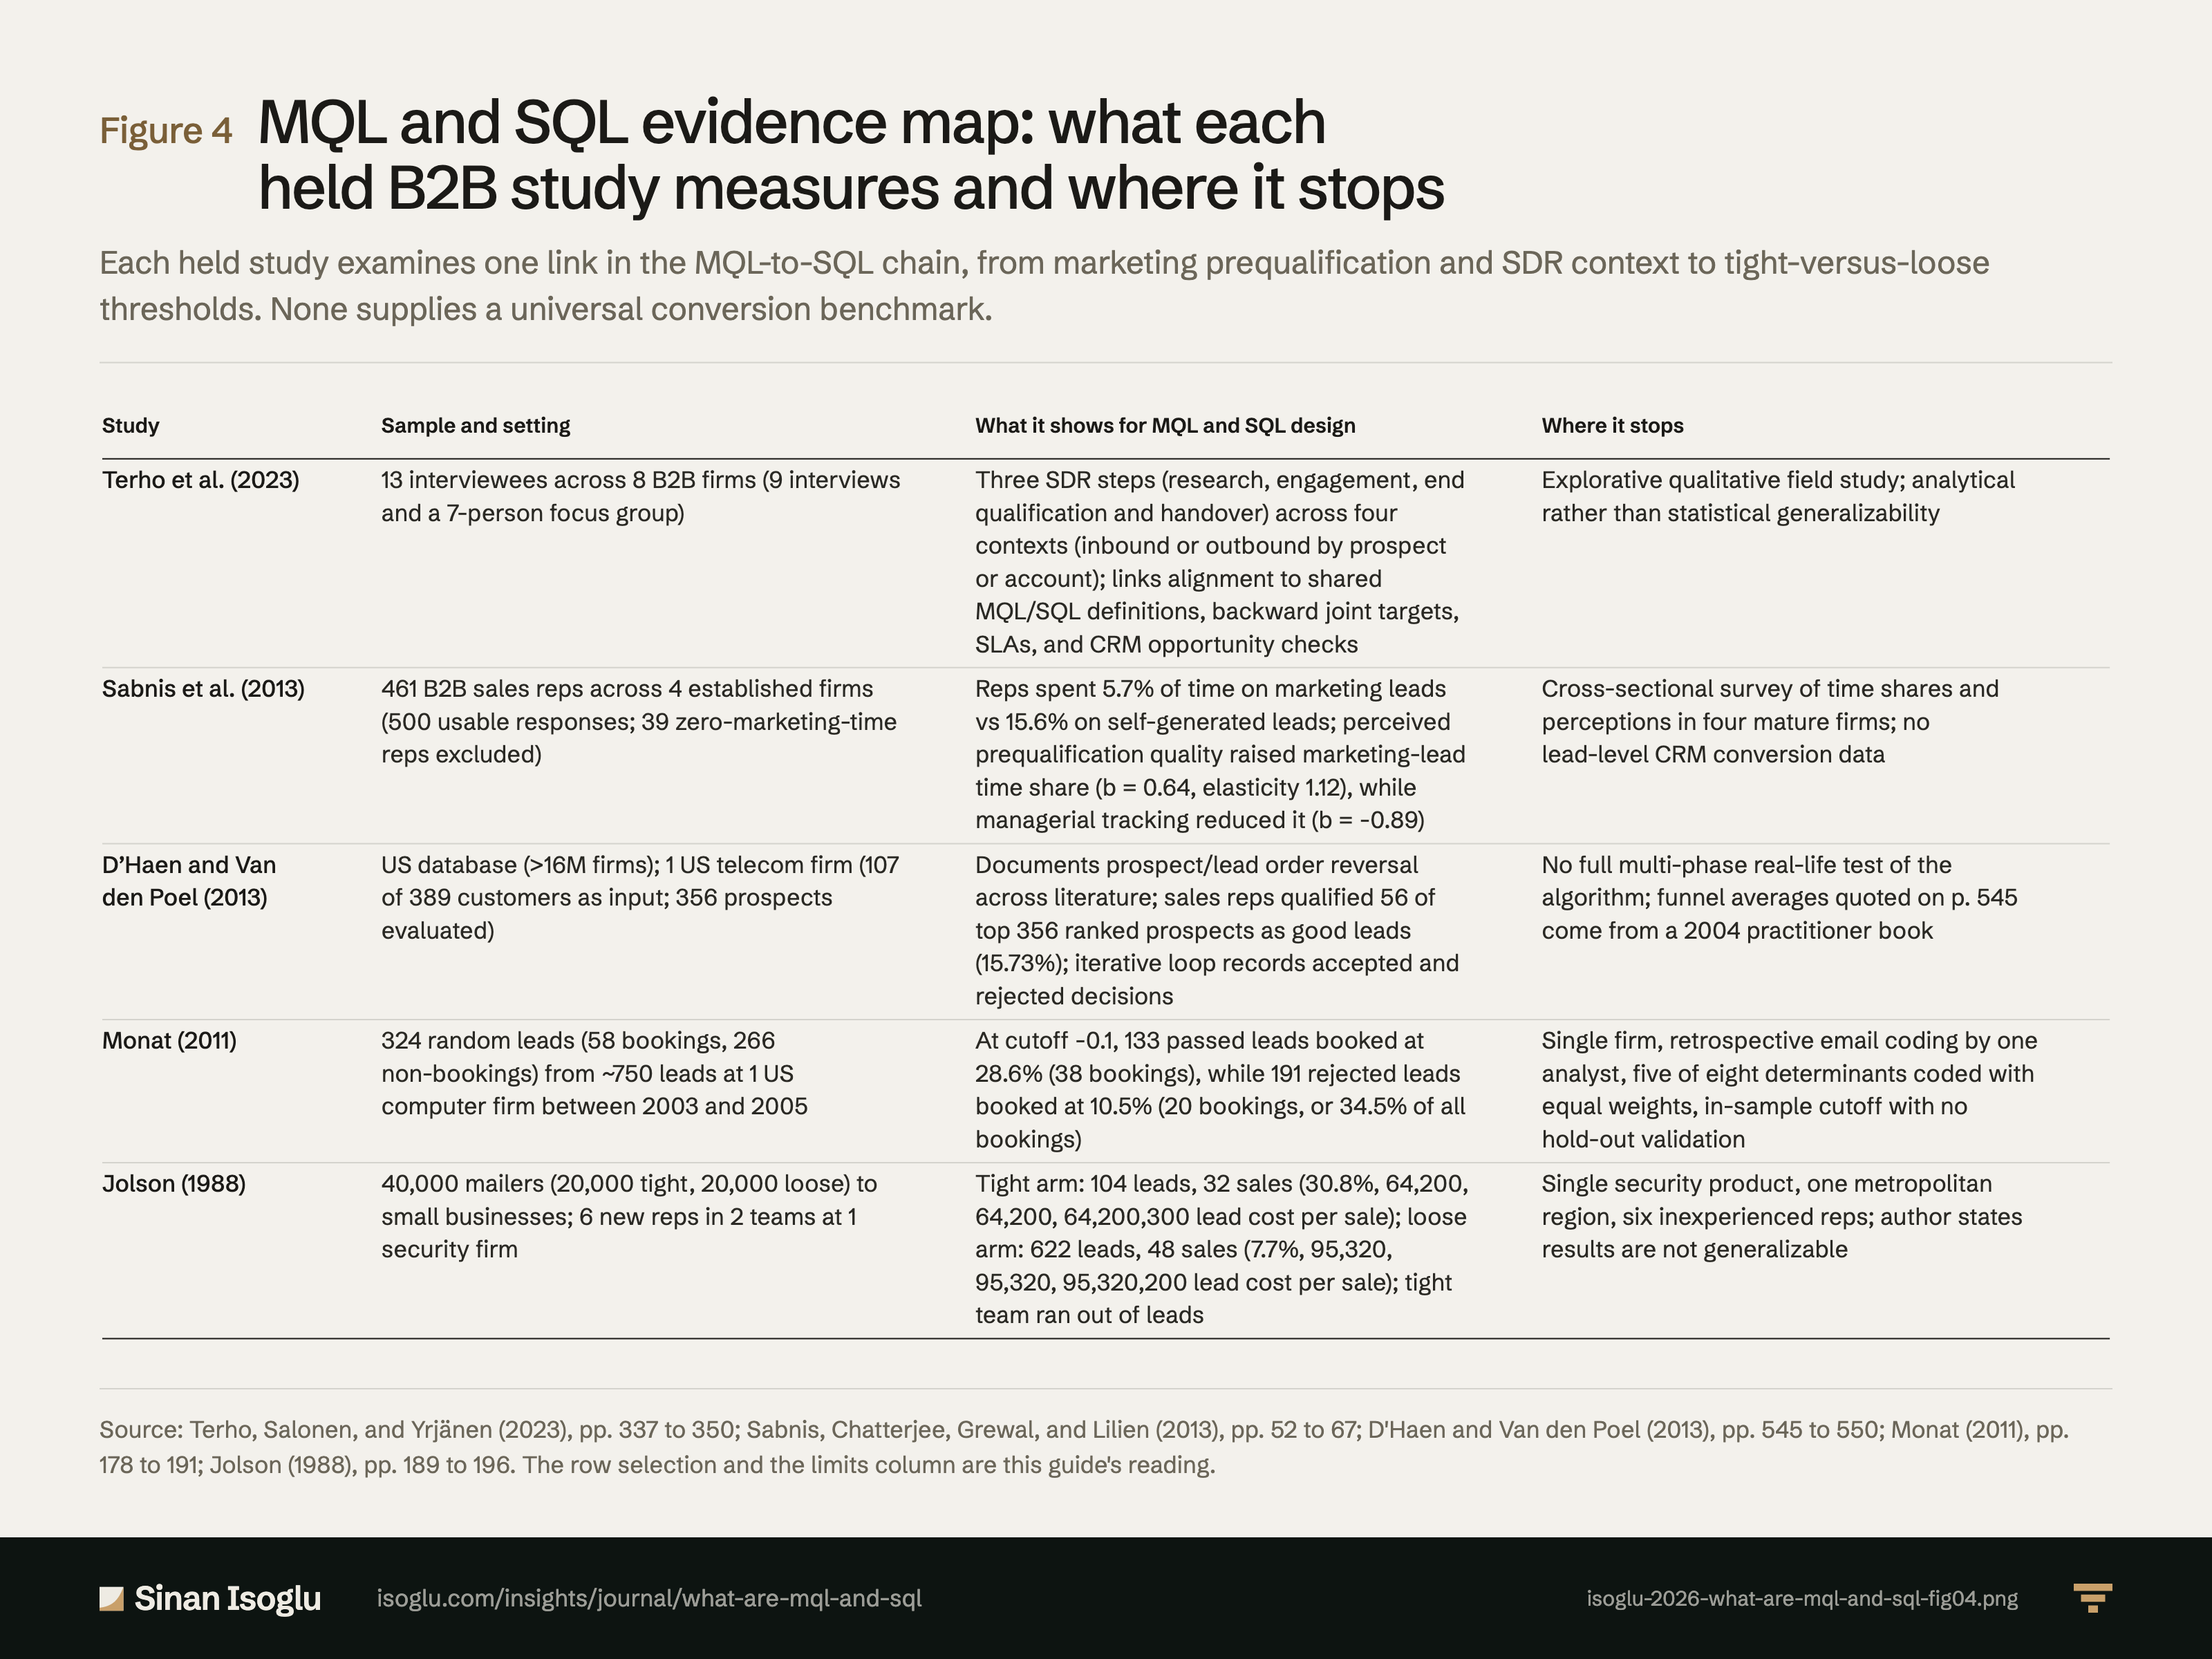
Figure 4Figure
MQL and SQL evidence map: what each held B2B study measures and where it stops
MQL and SQL: what are marketing- and sales-qualified leads?
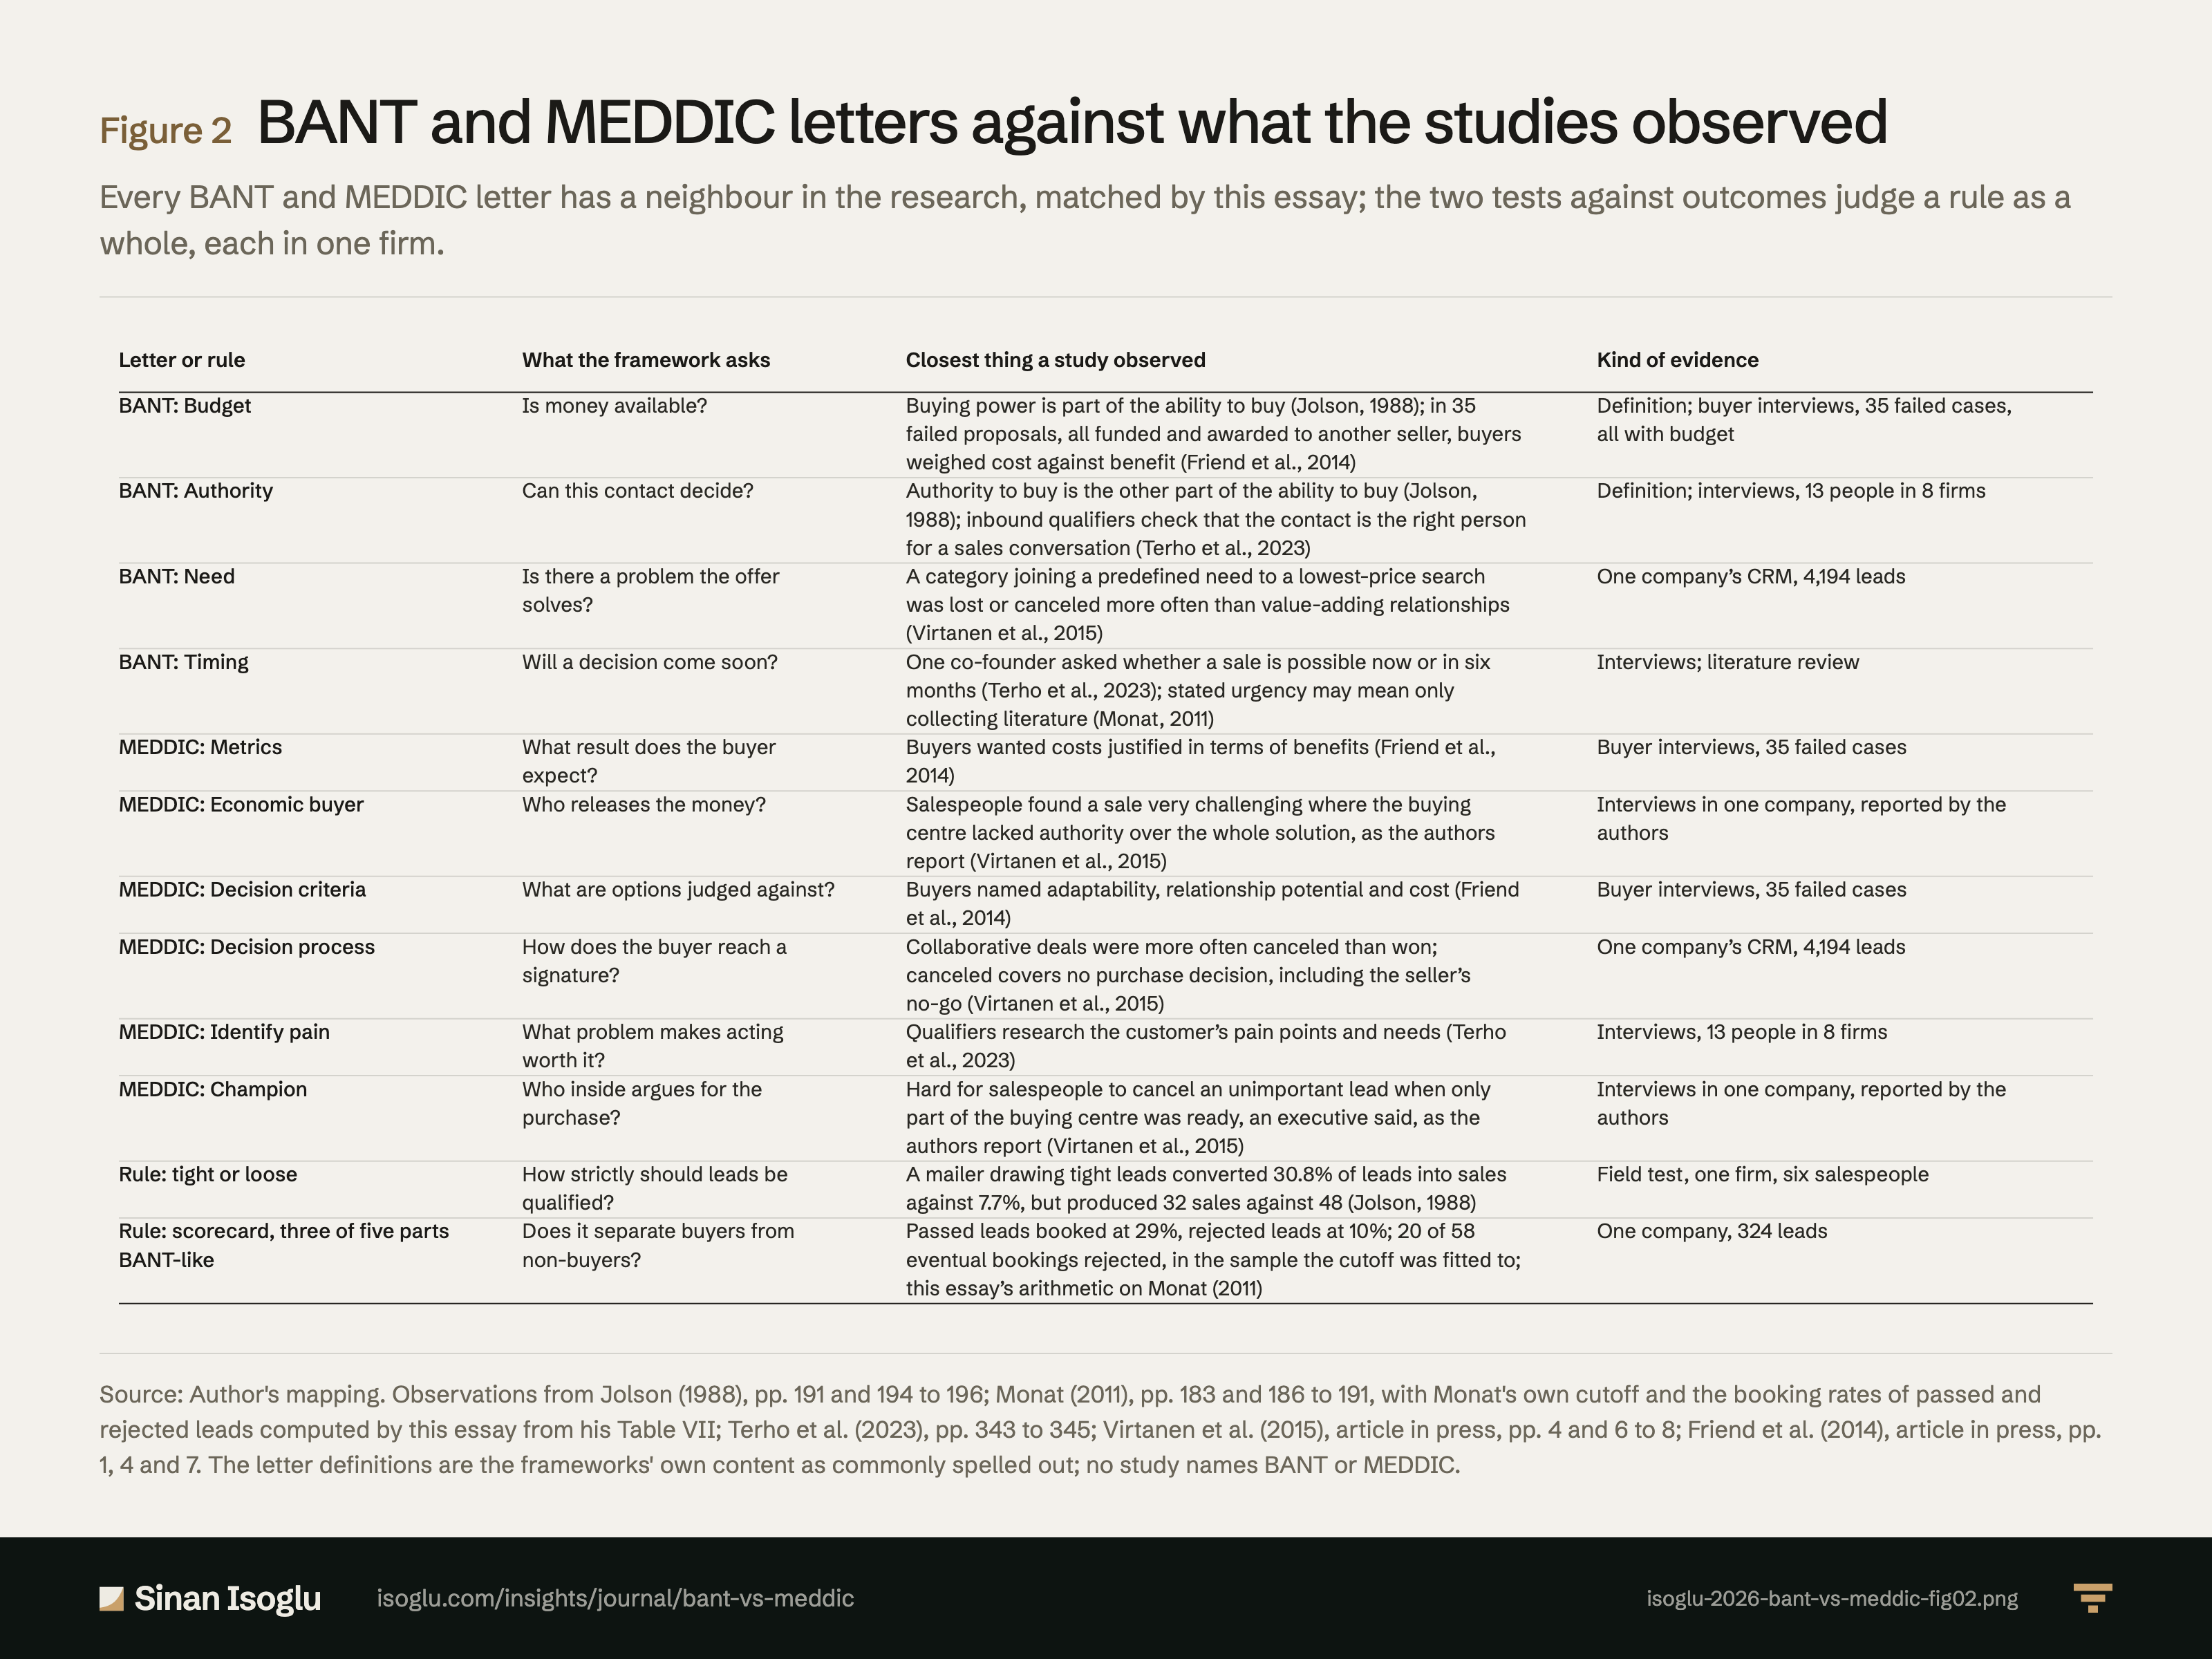
Figure 2Figure
BANT and MEDDIC letters against what the studies observed
BANT vs MEDDIC: a qualification checklist is a hypothesis
Contact
Bring the question you're working on.
Research, a guest lecture, or a commercial question.