Abbildung 4Aus „BANT oder MEDDIC? Jede Qualifikationsregel ist eine Hypothese“
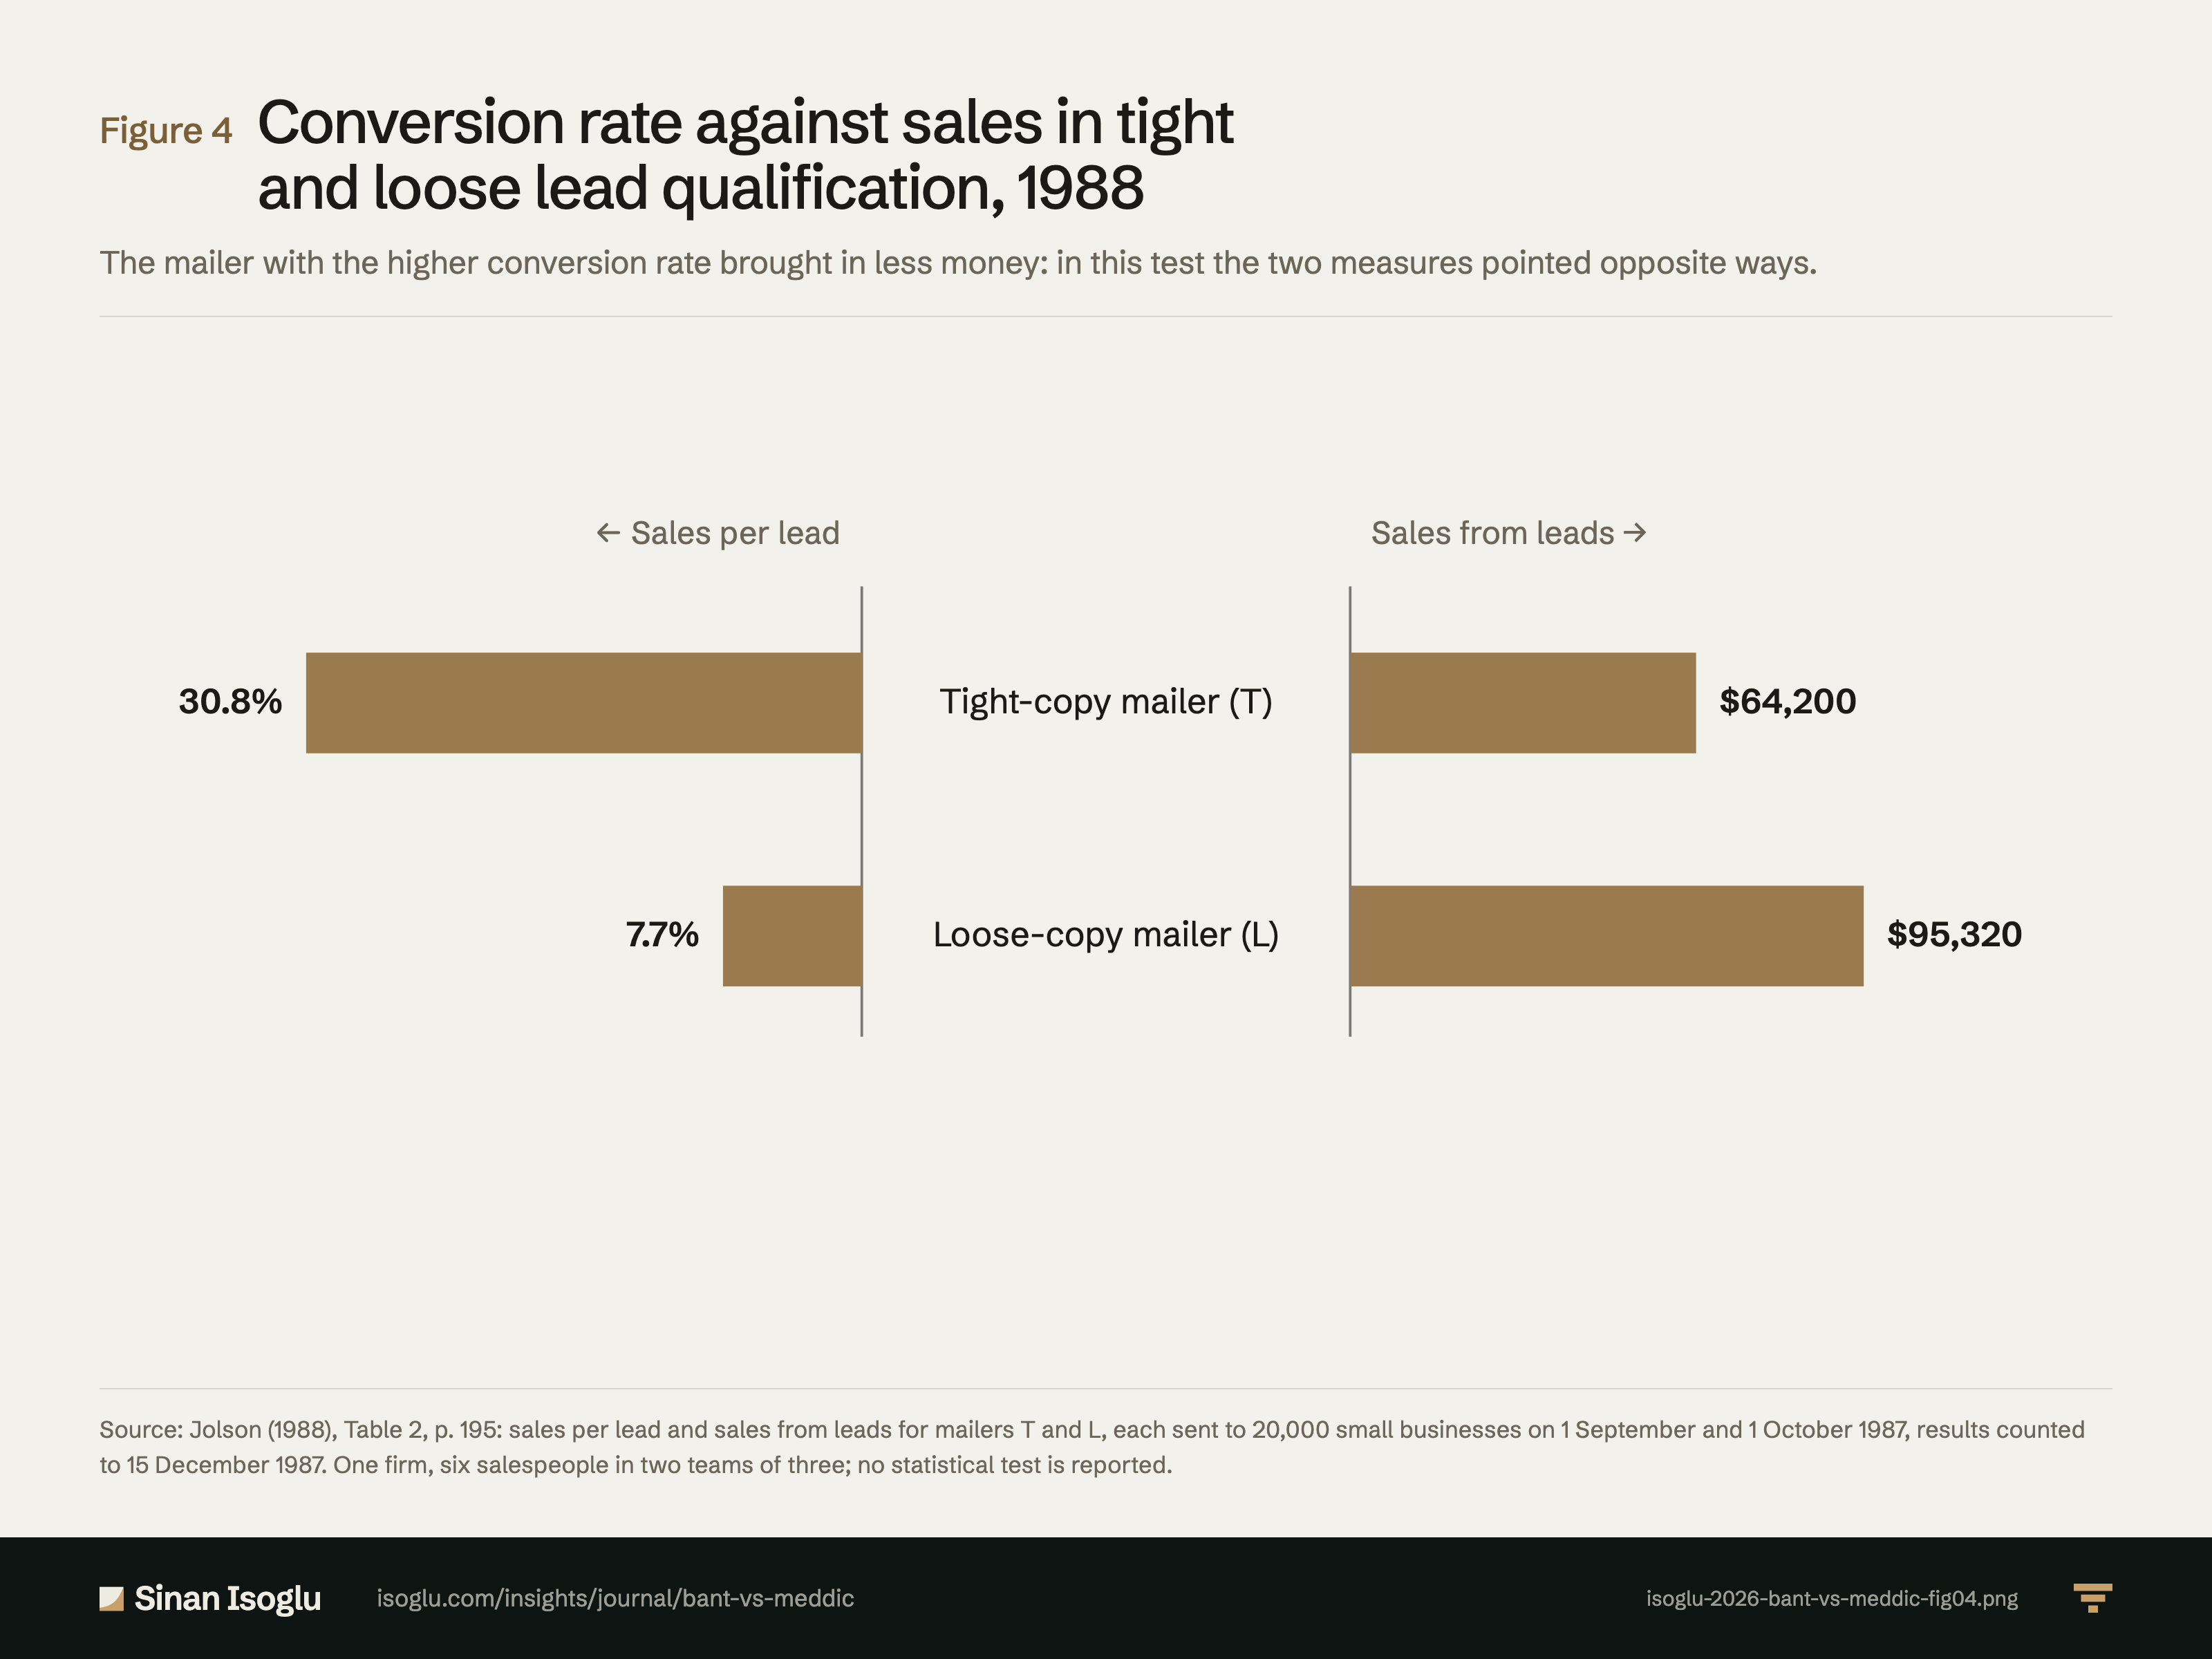
Abschlussquote gegen Umsatz bei strenger und lockerer Lead-Qualifizierung, 1988
Das Mailing mit der höheren Abschlussquote brachte weniger Geld: In diesem Test zeigten die beiden Größen in entgegengesetzte Richtungen.
Abbildung 4Abschlussquote gegen Umsatz bei strenger und lockerer Lead-Qualifizierung, 1988
Quelle: Jolson (1988), Tabelle 2, S. 195: Abschlüsse je Lead und Umsatz aus Leads für die Mailings T und L, je an 20.000 kleine Unternehmen am 1. September und 1. Oktober 1987 versandt, Ergebnisse bis 15. Dezember 1987. Ein Unternehmen, sechs Vertriebsmitarbeitende in zwei Dreierteams; ein statistischer Test wird nicht berichtet.
Quelle und Evidenz
Jede Zeile nennt eine Aussage zu dieser Abbildung, ihre Quelle und die Art ihrer Prüfung.
- A A gegen die gedruckte Seite der Primärquelle geprüftB Primärquelle, nur TextebeneC belastbare SekundärquelleD berichtet Results, read from the page images of pp. 194 and 195: leads returned 104 (tight) and 622 (loose), appointments 66 and 174, presentations 48 and 104, sales on leads 32 and 48, other sales 3 and 4; Table 2: sales from leads $64,200 and $95,320, salesperson earnings $10,144 and $12,761, sales per lead 30.8% and 7.7%, sales per presentation 66.7% and 46.2%, cost per lead $92.30 and $15.43, lead cost per sale $300.00 and $200.00; the tight team ran out of places to go; loose leads produced more volume, earnings and returns at lower cost per sale, tight leads a higher conversion rate and more motivation (pp. 194 to 196): "A Comparison of Tight vs. Loose Sales Leads"; "Almost one third of the T leads were converted into sales, whereas 13 loose leads were required for a sale."; "The sales emerging from tight leads cost 50% more."; "The T sales group seemed to run out of places to go and demonstrated little initiative and weak work habits in developing their own prospects."; "loose leads produced more sales volume, higher earnings for salespeople, a larger lead return rate, a lower lead cost per sale, and a lower compensation-cost ratio"; "Tight leads produced a higher conversion rate into sales and an increased level of motivation for sales force members."Jolson (1988)
Aus dem Beitrag
Revenue Operations & KI
BANT oder MEDDIC? Jede Qualifikationsregel ist eine Hypothese
BANT prüft Budget, Befugnis, Bedarf und Zeitpunkt, MEDDIC das Buying Center. 1988 konvertierten strenge Leads im Feldexperiment besser, bei weniger Umsatz.
Den Beitrag lesenDiese Abbildung gehört zu einem Essay: Die Zahlen stehen hier, das Argument dort.
Zitieren oder einbetten
Verwandte Abbildungen
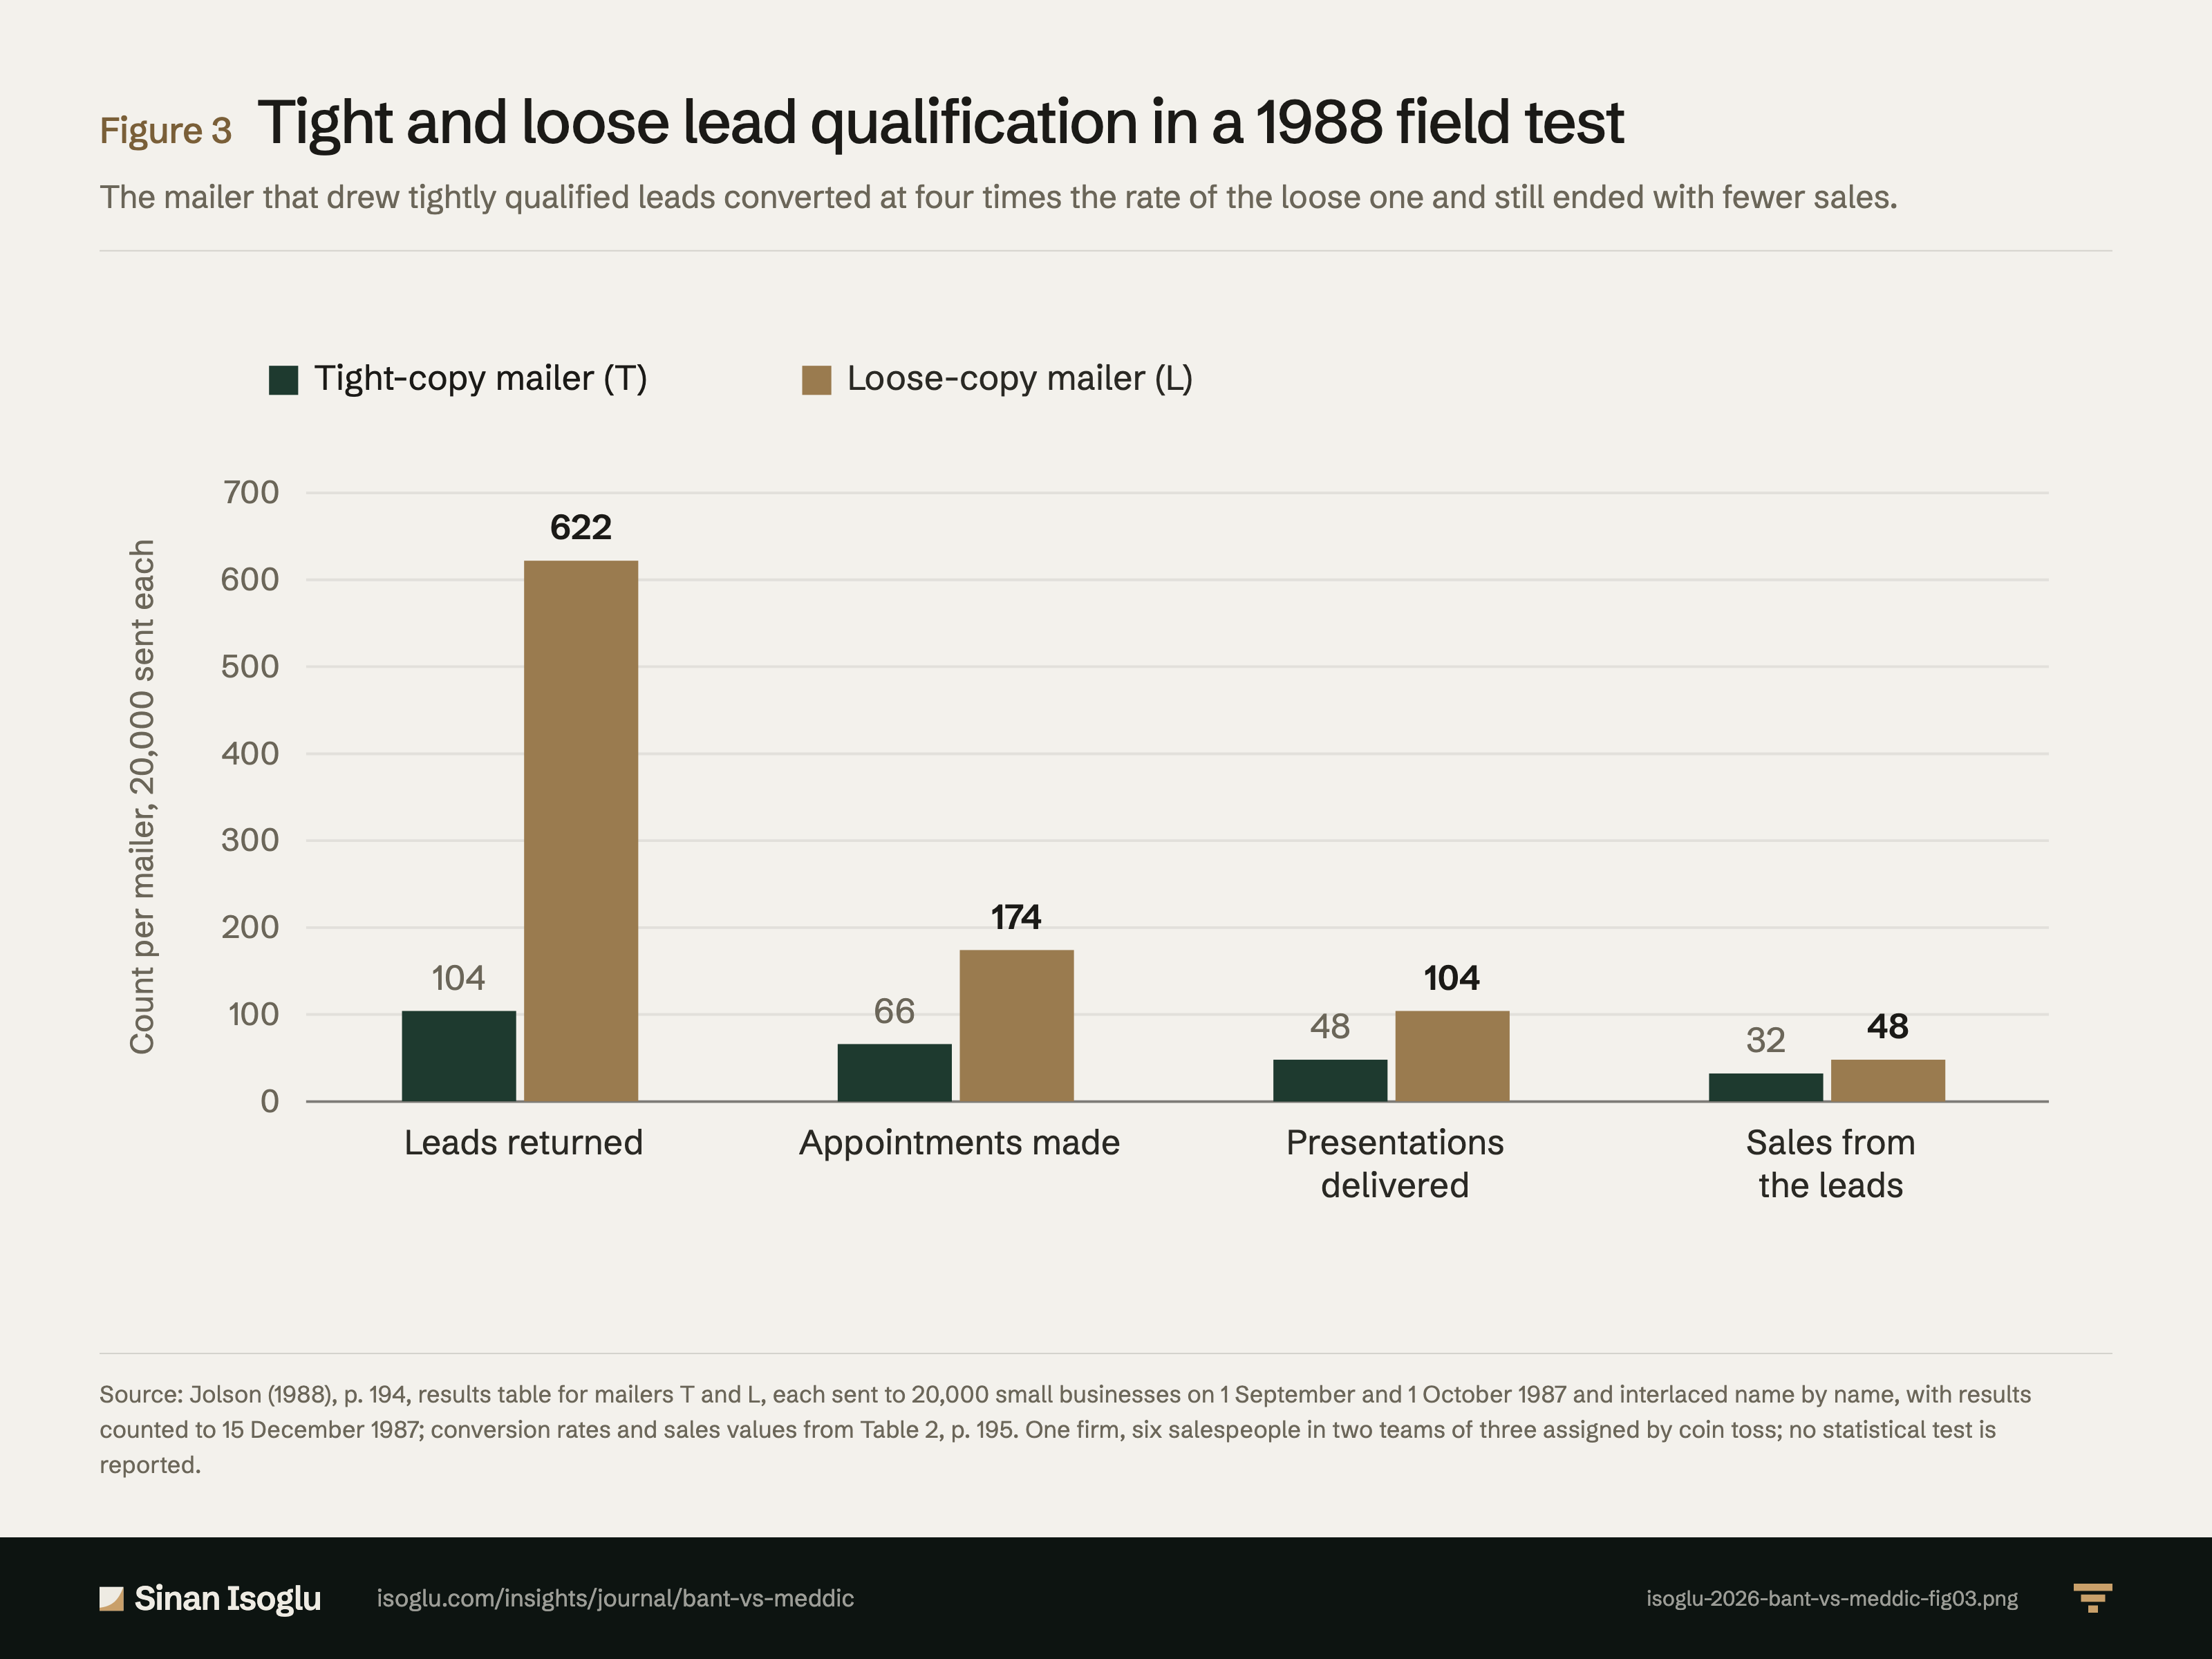
Abbildung 3Grafik
Strenge und lockere Lead-Qualifizierung in einem Feldexperiment von 1988
BANT oder MEDDIC? Jede Qualifikationsregel ist eine Hypothese
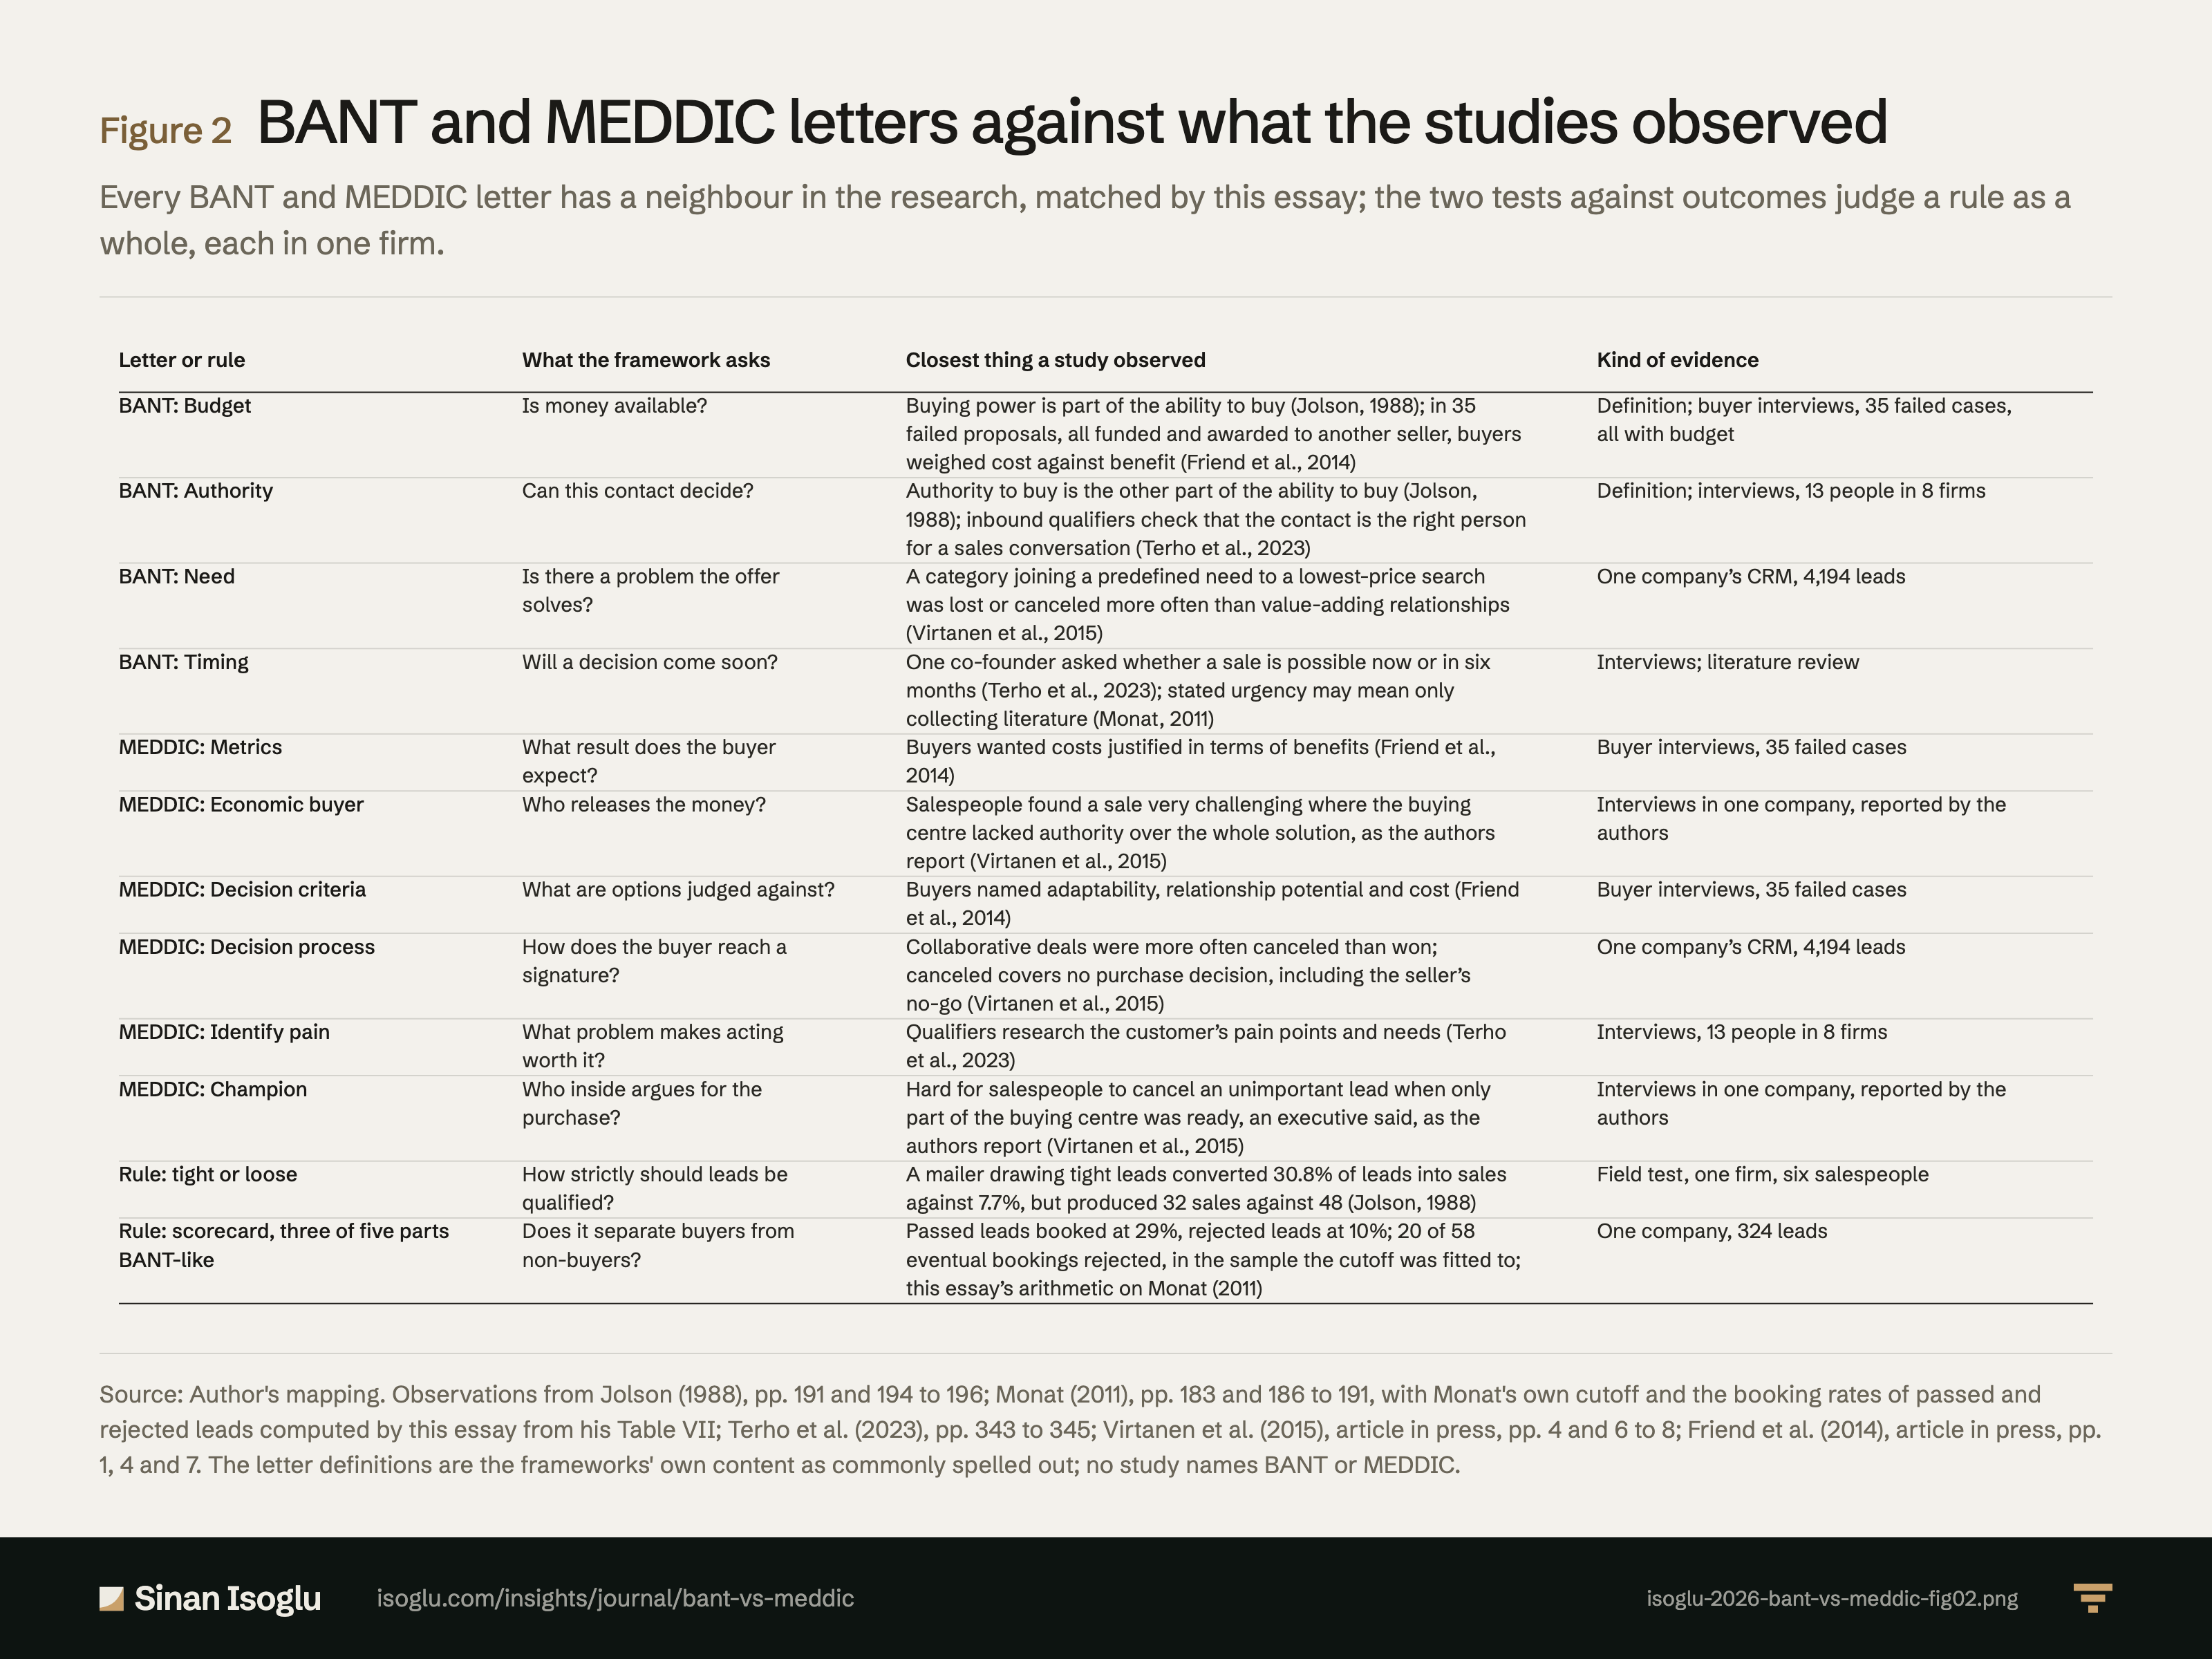
Abbildung 2Grafik
Buchstaben von BANT und MEDDIC und was die Studien beobachtet haben
BANT oder MEDDIC? Jede Qualifikationsregel ist eine Hypothese
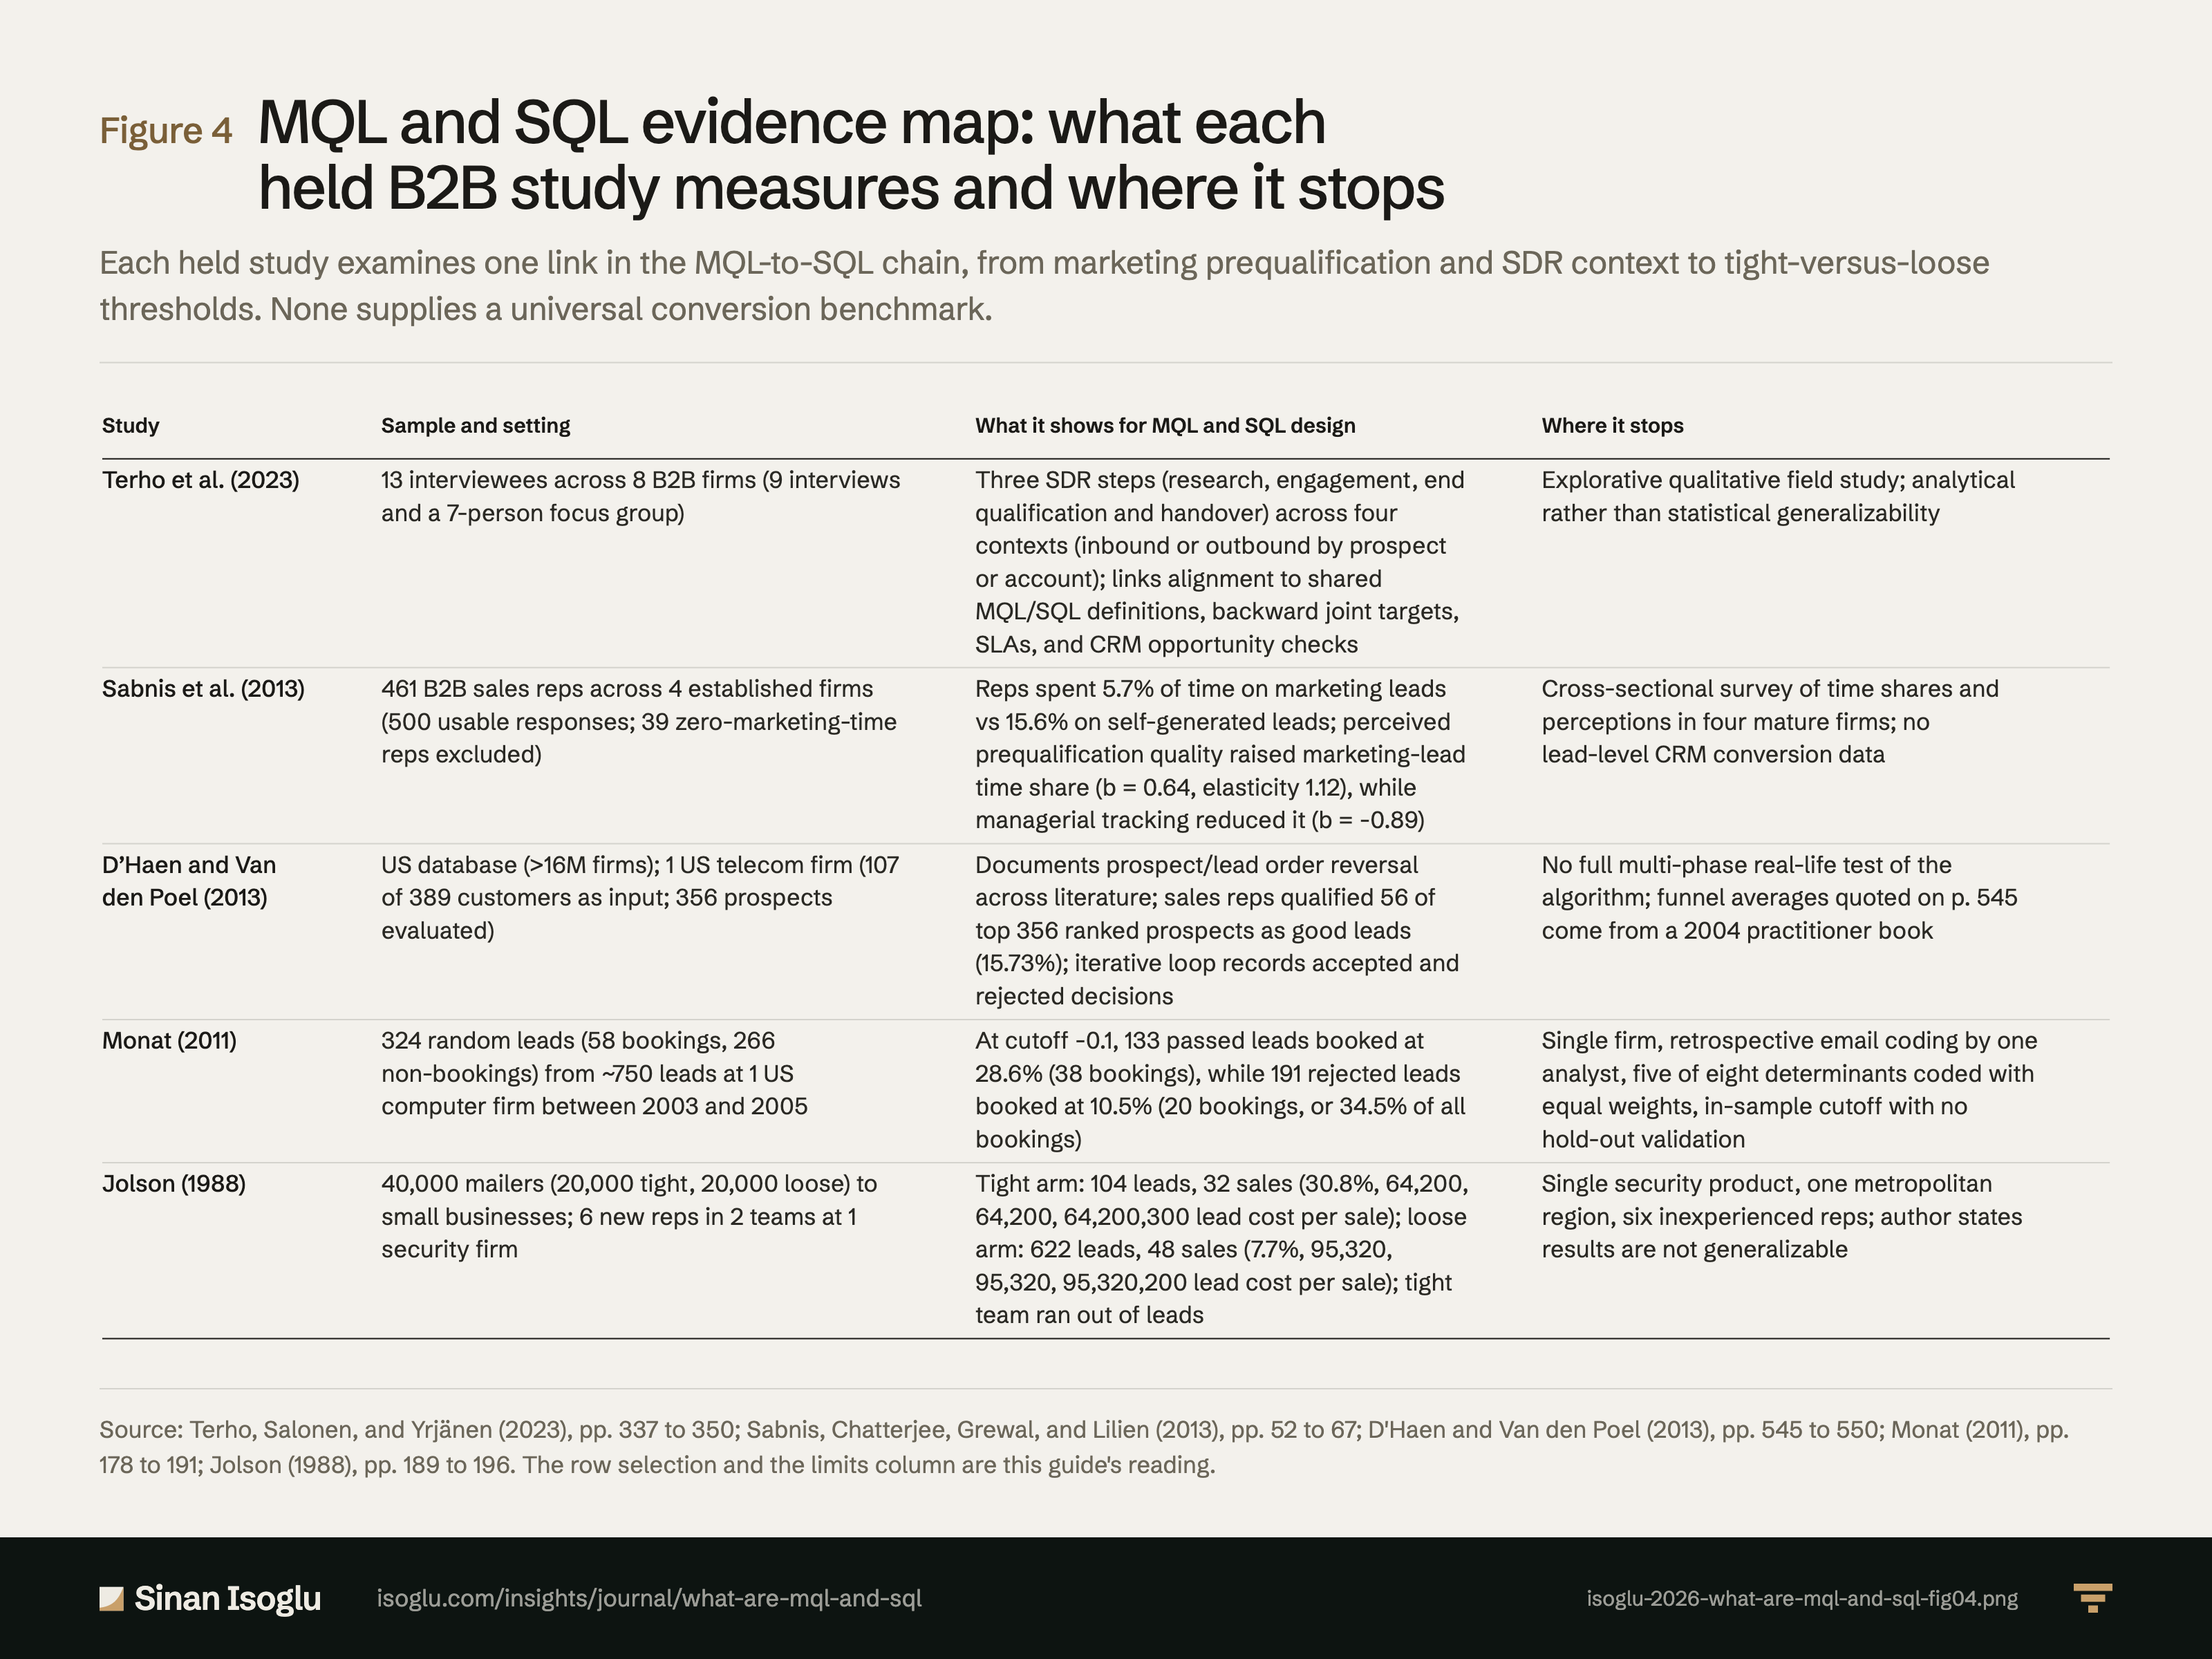
Abbildung 4Grafik
Evidenzkarte zu MQL und SQL: was jede der fünf B2B-Studien misst und wo sie endet
MQL und SQL: was sind Marketing und Sales Qualified Leads?
Kontakt
Schicken Sie die Frage, an der Sie arbeiten.
Forschung, ein Gastvortrag oder eine Frage aus der Praxis.