Figure 4From “MQL and SQL: what are marketing- and sales-qualified leads?”
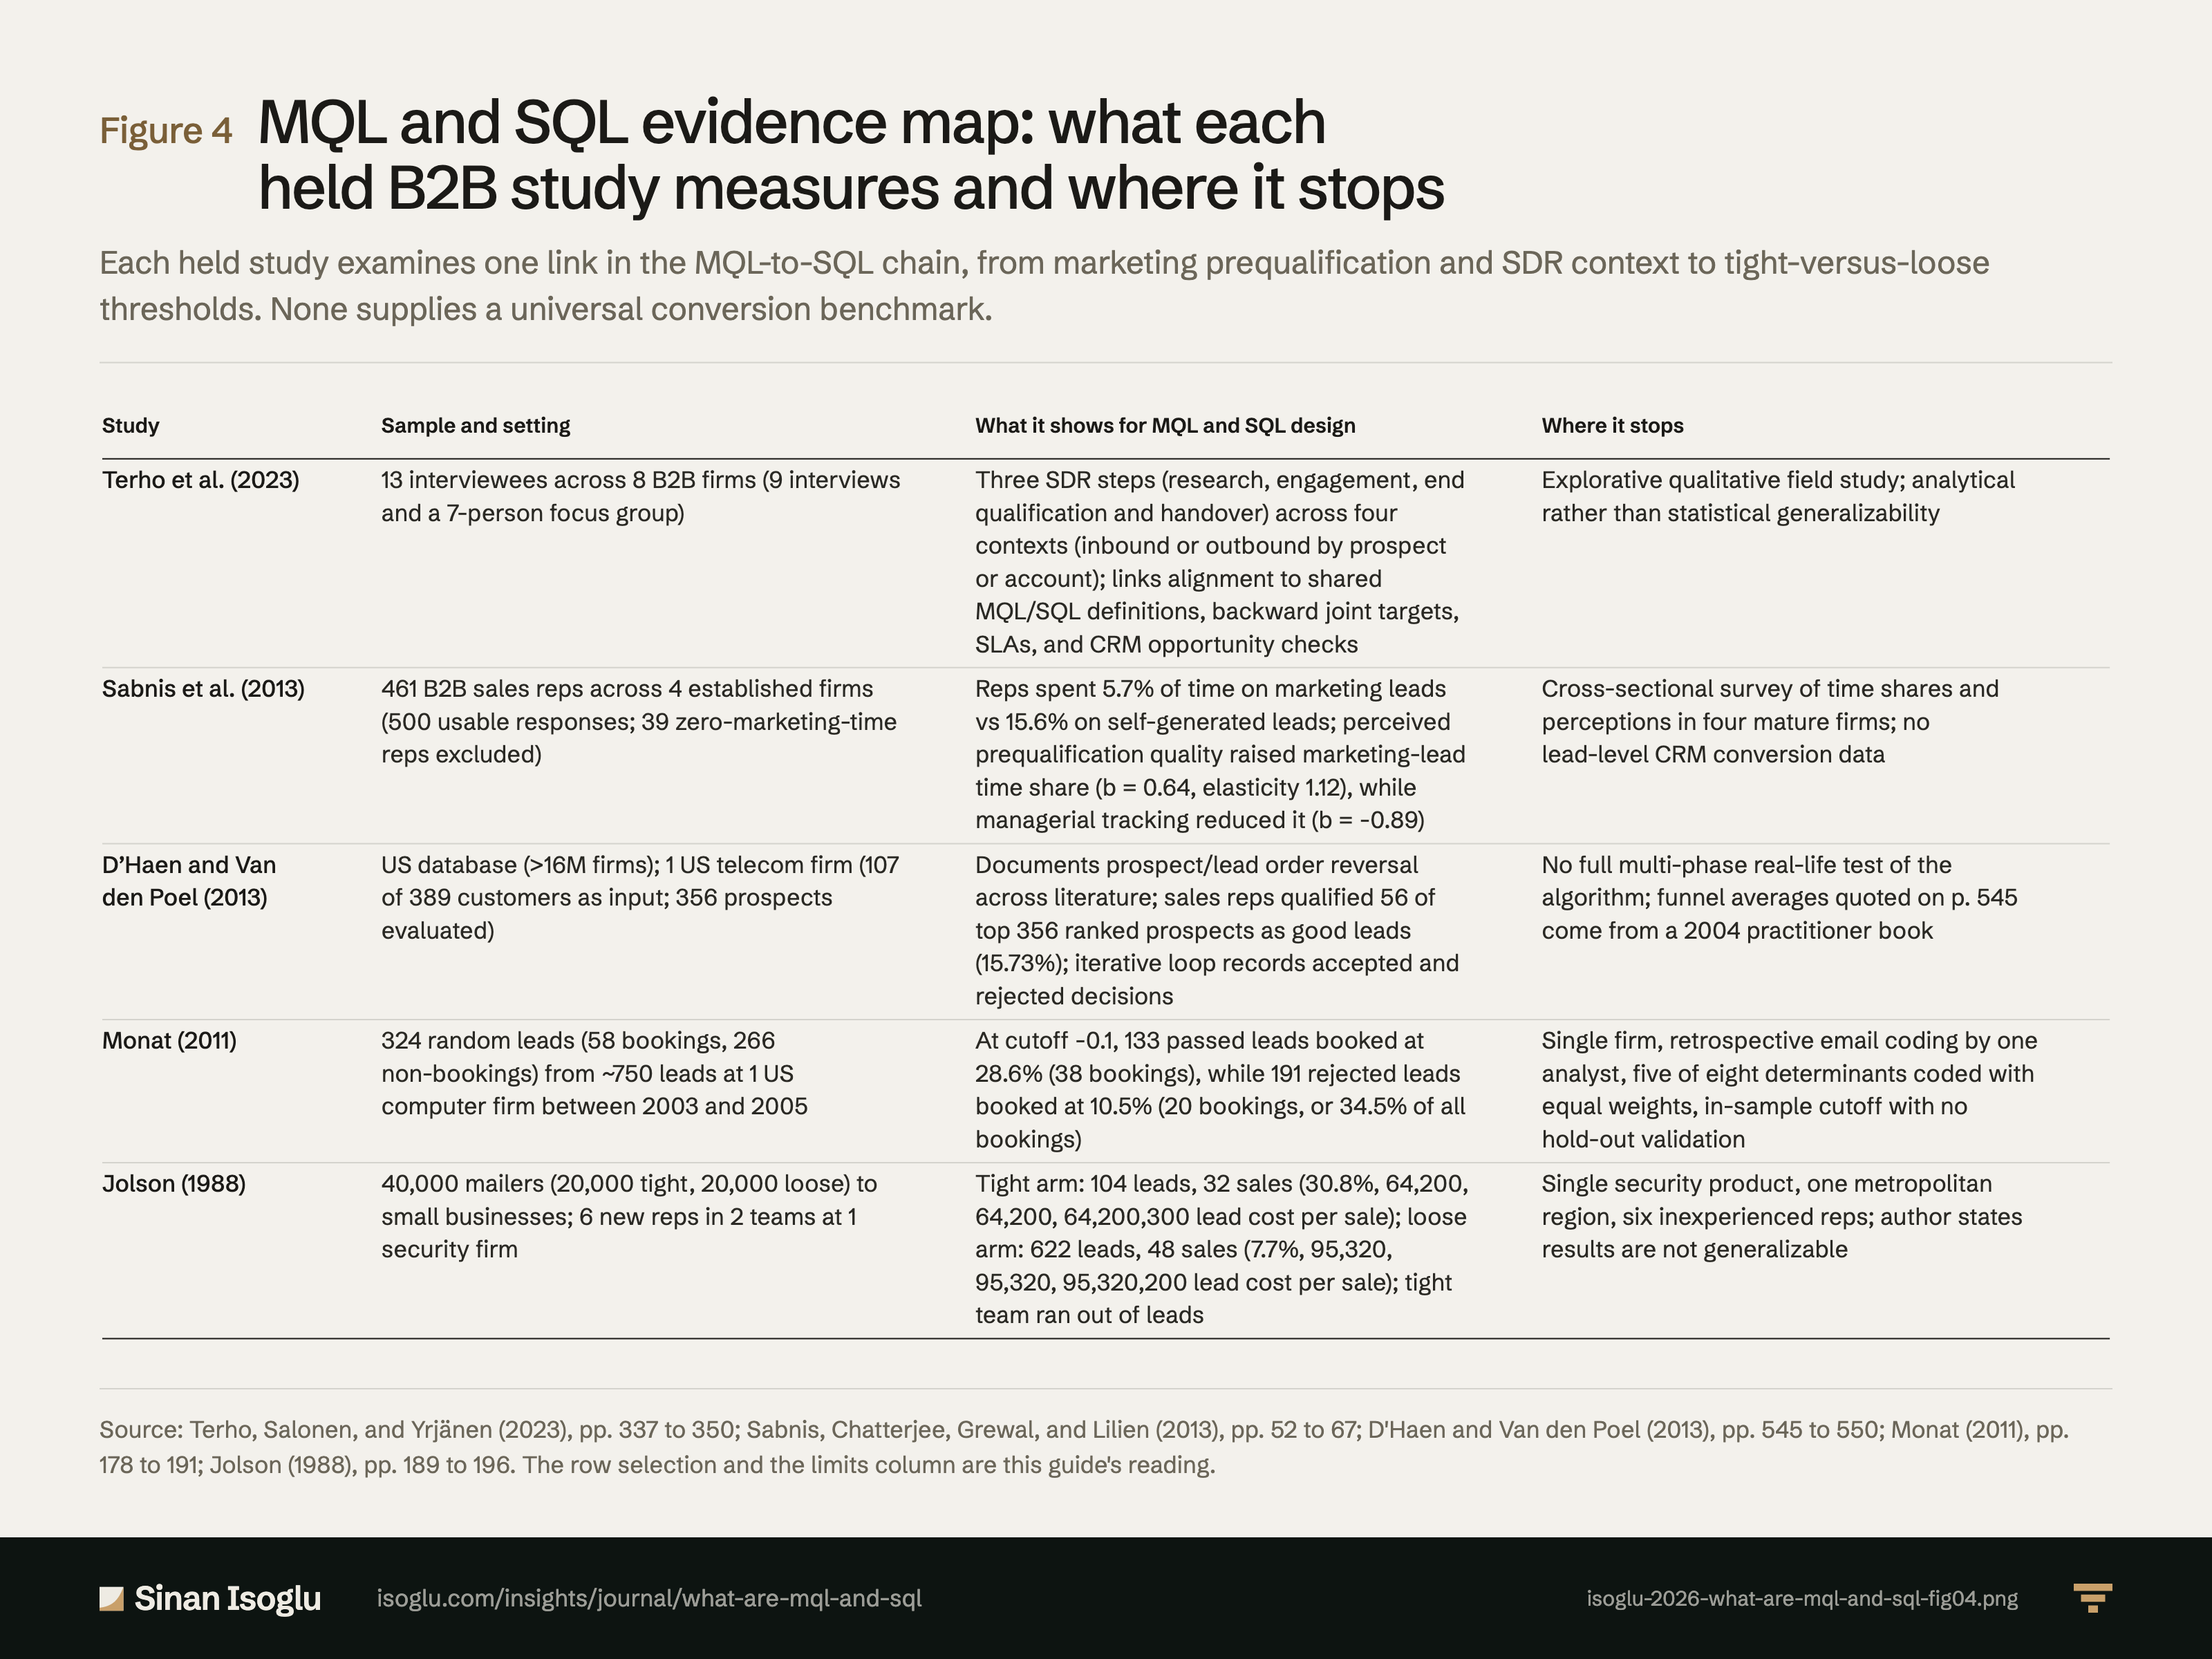
MQL and SQL evidence map: what each held B2B study measures and where it stops
Each held study examines one link in the MQL-to-SQL chain, from marketing prequalification and SDR context to tight-versus-loose thresholds. None supplies a universal conversion benchmark.
Figure 4MQL and SQL evidence map: what each held B2B study measures and where it stops
| Study | Sample and setting | What it shows for MQL and SQL design | Where it stops |
|---|---|---|---|
| Terho et al. (2023) | 13 interviewees across 8 B2B firms (9 interviews and a 7-person focus group) | Three SDR steps (research, engagement, end qualification and handover) across four contexts (inbound or outbound by prospect or account); links alignment to shared MQL/SQL definitions, backward joint targets, SLAs, and CRM opportunity checks | Explorative qualitative field study; analytical rather than statistical generalizability |
| Sabnis et al. (2013) | 461 B2B sales reps across 4 established firms (500 usable responses; 39 zero-marketing-time reps excluded) | Reps spent 5.7% of time on marketing leads vs 15.6% on self-generated leads; perceived prequalification quality raised marketing-lead time share (b = 0.64, elasticity 1.12), while managerial tracking reduced it (b = -0.89) | Cross-sectional survey of time shares and perceptions in four mature firms; no lead-level CRM conversion data |
| D'Haen and Van den Poel (2013) | US database (>16M firms); 1 US telecom firm (107 of 389 customers as input; 356 prospects evaluated) | Documents prospect/lead order reversal across literature; sales reps qualified 56 of top 356 ranked prospects as good leads (15.73%); iterative loop records accepted and rejected decisions | No full multi-phase real-life test of the algorithm; funnel averages quoted on p. 545 come from a 2004 practitioner book |
| Monat (2011) | 324 random leads (58 bookings, 266 non-bookings) from ~750 leads at 1 US computer firm between 2003 and 2005 | At cutoff -0.1, 133 passed leads booked at 28.6% (38 bookings), while 191 rejected leads booked at 10.5% (20 bookings, or 34.5% of all bookings) | Single firm, retrospective email coding by one analyst, five of eight determinants coded with equal weights, in-sample cutoff with no hold-out validation |
| Jolson (1988) | 40,000 mailers (20,000 tight, 20,000 loose) to small businesses; 6 new reps in 2 teams at 1 security firm | Tight arm: 104 leads, 32 sales (30.8%, $64,200, $300 lead cost per sale); loose arm: 622 leads, 48 sales (7.7%, $95,320, $200 lead cost per sale); tight team ran out of leads | Single security product, one metropolitan region, six inexperienced reps; author states results are not generalizable |
Swipe or scroll horizontally if the table is wider than your screen.
Source: Terho, Salonen, and Yrjänen (2023), pp. 337 to 350; Sabnis, Chatterjee, Grewal, and Lilien (2013), pp. 52 to 67; D'Haen and Van den Poel (2013), pp. 545 to 550; Monat (2011), pp. 178 to 191; Jolson (1988), pp. 189 to 196. The row selection and the limits column are this guide's reading.
Source and evidence
Each line names a claim related to this exhibit, its source, and how it was checked.
- A A verified against the printed page of the primary sourceB primary source, text layer onlyC authoritative secondaryD reported Design and limits: 13 interviewees from eight firms; lead research, engagement and handover vary with the lead management context (inbound or outbound, prospect or account); analytical, not statistical, generalizability; explorative and qualitative (pp. 337, 343, 350): "The authors adopted a qualitative field-study approach and interviewed 13 people from eight firms."; "The sales development processes of lead research, engagement and handover vary depending on the nature of the lead management context."; "In terms of generalizability, we have striven for analytical rather than statistical generalizability."; "this study is explorative and builds on qualitative data from in-depth interviews with managers"Terho et al. (2023)
- A A verified against the printed page of the primary sourceB primary source, text layer onlyC authoritative secondaryD reported Inbound, prospect-level qualification as interviewees and authors describe it: lead quality judged against ideal customer profile fit; whether a sale is possible now or in six months; whether the contact is the right person; handover once the contact can carry a sales conversation; qualification criteria vary by company but should exist (pp. 343 to 345). The mapping to BANT's timing and authority is the essay's: "Respondents noted that the quality of a lead is typically assessed against fit with an ideal customer profile based on criteria such as the customer’s purchasing-related potential or fit with the seller’s offering."; "We tried to find out if it’s a case where we can sell something right now or maybe six months down the line"; "many leads that contact us are not the right persons from the perspective of sales"; "once the SDR verifies that the lead is a person who can carry out conversations with sales"; "What a sales qualified lead looks like can be customized for the company"; "but always have qualification criteria"Terho et al. (2023)
- A A verified against the printed page of the primary sourceB primary source, text layer onlyC authoritative secondaryD reported Complex, account-level qualification: research on the customer as a decision-making unit; prolonged engagement of many stakeholders at account level; stakeholder mapping; research on pain points and needs (pp. 343 to 345): "In more complex sales situations, the SDR proactively conducts deeper background research to understand the customer more fully as a decision-making unit"; "Complex purchase decisions require prolonged engagement of multiple and varied customer stakeholders at the account level rather than at the individual prospect level"; "map the key stakeholders in the customer’s decision-making unit"; "research also builds an understanding of customer pain points and their needs"Terho et al. (2023)
- A A verified against the printed page of the primary sourceB primary source, text layer onlyC authoritative secondaryD reported Four sales development contexts differ by incoming lead source and sales complexity (pp. 342 to 345): "The data analysis further pointed out four key types of sales development that notably differ by the nature of the incoming leads and the complexity of the lead management process, as illustrated in Figure 2."; "an SDR can pick up “inbound leads” generated by the marketing function or focus on sales function–directed “outbound prospecting” based on predefined criteria."; "the activities of an SDR can focus on “individual prospects” or “larger enterprise accounts”, depending on the complexity of the sales situation."; "Once SD deems that the customer, as a decision-making unit, is ready to start a dialogue with the account executive, the lead is handed over to outside sales."Terho, Salonen & Yrjänen (2023)
- A A verified against the printed page of the primary sourceB primary source, text layer onlyC authoritative secondaryD reported Cross-unit alignment requires shared definitions of lead, SQL and prospect, backward-calculated joint targets, internal SLAs governing contact times, clear ownership, and balanced evaluation rather than rewarding booked meetings alone (pp. 346, 347): "units should clearly define and agree on the terminology “what is a lead, a sales qualified lead or a prospect,” as well as clearly define responsibilities who has the ownership of the lead along the sales process."; "Many firms further used internal service-level agreements to formally govern the internal lead management process, for example, regarding the contact times for different leads"; "Many respondents emphasized joint target setting by working backward from sales targets to understand how many leads marketing needs to generate monthly and what the quality of those leads needs to be so that the sales funnel maintains a steady flow."; "this was my lead, no I talked to them first, no it was mine"; "did the field sales enter a new sales opportunity into the firm’s CRM system after holding a sales meeting booked by an SDR"; "“Booked meetings” is a classic metric, however, in my opinion a wrong one. It would be more important to think about the lifecycle of the client: how it was transformed from a subscriber to an opportunity."Terho, Salonen & Yrjänen (2023)
- A A verified against the printed page of the primary sourceB primary source, text layer onlyC authoritative secondaryD reported Prequalification is marketing's screening and discarding of the leads it generated, typically done inside the firm by marketing personnel; the perceived-quality items include giving only hot leads to salespeople and, reverse coded, a terrible job of filtering out cold leads; citing earlier research (Mittal, Ross and Tsiros 2002), the authors note that reps with better past performance are more likely to follow up leads with a lower likelihood of closure but higher revenue potential (pp. 55, 56, 64): "Prequalification is a process by which the marketing department screens the leads it has generated and discards those it deems unattractive."; "lead prequalification is typically executed internally by marketing personnel"; "My company is very good at giving only hot leads to salespeople."; "My company does a terrible job of filtering out cold leads"; "Sales reps with better previous sales performance are more likely to follow up on leads that offer a lower likelihood of closure but higher revenue potential, rather than the reverse"Sabnis et al. (2013)
- A A verified against the printed page of the primary sourceB primary source, text layer onlyC authoritative secondaryD reported Design and premise: surveys of sales reps in four B2B firms, one each in scientific instruments, chemicals, copiers and computers, 461 analysed; reps cannot observe objective lead quality and act on their perception of the marketing department's qualification process; the dependent variable is the share of working time on marketing leads, self-generated leads and other work; follow-up is defined from first contact until the rep knows what the prospect will do (order, competitor's order, written off) (pp. 53, 55, 58, 59, 64): "Each firm represented a different industry (scientific instruments, chemicals, copiers, and computers)."; "data from 461 sales reps from four firms"; "leaving 461 surveys that reported on all relevant measures"; "Sales reps cannot observe the objective quality of leads; they are motivated by their perceptions of lead quality or, more operationally, of the marketing department’s lead qualification process."; "We count follow-up as starting when you contact a prospect in any way at all and ending when you know what the prospect will do (you get the order, somebody else gets the order, or you write them off as hopeless)."Sabnis et al. (2013)
- A A verified against the printed page of the primary sourceB primary source, text layer onlyC authoritative secondaryD reported Results: H1a supported (b = .64, p < .05); elasticity of the marketing-lead time share to perceived prequalification quality 1.12 for the sample, positive in all four firms, .58 to 1.64, which the authors call a 3:1 ratio; Table 3, row Quality of prequalification (p. 63, page image): aggregate 1.12, Firm 1 1.24, Firm 2 .58, Firm 3 1.64, Firm 4 1.43; the same table gives managerial tracking −.14 and marketing lead volume −.07 for the aggregate; Firms 1 to 4 are scientific instruments, chemicals, copiers and computers (pp. 59 and 63), with 51, 30, 100 and 280 reps (Table 1, p. 59); H4a supported (b = .71): the prequalification effect is stronger with more experience. The authors write produces; the data are one cross-sectional survey, so the page reads an association. Table 3 prints point estimates only, with no interval or test, and in the hierarchical specification the firm-level effects shrink toward the aggregate (p. 62); the aggregate value is the model's own estimate, not an average of the firm values, and Firm 2 rests on 30 reps; the page says so in the Figure 1 caption and calls the elasticity a slope, not a closeness of fit. The instrument prints the scale as 1 = agree and 7 = disagree (p. 58) while the text reads higher scores as higher perceived quality (pp. 59, 63), so the page gives direction as the authors state it and uses no scale means (pp. 59, 61 to 63): "which suggests that as the perceived quality of prequalification increases, the proportion of time spent on marketing leads increases"; "a 1% increase in perceived prequalification quality produces a 1.12% increase in marketing lead follow-up time allocation"; "The elasticity is positive across all four firms but varies considerably (from .58 to 1.64)."; "we find a 3:1 ratio for the elasticity of the perceived prequalification quality for the least and most responsive firms"; "Elasticity of Marketing Lead Time Proportion"; "It is negative for Firms 1 (scientific instruments) and 2 (chemicals) but positive for Firms 3 (copiers"; "in which we argued that experience enhances the positive effect of the perceived quality of prequalification on the proportion of time spent following up marketing leads"; "In the model specification, the firm-level effects shrink to the aggregate effects."; "from 55 (Firm 2, chemicals) to 2500 (Firm 4, computers)"Sabnis et al. (2013)
- A A verified against the printed page of the primary sourceB primary source, text layer onlyC authoritative secondaryD reported Limits: the implications are limited to proportional allocations of time and may not extend to hours spent or the number of leads followed; lead-level CRM data might allow such analyses; prequalification quality is each rep's perception, not an objective firm-level measure, and the authors count such perceptual measures among their limits (pp. 63, 64): "inherently suffer from measurement error and perhaps some psychological bias"; "the managerial implications we draw are limited to proportional allocations of time; they may not extend fully to related constructs such as actual time spent on marketing leads (in hours) or the number of leads followed"; "Lead-level data from firms’ customer relationship management systems might make such analyses possible."; "the extent of prequalification quality is not an objective, firm-level measure but rather is based on individual sales reps’ perceptions"Sabnis et al. (2013)
- A A verified against the printed page of the primary sourceB primary source, text layer onlyC authoritative secondaryD reported Reps reporting no marketing-lead time, and scope: 39 respondents reported spending no time on marketing leads (the page no longer says they ignored them, since receipt and intent are not reported) and perceived prequalification as significantly lower; 37 of the 39 came from the computer firm, a potential systematic bias, and they were removed; the black hole share in the paper's opening comes from two industry research reports it cites (Marcus 2002, Gartner Group; Michiels 2009, Aberdeen Group), not from the sample, and guard FUN-X1 keeps that figure off the page; the authors say the figure reflects marketing as well as sales, since reps can receive more leads than they could pursue; the firms are long-established major players and the conclusions might not apply to smaller or younger firms (pp. 52, 59, 64, 67): "Our preliminary examination of the data showed that 39 respondents reported spending no time pursuing marketing leads."; "sales reps who spent no time pursuing marketing leads perceived the quality of lead prequalification"; "as significantly lower than those who pursued at least some marketing leads"; "37 of the 39 respondents who indicated no marketing lead follow-up time came from one firm (computer industry)"; "a potential for systematic bias"; "We removed the responses with no marketing lead follow-up time allocations from our analysis"; "reflects inadequacies of marketing as well as the sales function"; "it is not possible for the sales reps to pursue all of them, even if they desired to do so"; "research report, Gartner Group"; "research report, Aberdeen Group"; "Our study uses data from firms that are major players in their industries and have been so for several decades"; "our conclusions might not apply to smaller or younger firms whose sales processes are still evolving"Sabnis et al. (2013)
- A A verified against the printed page of the primary sourceB primary source, text layer onlyC authoritative secondaryD reported Marketing and sales hold different time horizons, and in the 461-rep sample across four firms (51, 30, 100 and 280 reps; no compensation component explicitly rewarded following up on marketing leads), reps allocate 5.7% of working time to marketing leads, 15.6% to self-generated leads and 78.8% to non-acquisition work; in Table 2 (p. 61), perceived prequalification quality (b = .64, 95% interval .39 to .85) and its interaction with experience (b = .71, .48 to .96) increase marketing-lead time share, while managerial tracking (b = -.89, -.96 to -.68), its interaction with experience (b = -.55, -.74 to -.39) and past performance (b = -.31, -.46 to -.12) reduce it, and lead volume (b = .44, -.28 to .73) and experience (b = -.19, -.34 to .16) have intervals crossing zero; in Table 1 and Table 3 (pp. 59, 63), annual marketing leads per rep average 48.61 (109.30, 199.48, 18.42, 32.14) and managerial-tracking elasticity is -.14 (-.08, -.27, .33, .02) (pp. 54, 58, 59, 61 to 63): "leads that demand careful nurturing to be more attractive than sales does, because sales reps must focus on short-term quota attainment"; "the leads that marketing views as most attractive may not meet the immediate needs of the sales rep."; "Although the compensation schemes included bonuses tied to acquiring new customers, no component explicitly rewarded following up on marketing leads."Sabnis et al (2013)
- A A verified against the printed page of the primary sourceB primary source, text layer onlyC authoritative secondaryD reported Qualification judgement and record-keeping: leads are prospects contacted after being qualified as most likely to respond, a qualification often driven by gut feeling; decisions and steps must be documented and analysed periodically; no full real-life test of the model was possible (pp. 545, 550): "Leads are prospects that will be contacted, after they have been qualified as the most likely to respond."; "This qualification is often driven by gut feeling or self-claimed competence."; "Information on decisions made, steps taken, strategies employed, and so on must be recorded and analyzed periodically."; "The main limitation of this study is that it was not possible to run a full, real-life test of the algorithm."D'Haen and Van den Poel (2013)
- A A verified against the printed page of the primary sourceB primary source, text layer onlyC authoritative secondaryD reported Published studies reverse the order of prospect and lead, and define suspects, prospects, leads and customers as four acquisition phases (p. 545): "A main difference, however, is where the studies place a prospect and a lead in the sales process: some put the prospect before the lead (e.g., Coe, 2004a; Metzger, 2005), whereas others put the lead before the prospect (e.g., Gillin & Schwartzman, 2011; Patterson, 2007)."; "Suspects are all potential new customers available."; "As a result, marketers often make selections using a set of arbitrary rules."; "Prospects are suspects who meet certain predefined characteristics."; "Leads are prospects that will be contacted, after they have been qualified as the most likely to respond."; "Finally, leads who become clients of the company are customers."D'Haen & Van den Poel (2013)
- A A verified against the printed page of the primary sourceB primary source, text layer onlyC authoritative secondaryD reported In a U.S. telecom test on a database of more than 16 million companies using 107 of 389 active customers as input, sales representatives evaluated the top 356 prospects and qualified 56 as good leads, a 15.73% prospect-to-lead conversion rate (pp. 548, 549): "more than 16 million U.S. companies"; "The telecom company has 389 active current customers, of whom we selected 107 as input for the algorithm."; "The sales representatives selected the top 356 prospects to evaluate. Of these, 56 companies were qualified as good leads, corresponding to a conversion rate from prospect to lead of 15.73%"D'Haen & Van den Poel (2013)
- A A verified against the printed page of the primary sourceB primary source, text layer onlyC authoritative secondaryD reported Review of lead characterization models: several score need, timing, budget or authority, none has been validated; choosing characteristics is usually an educated guess; stated urgency may only mean collecting literature; good predictors vary by industry and company; no single model fits all companies (pp. 178, 182, 183, 191): "and budget (approved budget, budget requested but not approved, budget not requested)"; "believes that the prospect’s need and pain or discomfort level, timing, authority to make the purchase decision"; "although there are several models purported to characterize sales leads, none has been validated"; "determining which characteristics are important is usually an educated guess based upon the sales manager’s personal experience, gut feel, and the sales literature he/she has recently read"; "a prospect expressing great time urgency may in fact only be urgently collecting literature"; "exactly which independent lead characteristics are good conversion predictors varies from industry to industry and from company to company within industries"; "no single quantitative lead characterization model will be accurate for all companies"Monat (2011)
- A A verified against the printed page of the primary sourceB primary source, text layer onlyC authoritative secondaryD reported The scorecard test: items include funding, decision authority, timeframe and an approved project; five of eight determinants scored (need, urgency, ability to purchase, trust in the vendor, competition), equally weighted and summed, with lead source and contact direction counting towards need and urgency; only the summed score is reported, so no separation can be credited to the BANT-like items; 324 leads drawn at random from about 750 at one US computer hardware and software company, 2003 to 2005, coded from archived e-mails by one analyst; 58 (17.9%) converted, 266 did not; Table VII (p. 191, page image): 38 of 58 and 171 of 266 correctly predicted (66% and 64%); cutoff found by experimentation on the same leads; no hold-out, no significance tests; three of eight determinants had no data; the model is not formally validated. The text says 264 non-converting leads, Table VII 266 (pp. 189 to 191): "five of the eight customer purchase decision determinants"; "Is the project funded?"; "Decision authority of the contact"; "Is there an approved project?"; "The 324 leads analyzed were selected at random from a total of"; "that sells computer hardware and software, covering the time period 2003-2005"; "a single analyst scrutinized the archived e-mails"; "Of the 324 leads analyzed, 58 (17.9 percent) eventually converted to bookings while 266 did not."; "Number of leads that developed into sales"; "By experimentation, a cutoff score of"; "It did not use hold-out samples for validation"; "no tests of statistical significance were performed"; "no data were available from the archived leads for any lead for the last three purchase determinants"; "The proposed model has not yet been formally field validated"Monat (2011)
- A A verified against the printed page of the primary sourceB primary source, text layer onlyC authoritative secondaryD reported A sales lead is a recorded expressed interest in the company's goods or services, whether from a new prospect or an existing customer, in a pipeline progressing from suspects through prospects to qualified leads (pp. 179, 181): "irrespective of whether that interest is from a new prospect or from an existing customer"; "discuss the sales pipeline beginning with suspects and then progressing through prospects to qualified leads"Monat (2011)
- B A verified against the printed page of the primary sourceB primary source, text layer onlyC authoritative secondaryD reported Arithmetic on the outcome tests. Jolson, Table 2 and the results table: 32/104 = 30.8%, 48/622 = 7.7%, ratio 4.0; 48 − 32 = 16 more sales; $95,320 − $64,200 = $31,120; cost per lead $9,600/104 = $92.31 and $9,600/622 = $15.43 from the stated $4,800 per 10,000 mailers. Monat, Table VII read as correct predictions: passed leads = 38 + (266 − 171) = 133, of which 38 booked (28.6%); rejected leads = (58 − 38) + 171 = 191, of which 20 booked (10.5%); all leads 58/324 = 17.9%; 20 of 58 bookings rejected (34.5%); overall correct (38 + 171)/324 = 64.5%, below the 82.1% of a rule that calls every lead a non-booking, so the page reports the separation, not the accuracy. Three of Monat's five scored determinants (need, urgency, ability to purchase) read as close to BANT is this essay's mapping. Figure 5 (stack) shows the same Table VII counts as shares of each group: bookings 38 passed and 20 rejected (66 and 34 per cent), non-bookings 95 and 171 (36 and 64 per cent), all leads 133 and 191 (41 and 59 per cent); Figure 4 (mirror) shows Jolson's Table 2 sales per lead (30.8 and 7.7 per cent) against sales from leads ($64,200 and $95,320).Author arithmetic
- A A verified against the printed page of the primary sourceB primary source, text layer onlyC authoritative secondaryD reported Qualification as Jolson reports it from salespeople's judgment or intuition: needs or desires the seller can satisfy, a willingness or readiness to buy or at least to be exposed to the offer, and ability to buy as authority plus buying power, often dwarfed by the other two; not all highly qualified prospects show all three at once, so the dimensions are not a joint test; a lead is highly qualified only if the salesperson thinks it is; tight leads are high-probability prospects; in a hypothetical put to sales meetings (Jones and Smith, not the experiment), salespeople prefer high conversion rates because they bring more frequent reinforcement, which does not confirm that conversion rates track effectiveness and efficiency (pp. 191, 192): "Based on the judgment or intuition of the salespeople, qualified prospects are people or organizations with needs or desires that can be satisfied by the seller’s products or services"; "must exhibit a willingness or readiness to buy or at least a willingness to be exposed to the seller’s offer"; "consists of authority to buy and buying power in the form of cash or credit"; "often dwarfed by the other two"; "Yet, not all highly qualified prospects are described by a simultaneous desire for the seller’s product, receptiveness to a sales call, and buying power."; "A lead is highly qualified only if the salesperson thinks it is."; "where tight leads are considered to be high probability prospects"; "The author has introduced the following hypothetical situation at sales meetings"; "A higher conversion rate means more frequent reinforcement"; "but does not confirm the correlation of the conversion rates of leads and presentations with selling effectiveness and efficiency"Jolson (1988)
- A A verified against the printed page of the primary sourceB primary source, text layer onlyC authoritative secondaryD reported Design of the 1987 field test: the author was hired as the firm's consultant; a tight mailer requesting a call about a demonstration and security analysis and a loose mailer offering a booklet, each sent to 10,000 small businesses on 1 September and 1 October 1987 (20,000 each), interlaced name by name; results counted to 15 December 1987; leads worked by six relatively inexperienced salespeople in two teams of three formed by coin toss, in a sales contest, allowed to add referrals and cold calls (pp. 193, 194): "In February 1987, the author was hired as a consultant to assist the company in introducing a direct mail circularization campaign"; "Please phone me to discuss a free demonstration and security analysis."; "Please mail me the 20-page booklet"; "of each type of circular were mailed in the firm’s market area"; "Bias was eliminated by interlacing the two types of mailers throughout the mailing list"; "it was assumed that all returns and selling activities relating to these leads would be finalized by December 15, 1987"; "All returned leads were assigned to six relatively inexperienced salespeople"; "Two teams of three people each were formed (by a coin toss), with one team assigned to work loose leads and the other to work tight leads."; "Each salesperson was promised a company-paid four-day trip to San Juan"; "the salespeople were told they were permitted to supplement their prospecting effort with customer referrals or cold calling"Jolson (1988)
- A A verified against the printed page of the primary sourceB primary source, text layer onlyC authoritative secondaryD reported Results, read from the page images of pp. 194 and 195: leads returned 104 (tight) and 622 (loose), appointments 66 and 174, presentations 48 and 104, sales on leads 32 and 48, other sales 3 and 4; Table 2: sales from leads $64,200 and $95,320, salesperson earnings $10,144 and $12,761, sales per lead 30.8% and 7.7%, sales per presentation 66.7% and 46.2%, cost per lead $92.30 and $15.43, lead cost per sale $300.00 and $200.00; the tight team ran out of places to go; loose leads produced more volume, earnings and returns at lower cost per sale, tight leads a higher conversion rate and more motivation (pp. 194 to 196): "A Comparison of Tight vs. Loose Sales Leads"; "Almost one third of the T leads were converted into sales, whereas 13 loose leads were required for a sale."; "The sales emerging from tight leads cost 50% more."; "The T sales group seemed to run out of places to go and demonstrated little initiative and weak work habits in developing their own prospects."; "loose leads produced more sales volume, higher earnings for salespeople, a larger lead return rate, a lower lead cost per sale, and a lower compensation-cost ratio"; "Tight leads produced a higher conversion rate into sales and an increased level of motivation for sales force members."Jolson (1988)
- A A verified against the printed page of the primary sourceB primary source, text layer onlyC authoritative secondaryD reported Limits and the case for tight leads, put as a question: the results are not generalizable; tightness is controlled through the lead generation program, not a later screen; Jolson asks whether, with such a high rate of rejection, the market will soon be satiated, says that from this point of view a tight system is much more efficient, and adds that the question varies among firms and industries, a specialised seller perhaps having a handful of likely buyers; a consideration, not a stated condition (pp. 192, 196): "the current results are surely not generalizable"; "The firm can control the mix of tight vs. loose leads by manipulating the conduct of the lead generation program."; "with such a high rate of rejection, the firm’s market will soon be satiated"; "From this point of view, a tight lead system is much more efficient."; "The question of market satiation will vary among firms and industries."; "may be limited to a relative handful of likely buyers"Jolson (1988)
- B A verified against the printed page of the primary sourceB primary source, text layer onlyC authoritative secondaryD reported Neither MQL volume nor the MQL-to-SQL acceptance rate is a sufficient performance target on its own: loosening the MQL screen inflates volume and erodes seller follow-up trust, while tightening the screen too far can starve selling capacity and discard buyers who would have purchasedAuthor synthesis
From the essay
Revenue operations & AI
MQL and SQL: what are marketing- and sales-qualified leads?
A marketing-qualified lead passes marketing’s prequalification screen; a sales-qualified lead is verified by sales as ready for a sales conversation.
Read the essayThis exhibit belongs to an essay: the numbers live here, the argument lives there.
Cite or embed
Related exhibits
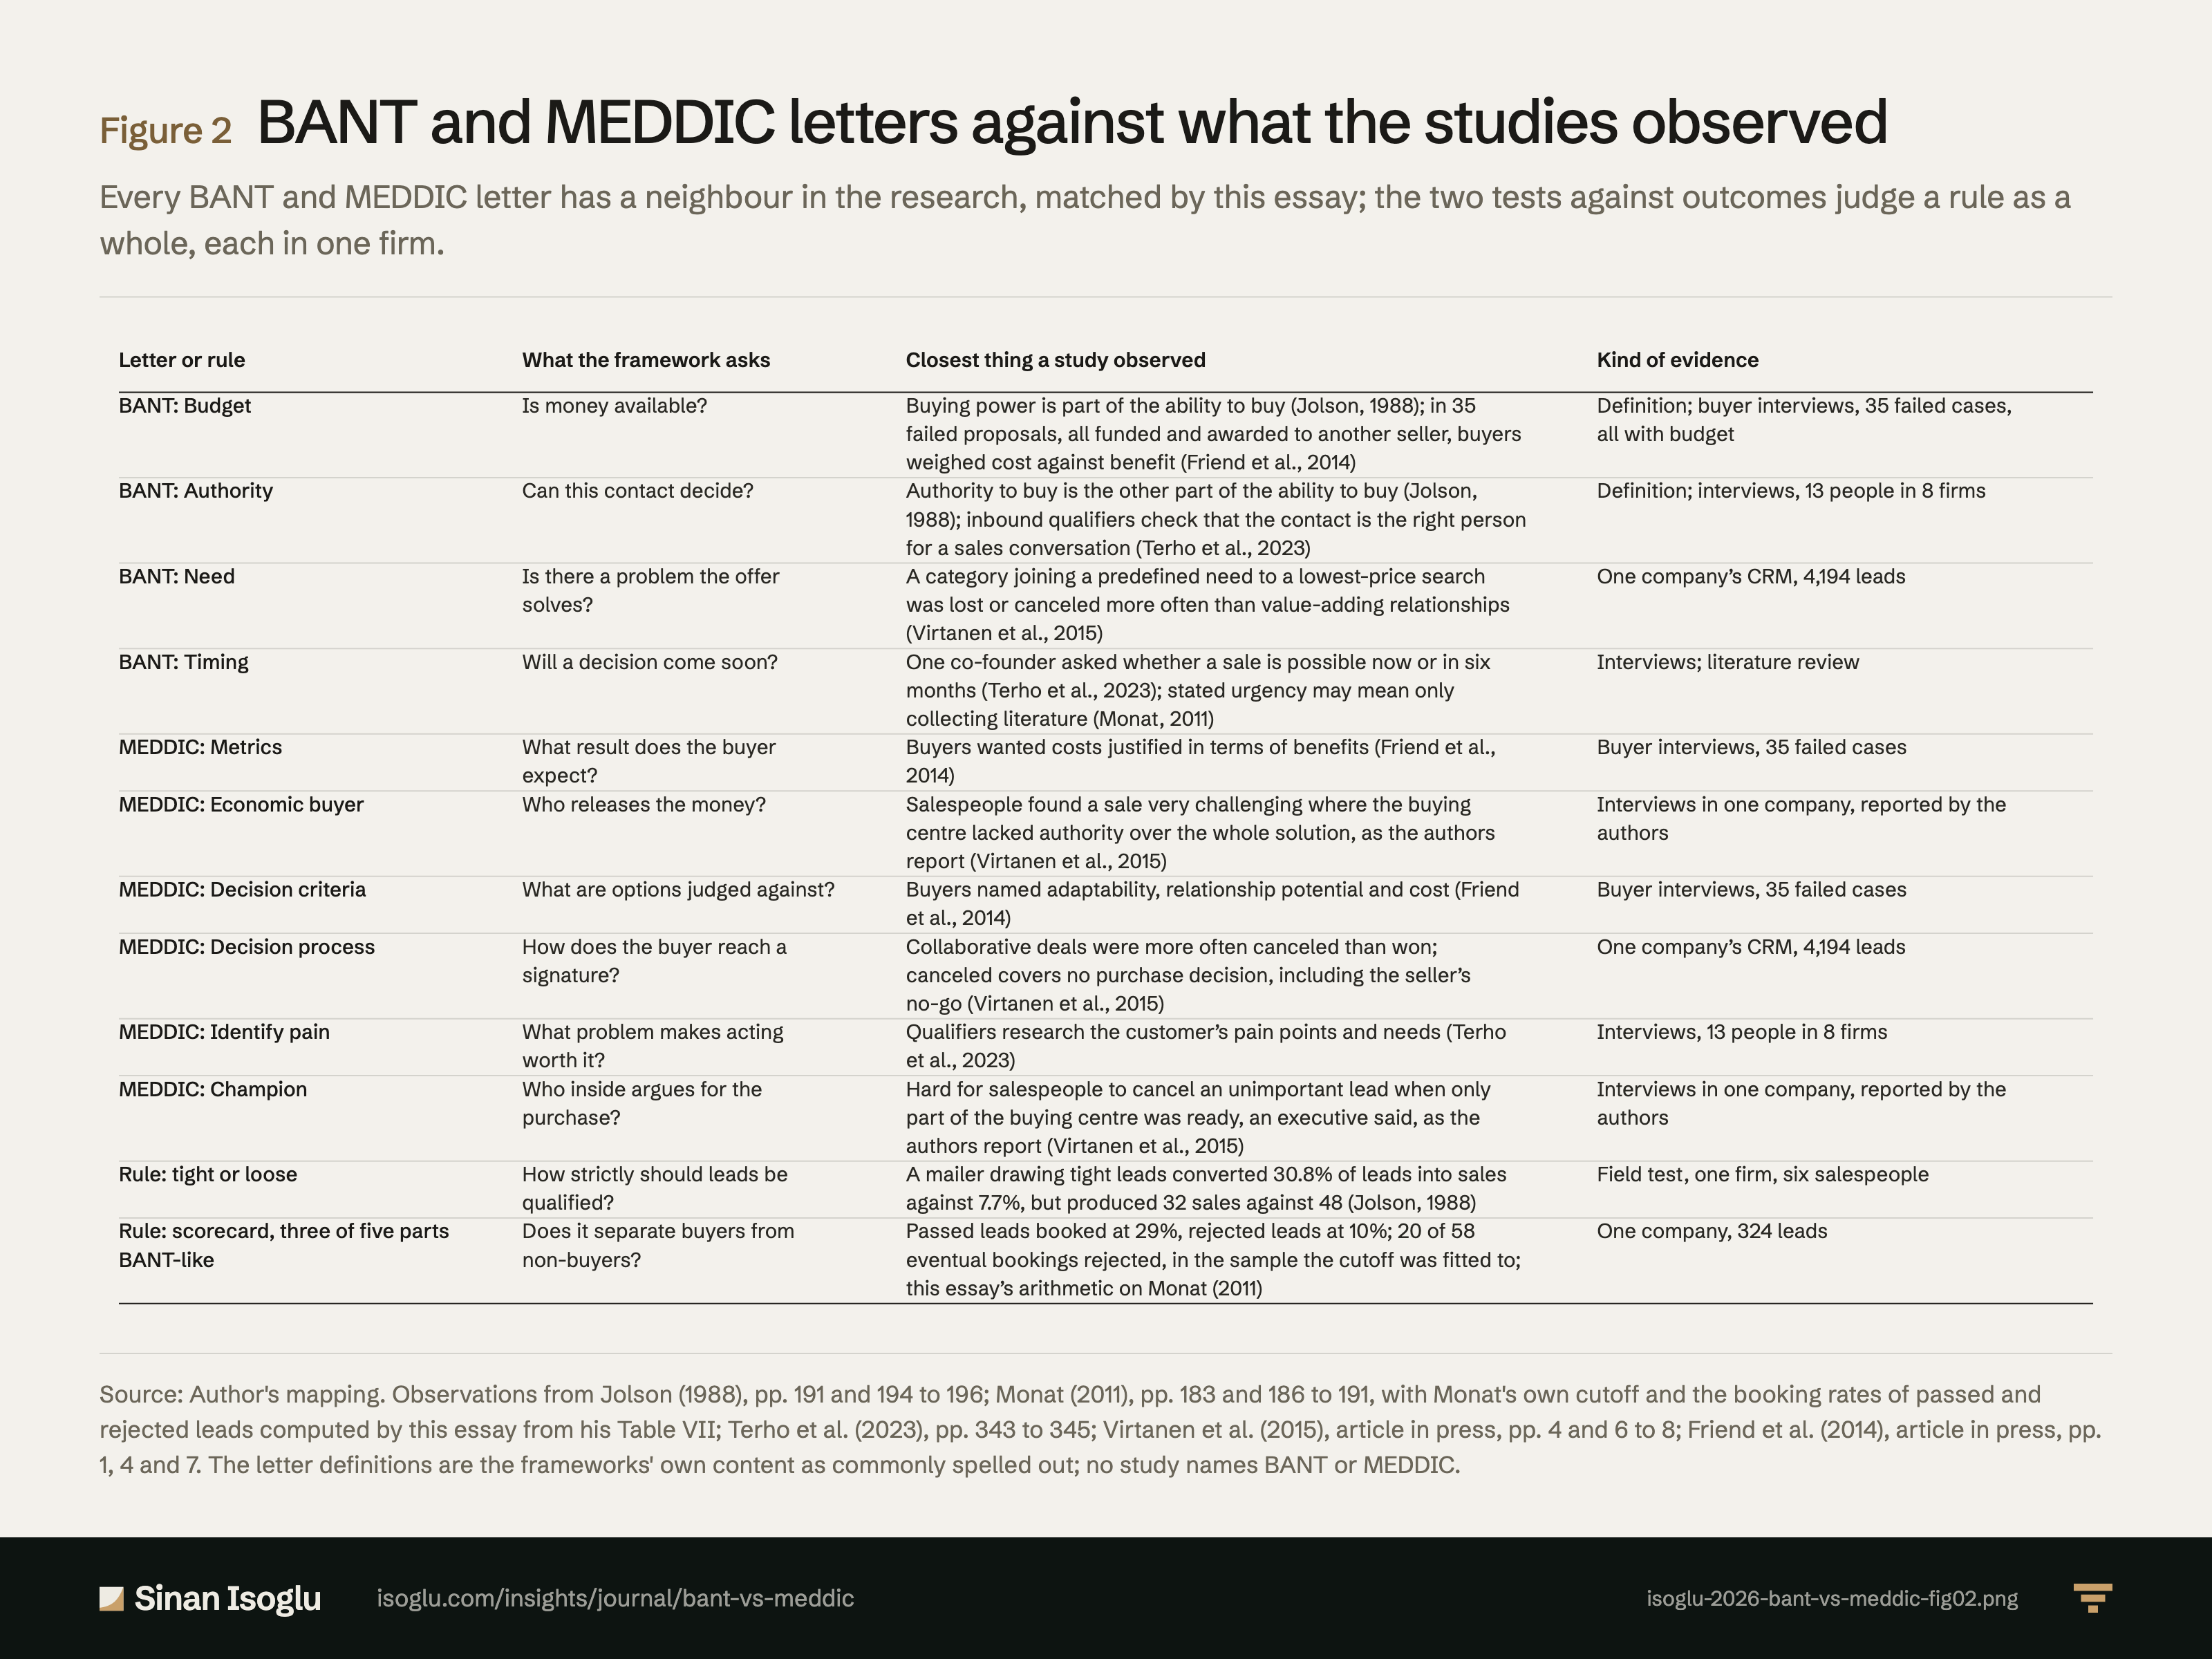
Figure 2Figure
BANT and MEDDIC letters against what the studies observed
BANT vs MEDDIC: a qualification checklist is a hypothesis
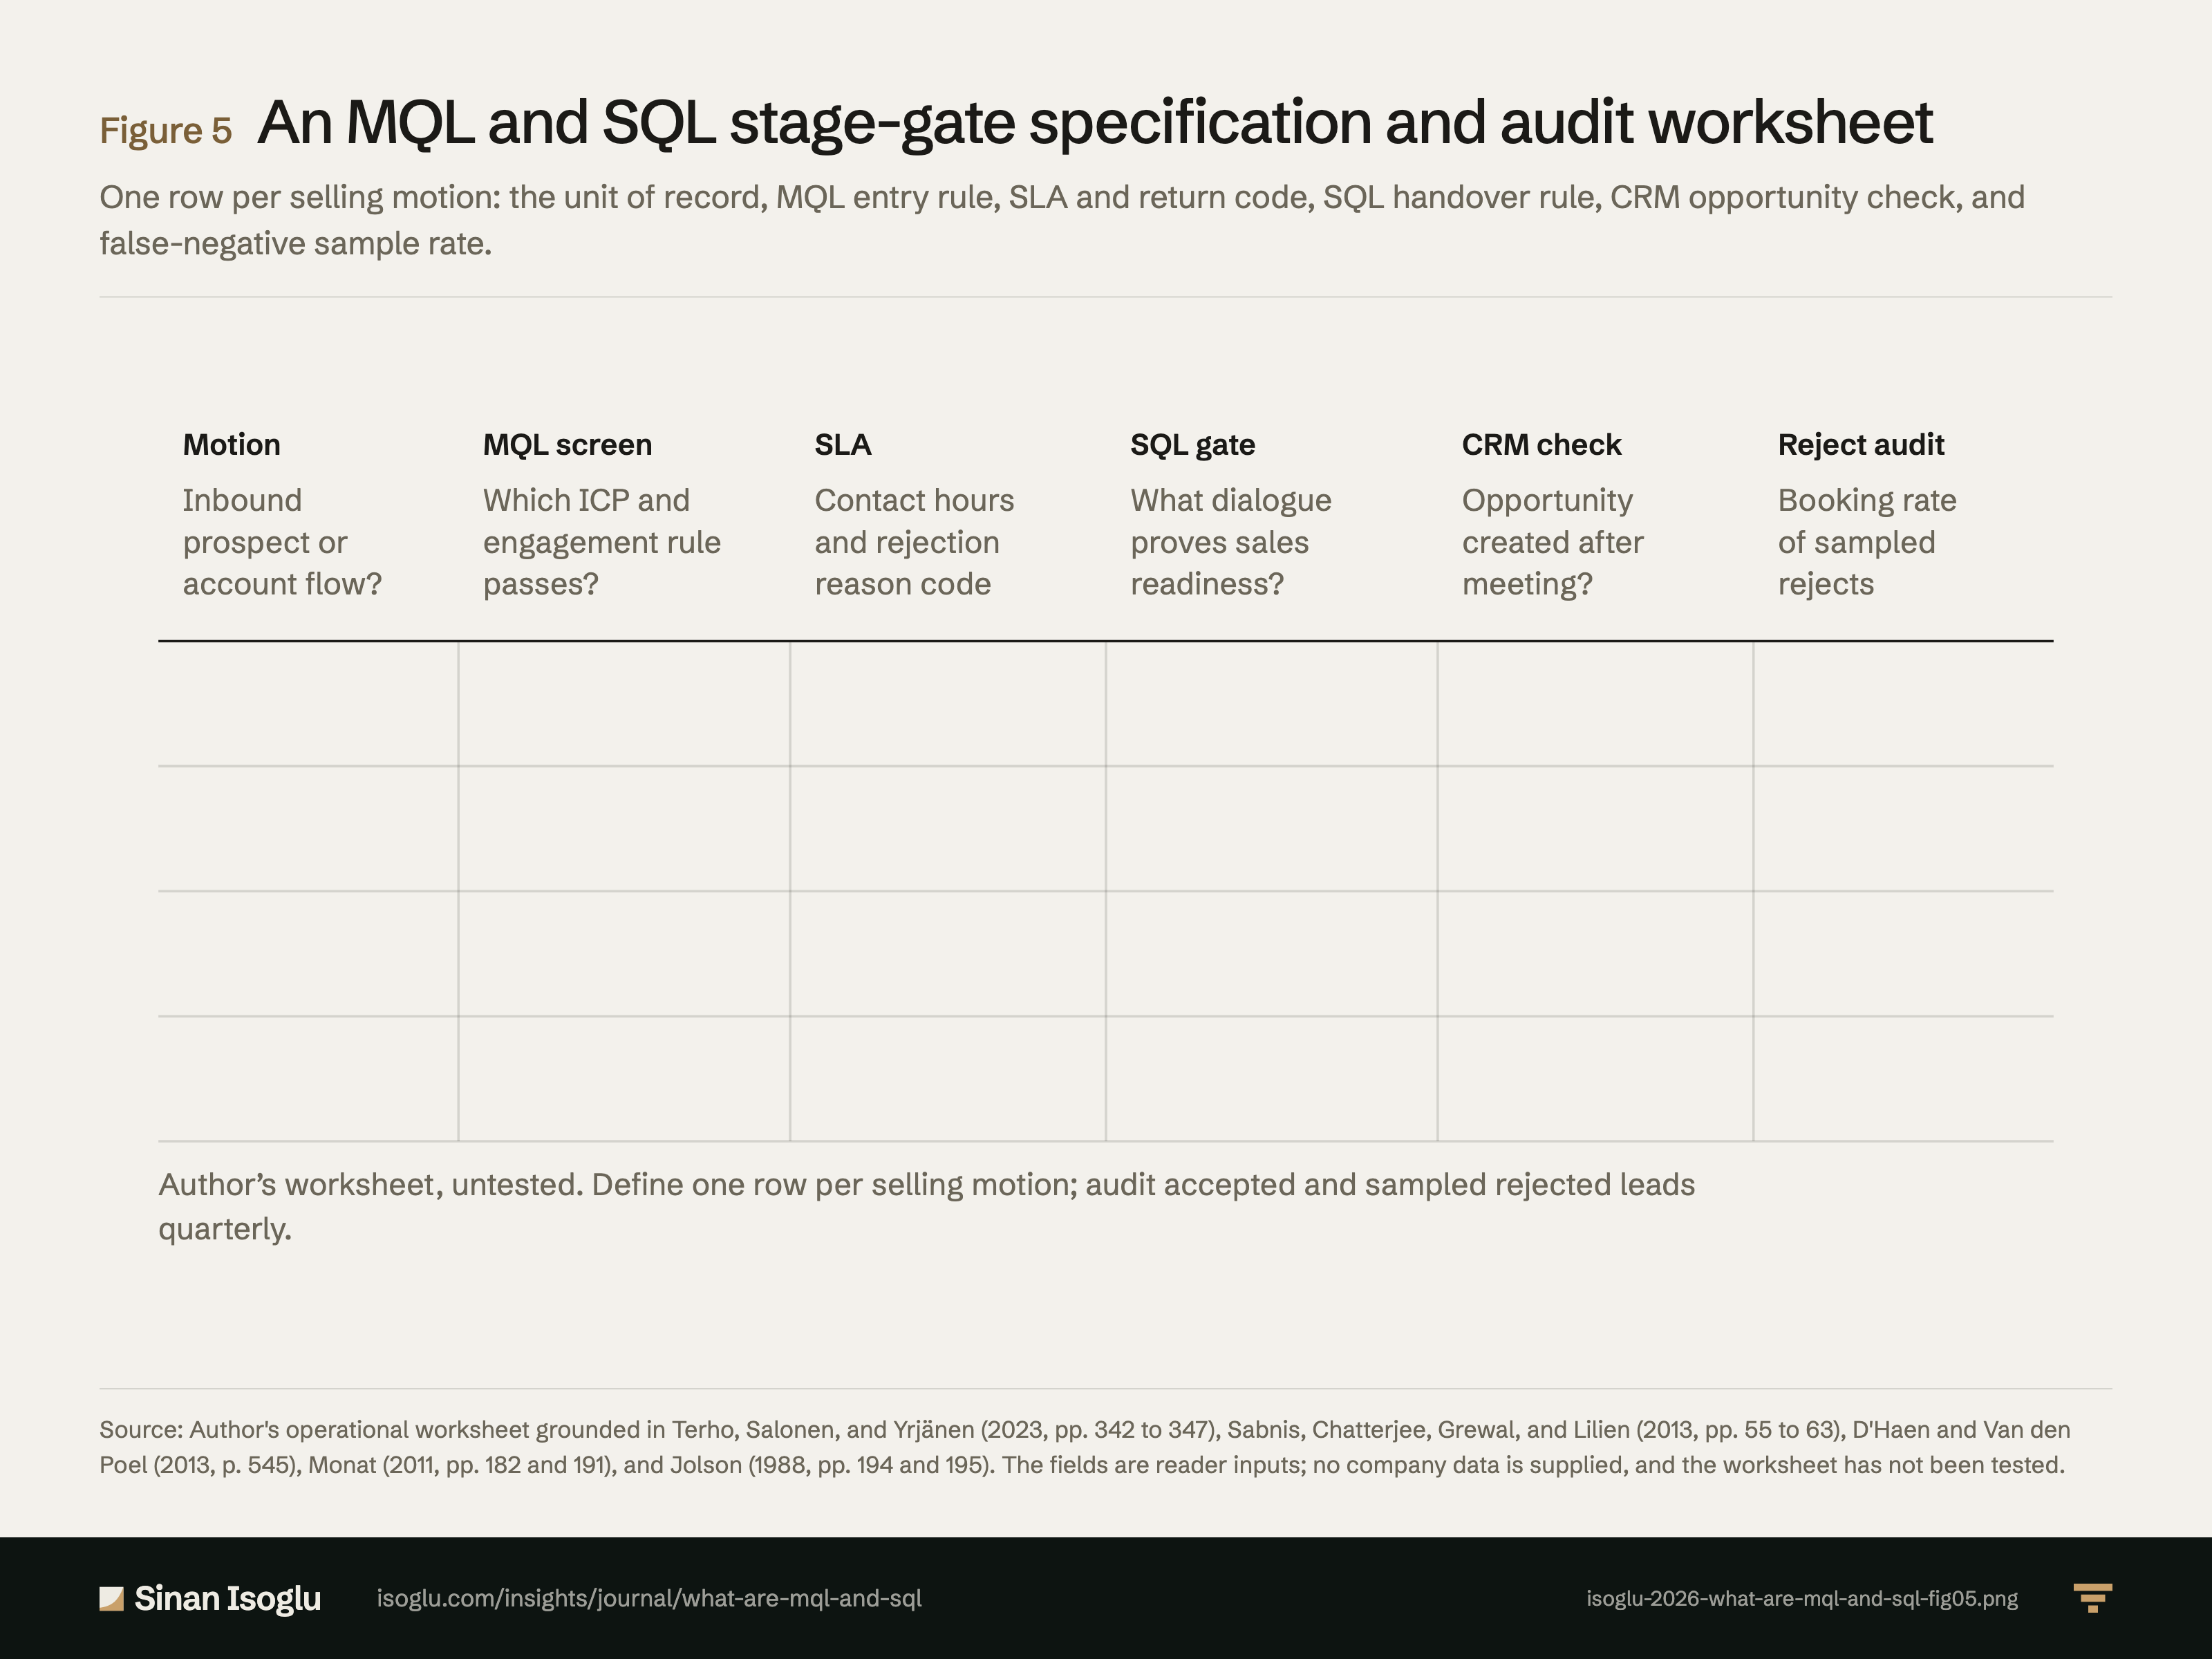
Figure 5Figure
An MQL and SQL stage-gate specification and audit worksheet
MQL and SQL: what are marketing- and sales-qualified leads?
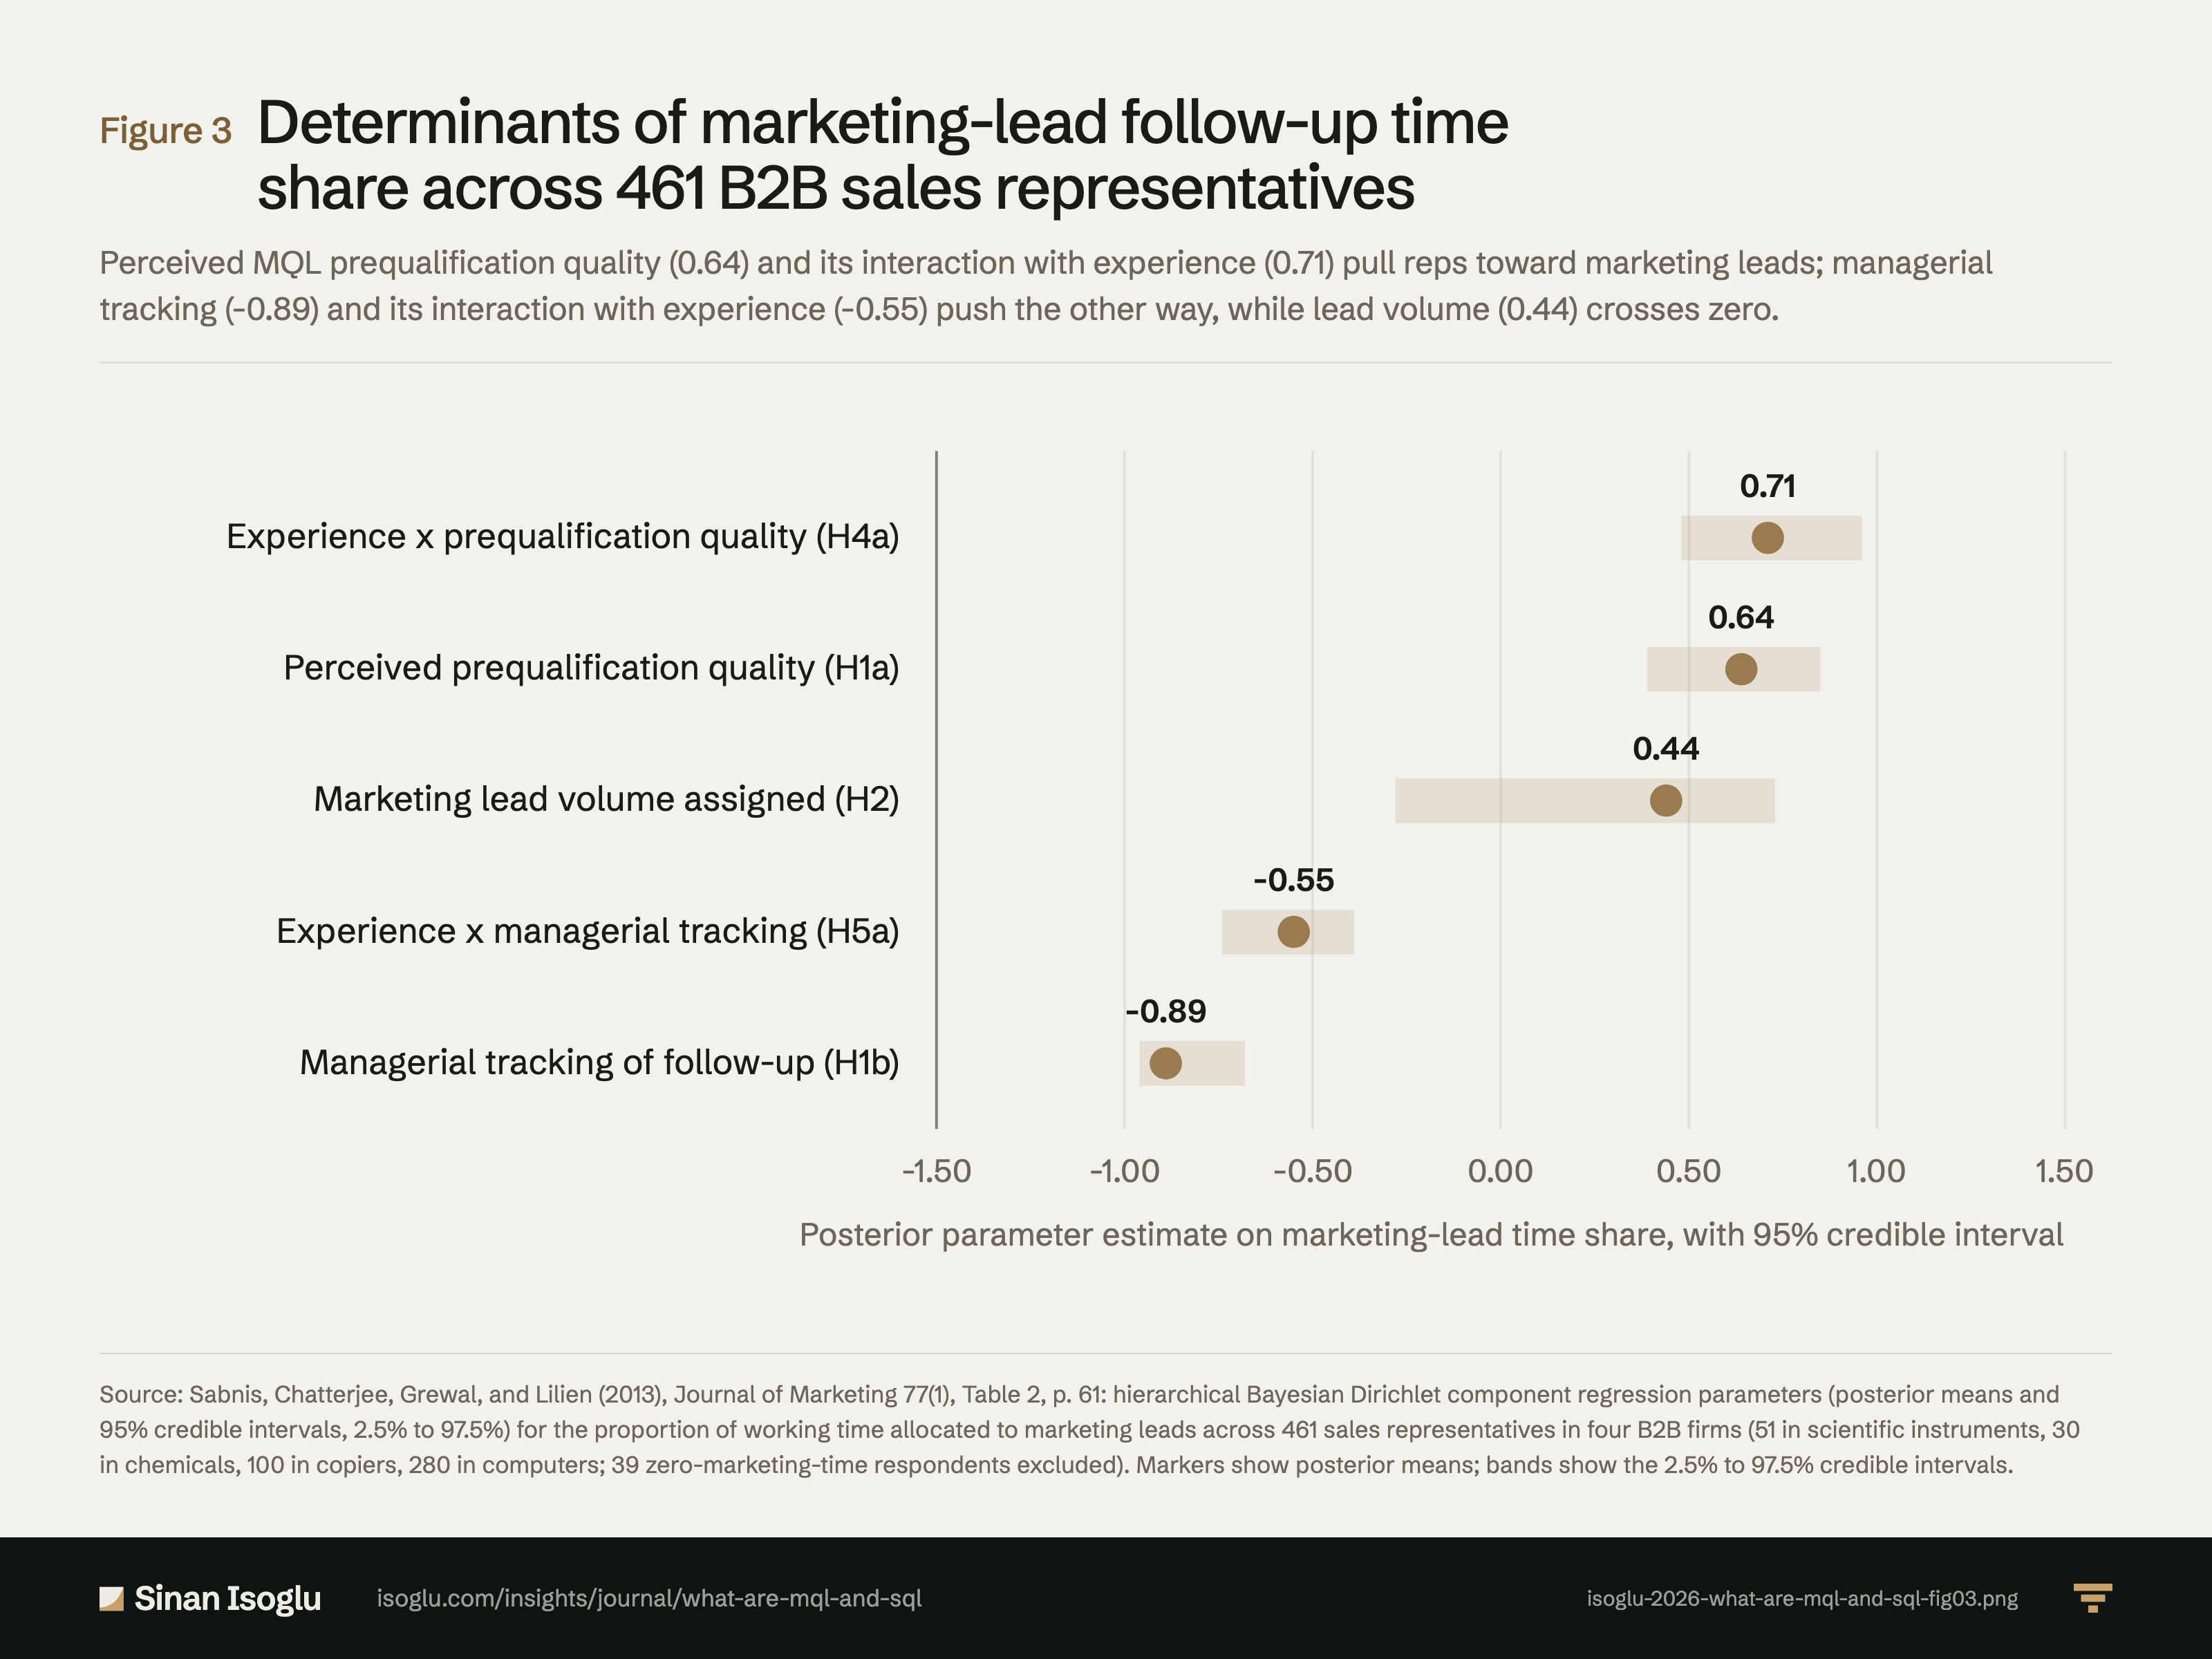
Figure 3Figure
Determinants of marketing-lead follow-up time share across 461 B2B sales representatives
MQL and SQL: what are marketing- and sales-qualified leads?
Contact
Bring the question you're working on.
Research, a guest lecture, or a commercial question.