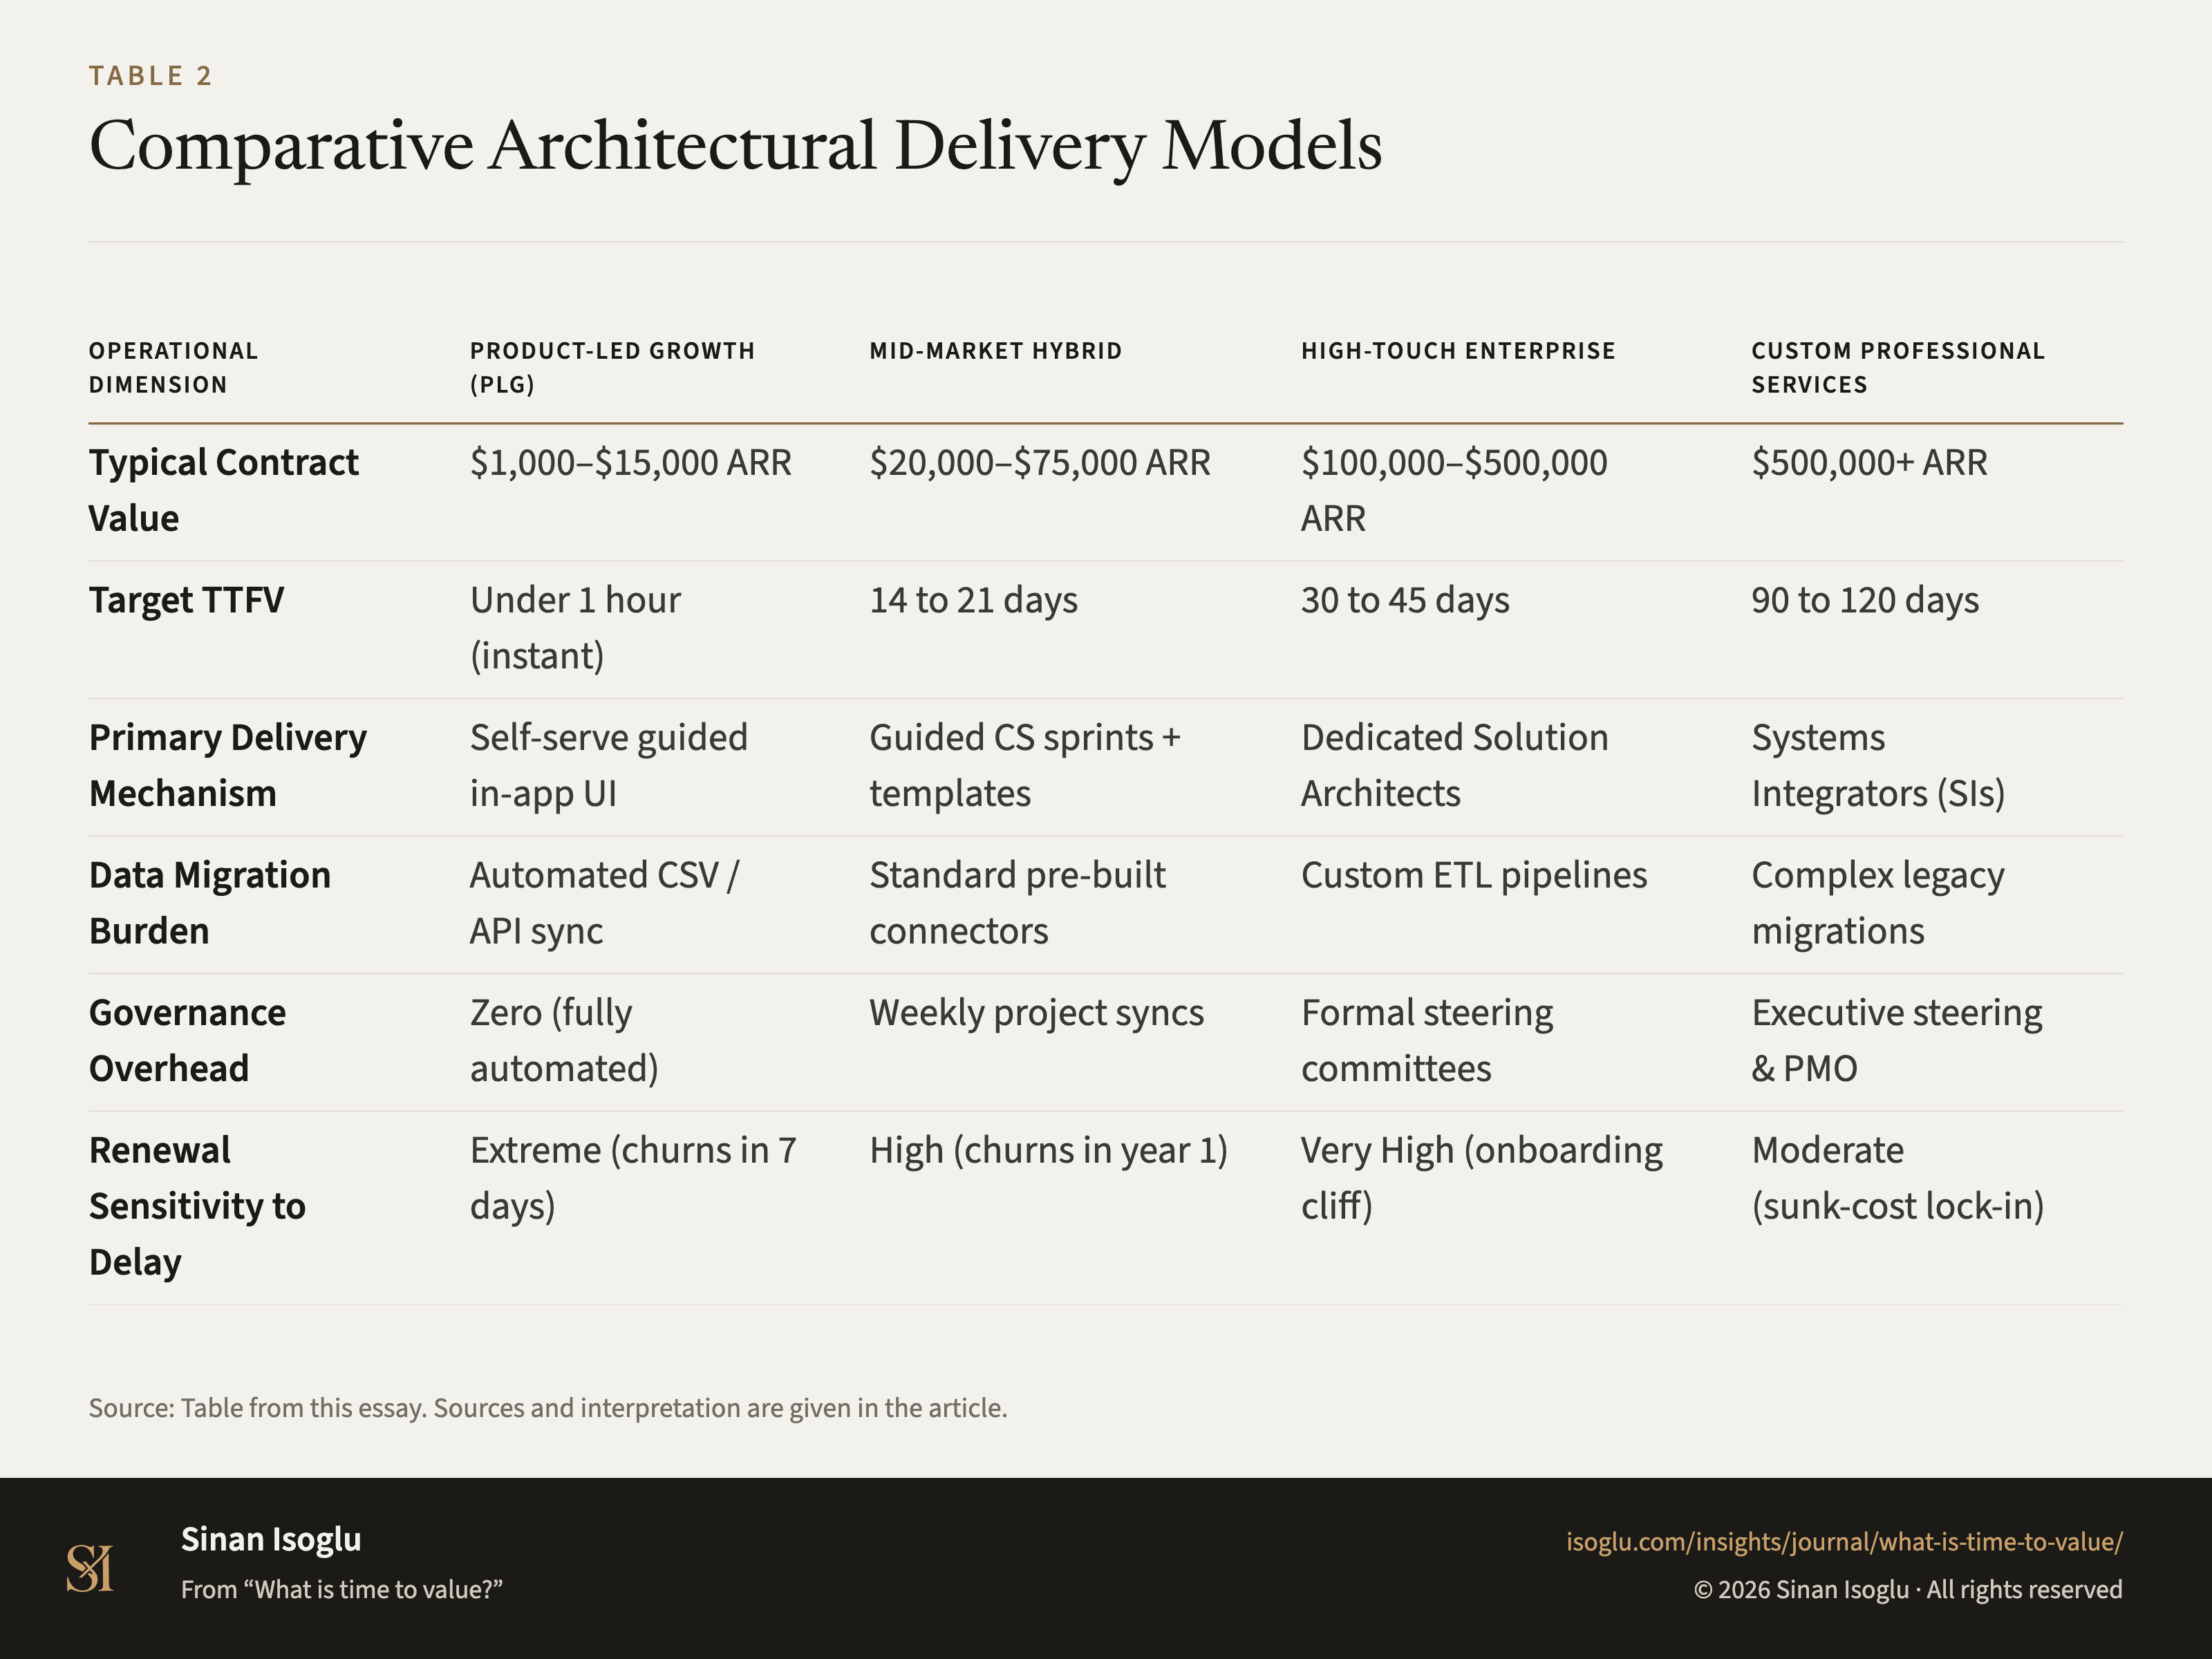
Table 1Comparative Architectural Delivery Models
| Operational Dimension | Product-Led Growth (PLG) | Mid-Market Hybrid | High-Touch Enterprise | Custom Professional Services |
|---|---|---|---|---|
| Typical Contract Value | \$1,000–\$15,000 ARR | \$20,000–\$75,000 ARR | \$100,000–\$500,000 ARR | \$500,000+ ARR |
| Target TTFV | Under 1 hour (instant) | 14 to 21 days | 30 to 45 days | 90 to 120 days |
| Primary Delivery Mechanism | Self-serve guided in-app UI | Guided CS sprints + templates | Dedicated Solution Architects | Systems Integrators (SIs) |
| Data Migration Burden | Automated CSV / API sync | Standard pre-built connectors | Custom ETL pipelines | Complex legacy migrations |
| Governance Overhead | Zero (fully automated) | Weekly project syncs | Formal steering committees | Executive steering & PMO |
| Renewal Sensitivity to Delay | Extreme (churns in 7 days) | High (churns in year 1) | Very High (onboarding cliff) | Moderate (sunk-cost lock-in) |
Swipe or scroll horizontally if the table is wider than your screen.
Source: Table from this essay. Sources and interpretation are given in the article.
PNG4:3, 1600 × 1200, with the title, the source line and the attribution set in the image isoglu-2026-what-is-time-to-value-fig03.png
From the essay
Growth that compounds
What is time to value?
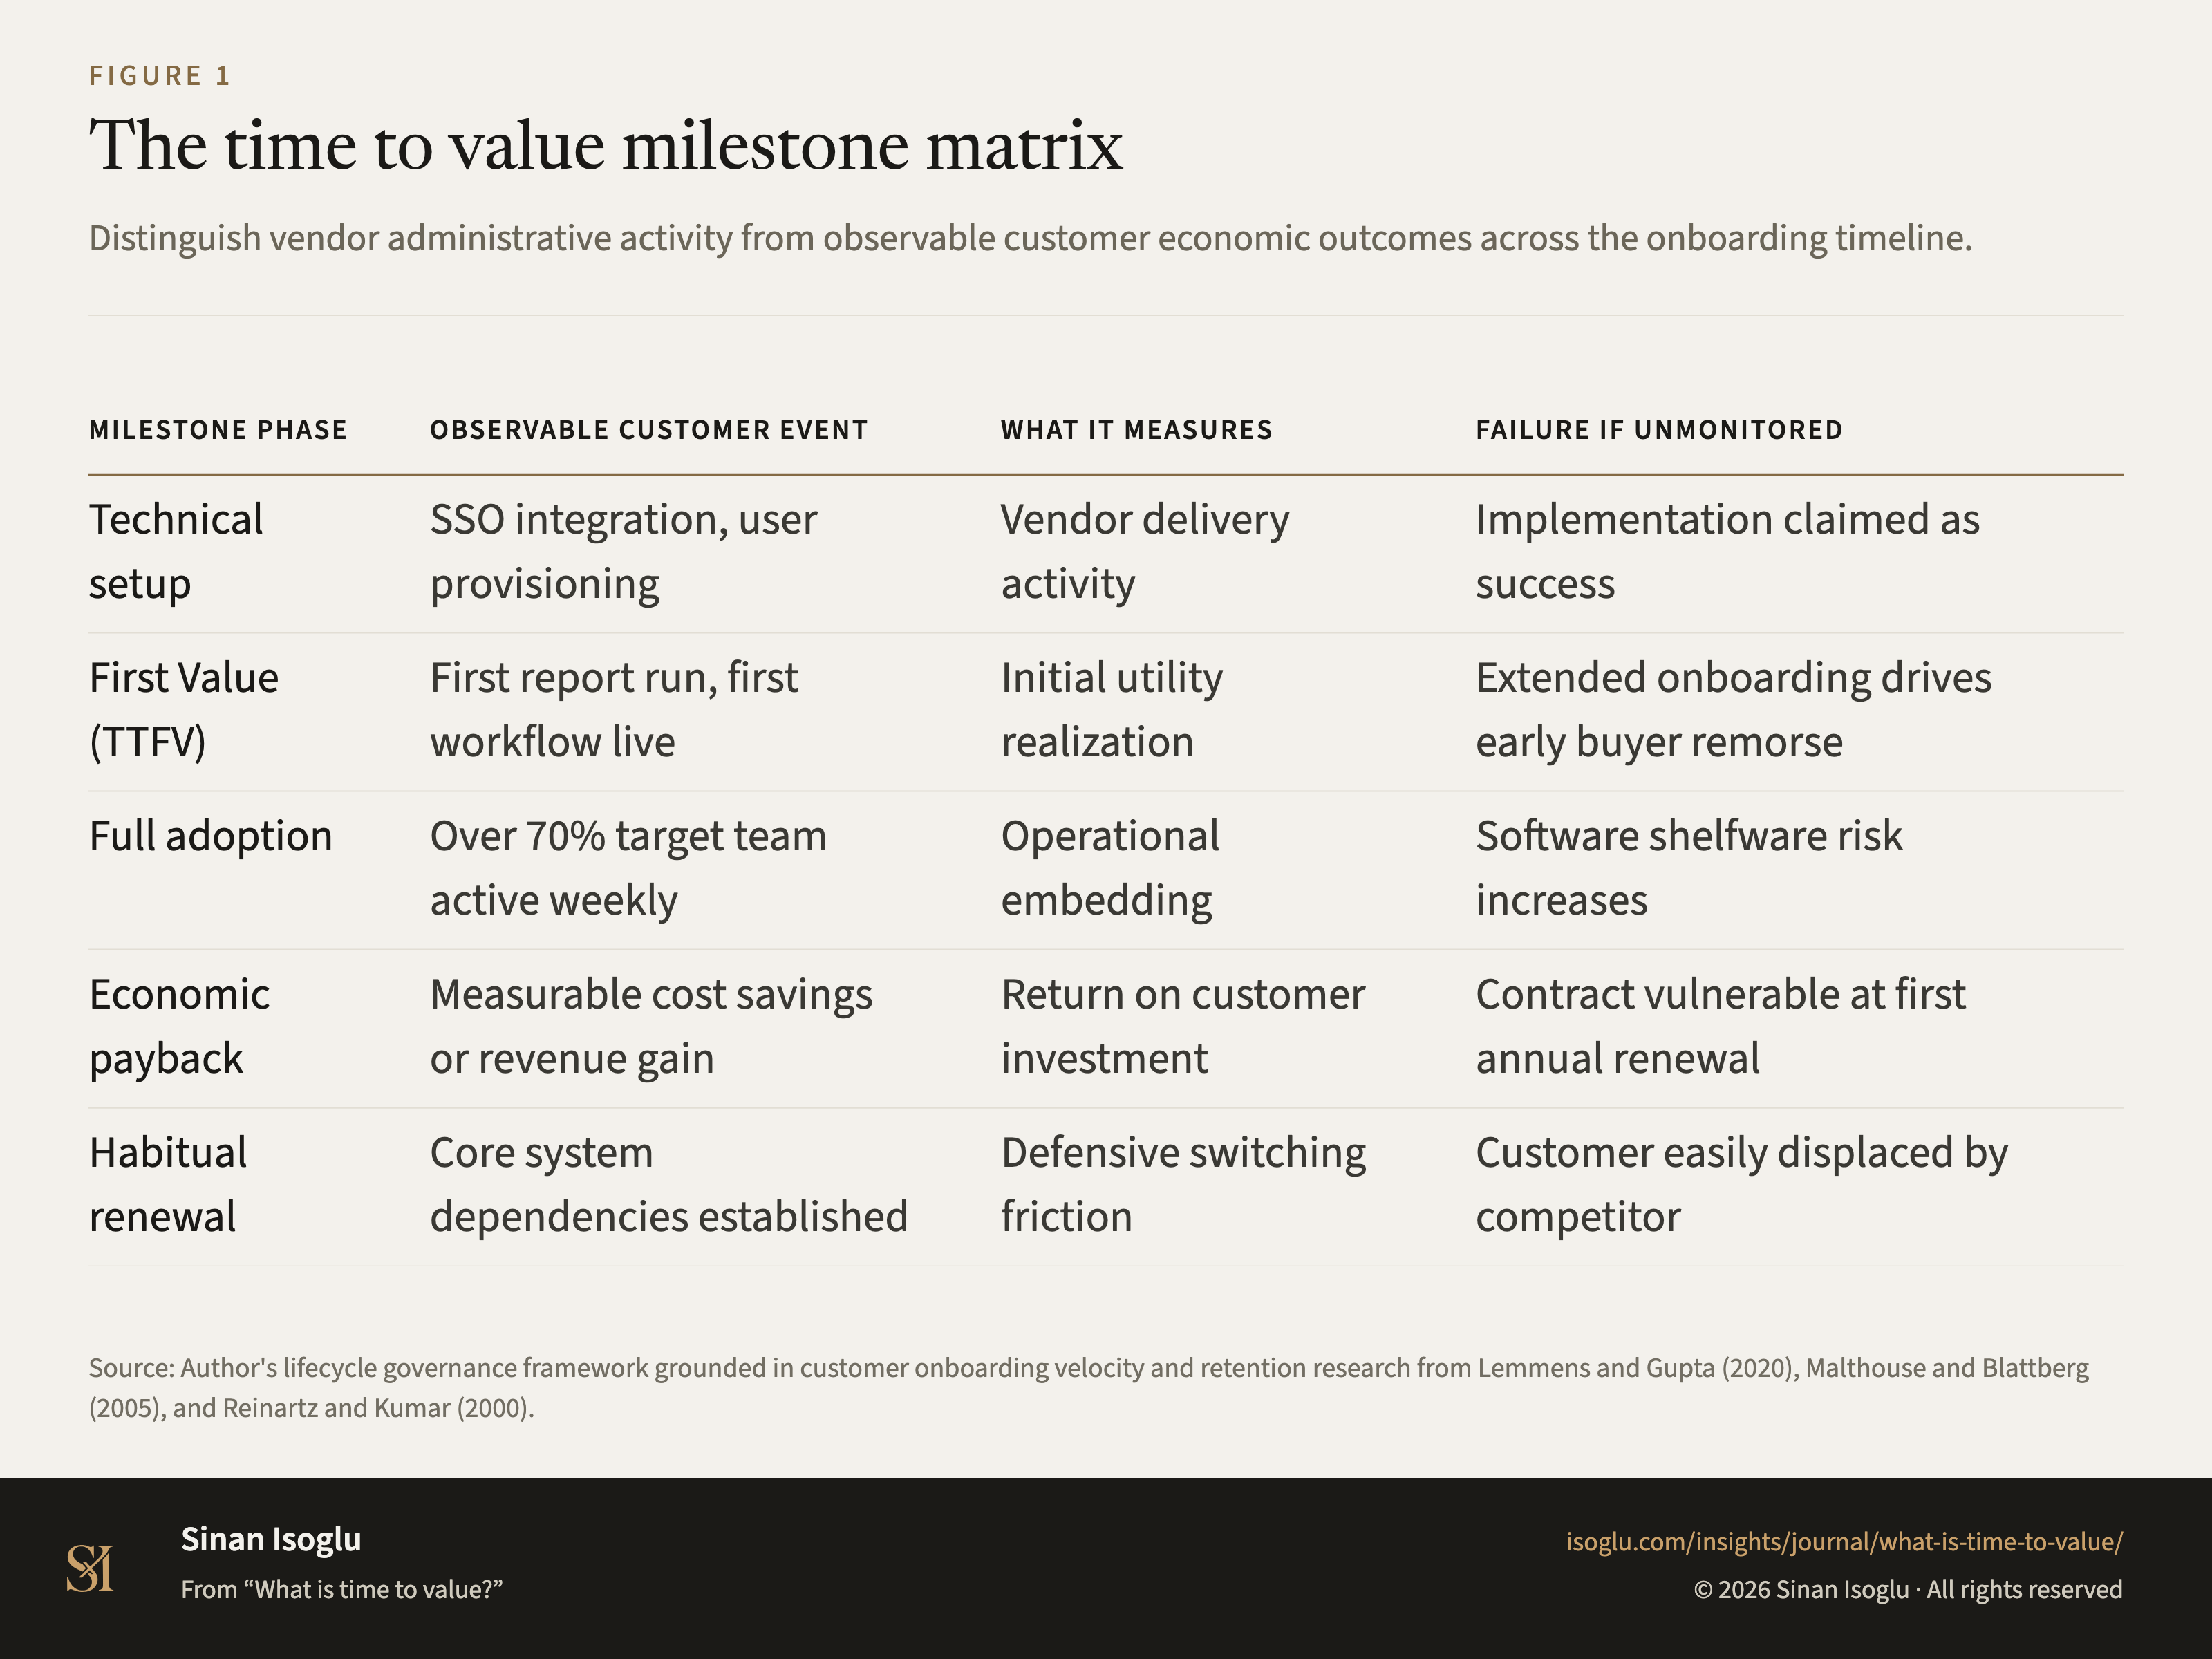
Time to value measures the elapsed duration from purchase to observable customer benefit. Distinguish technical completion from value realization.
Read the essayThis exhibit belongs to an essay: the numbers live here, the argument lives there.
Cite or embed
Contact
Bring the question you're working on.
Research, a guest lecture, or a commercial question.