Figure 1From “What is Simpson's paradox?”
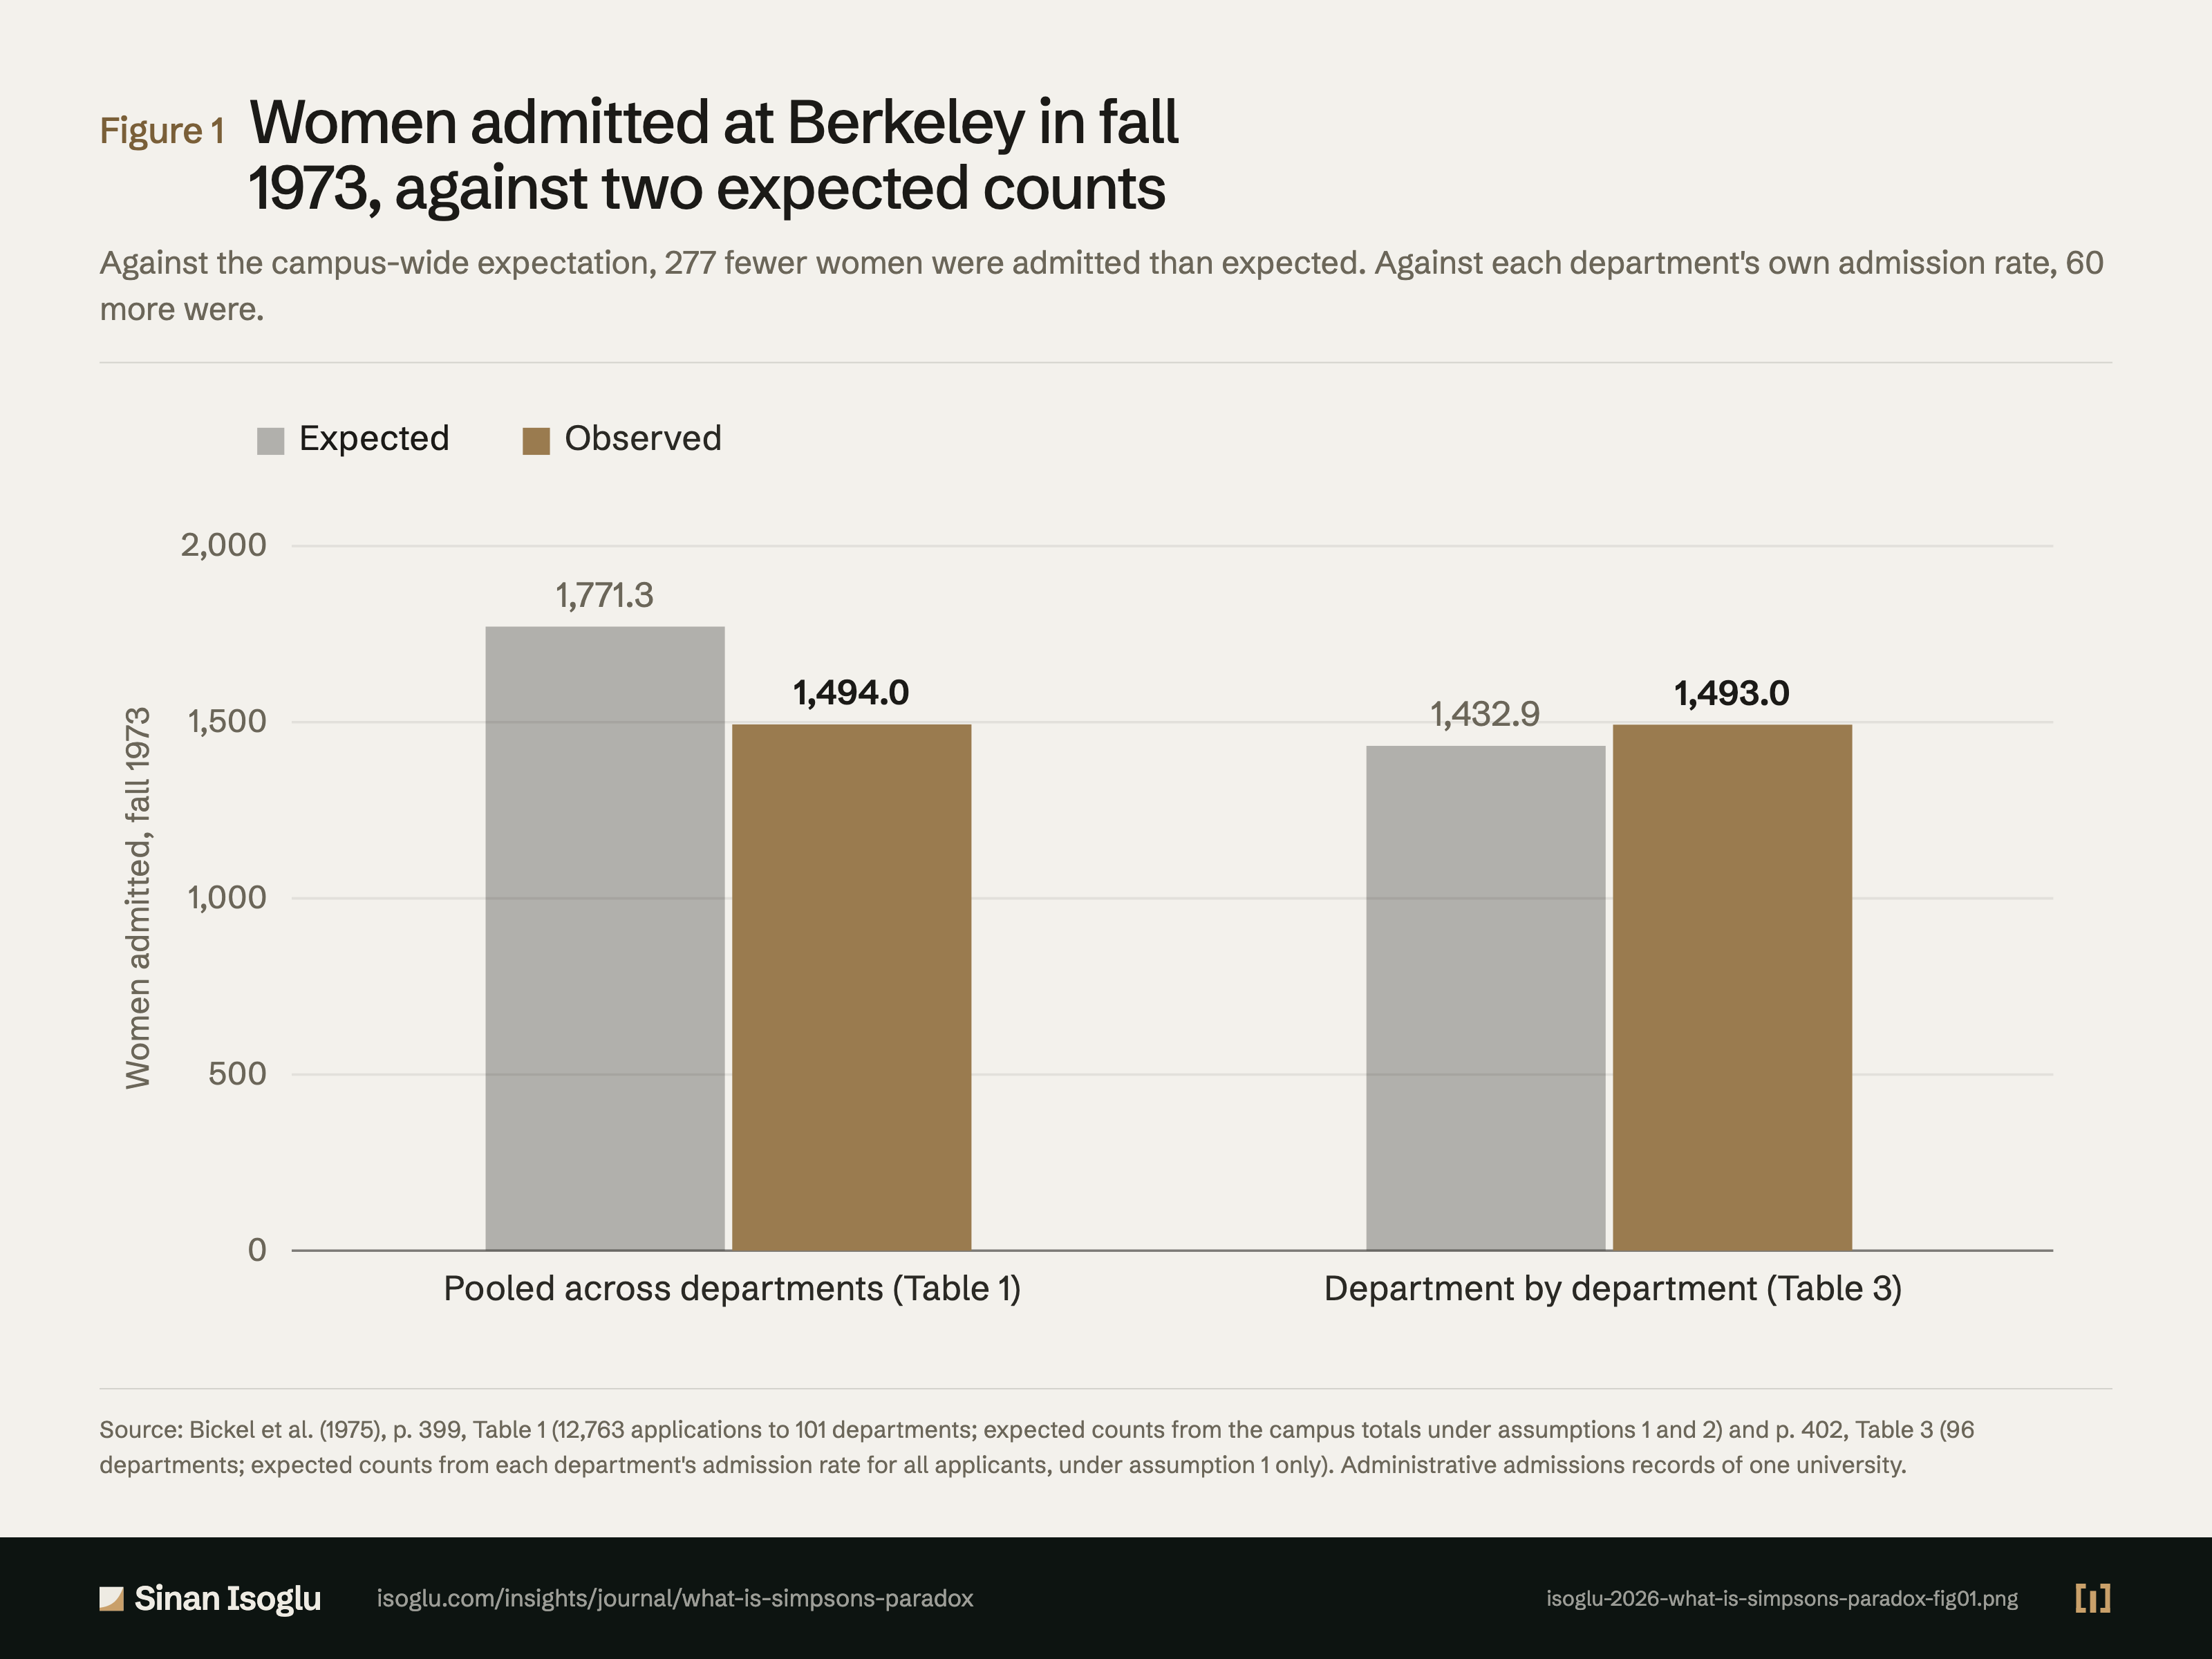
Women admitted at Berkeley in fall 1973, against two expected counts
Against the campus-wide expectation, 277 fewer women were admitted than expected. Against each department's own admission rate, 60 more were.
Figure 1Women admitted at Berkeley in fall 1973, against two expected counts
Source: Bickel et al. (1975), p. 399, Table 1 (12,763 applications to 101 departments; expected counts from the campus totals under assumptions 1 and 2) and p. 402, Table 3 (96 departments; expected counts from each department's admission rate for all applicants, under assumption 1 only). Administrative admissions records of one university.
Source and evidence
Each line names a claim related to this exhibit, its source, and how it was checked.
- A BHO75-C1 Berkeley graduate admissions for fall 1973: 12,763 applications to 101 departments, 8,442 from men and 4,321 from women; about 44% of the men and 35% of the women admitted; expected frequencies from the marginal totals under assumptions 1 and 2 give 277 fewer women and 277 more men admitted than expected, chi-square 110.8; Table 1 prints men 3,738 admitted and 4,704 denied, women 1,494 admitted and 2,827 denied, expected admissions 3,460.7 for men and 1,771.3 for women (pp. 398, 399, Table 1): "were 8442 male applicants and 4321"; "of the males and about 35 percent of"; "chi-square value for this table is 110.8,"Bickel, Hammel & O'Connell (1975) · Bickel, Hammel & O'Connell. (1975)
- A BHO75-C6 Expected women admitted computed department by department (each department's admission rate for all applicants times its women applicants, summed): 1,432.9 expected, 1,493.0 observed, difference 60.1, chi-square 8.55, P = .003 two-tailed; 96 departments, five with a single applicant left out; the test was proposed in another context by Cochran and by Mantel and Haenszel (pp. 401, 402, Table 3): "Expected female admittees"; "Observed female admittees"; "Ninety-six departments"Bickel, Hammel & O'Connell (1975) · Bickel, Hammel & O'Connell. (1975)
Grades: A, verified against the printed page of the primary source · B, primary source, text layer only · C, authoritative secondary · D, reported.
From the essay
From the research bench
What is Simpson's paradox?
Simpson's paradox: an association that holds in every subgroup reverses when the groups are pooled. Which table to trust is a causal question.
Read the essayThis exhibit belongs to an essay: the numbers live here, the argument lives there.
Cite or embed
Related exhibits
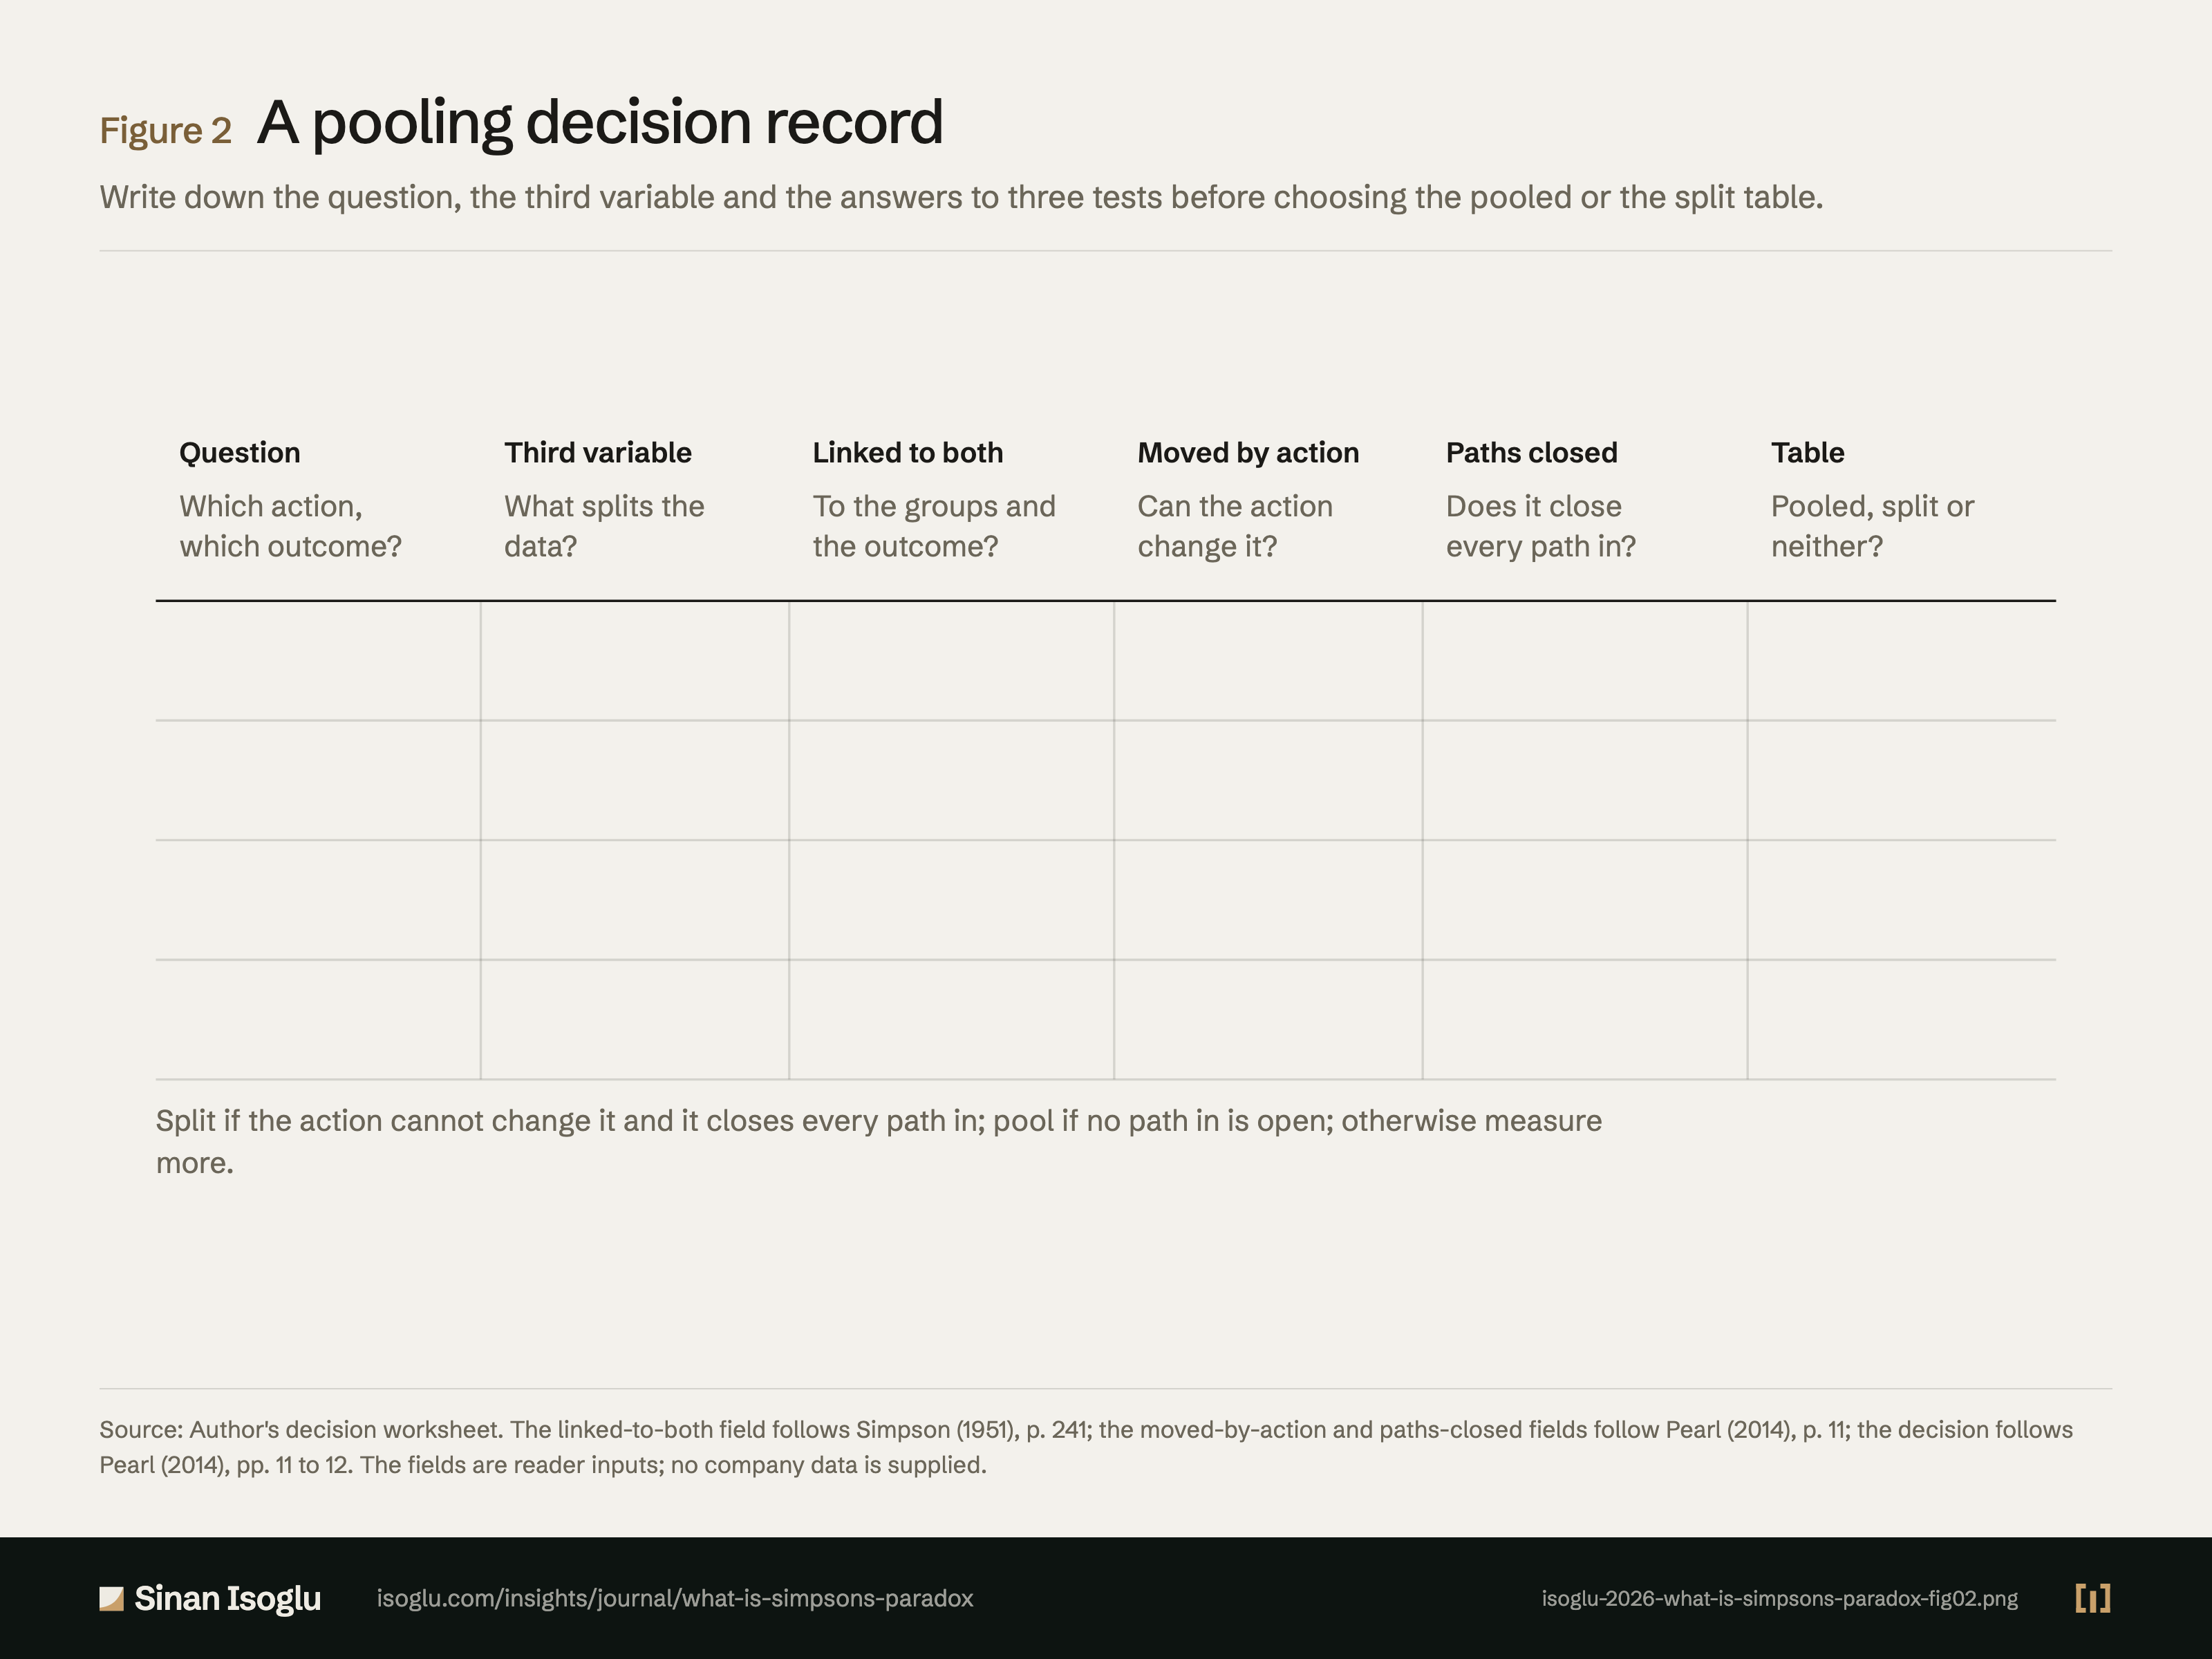
Figure 2Figure
A pooling decision record
What is Simpson's paradox?
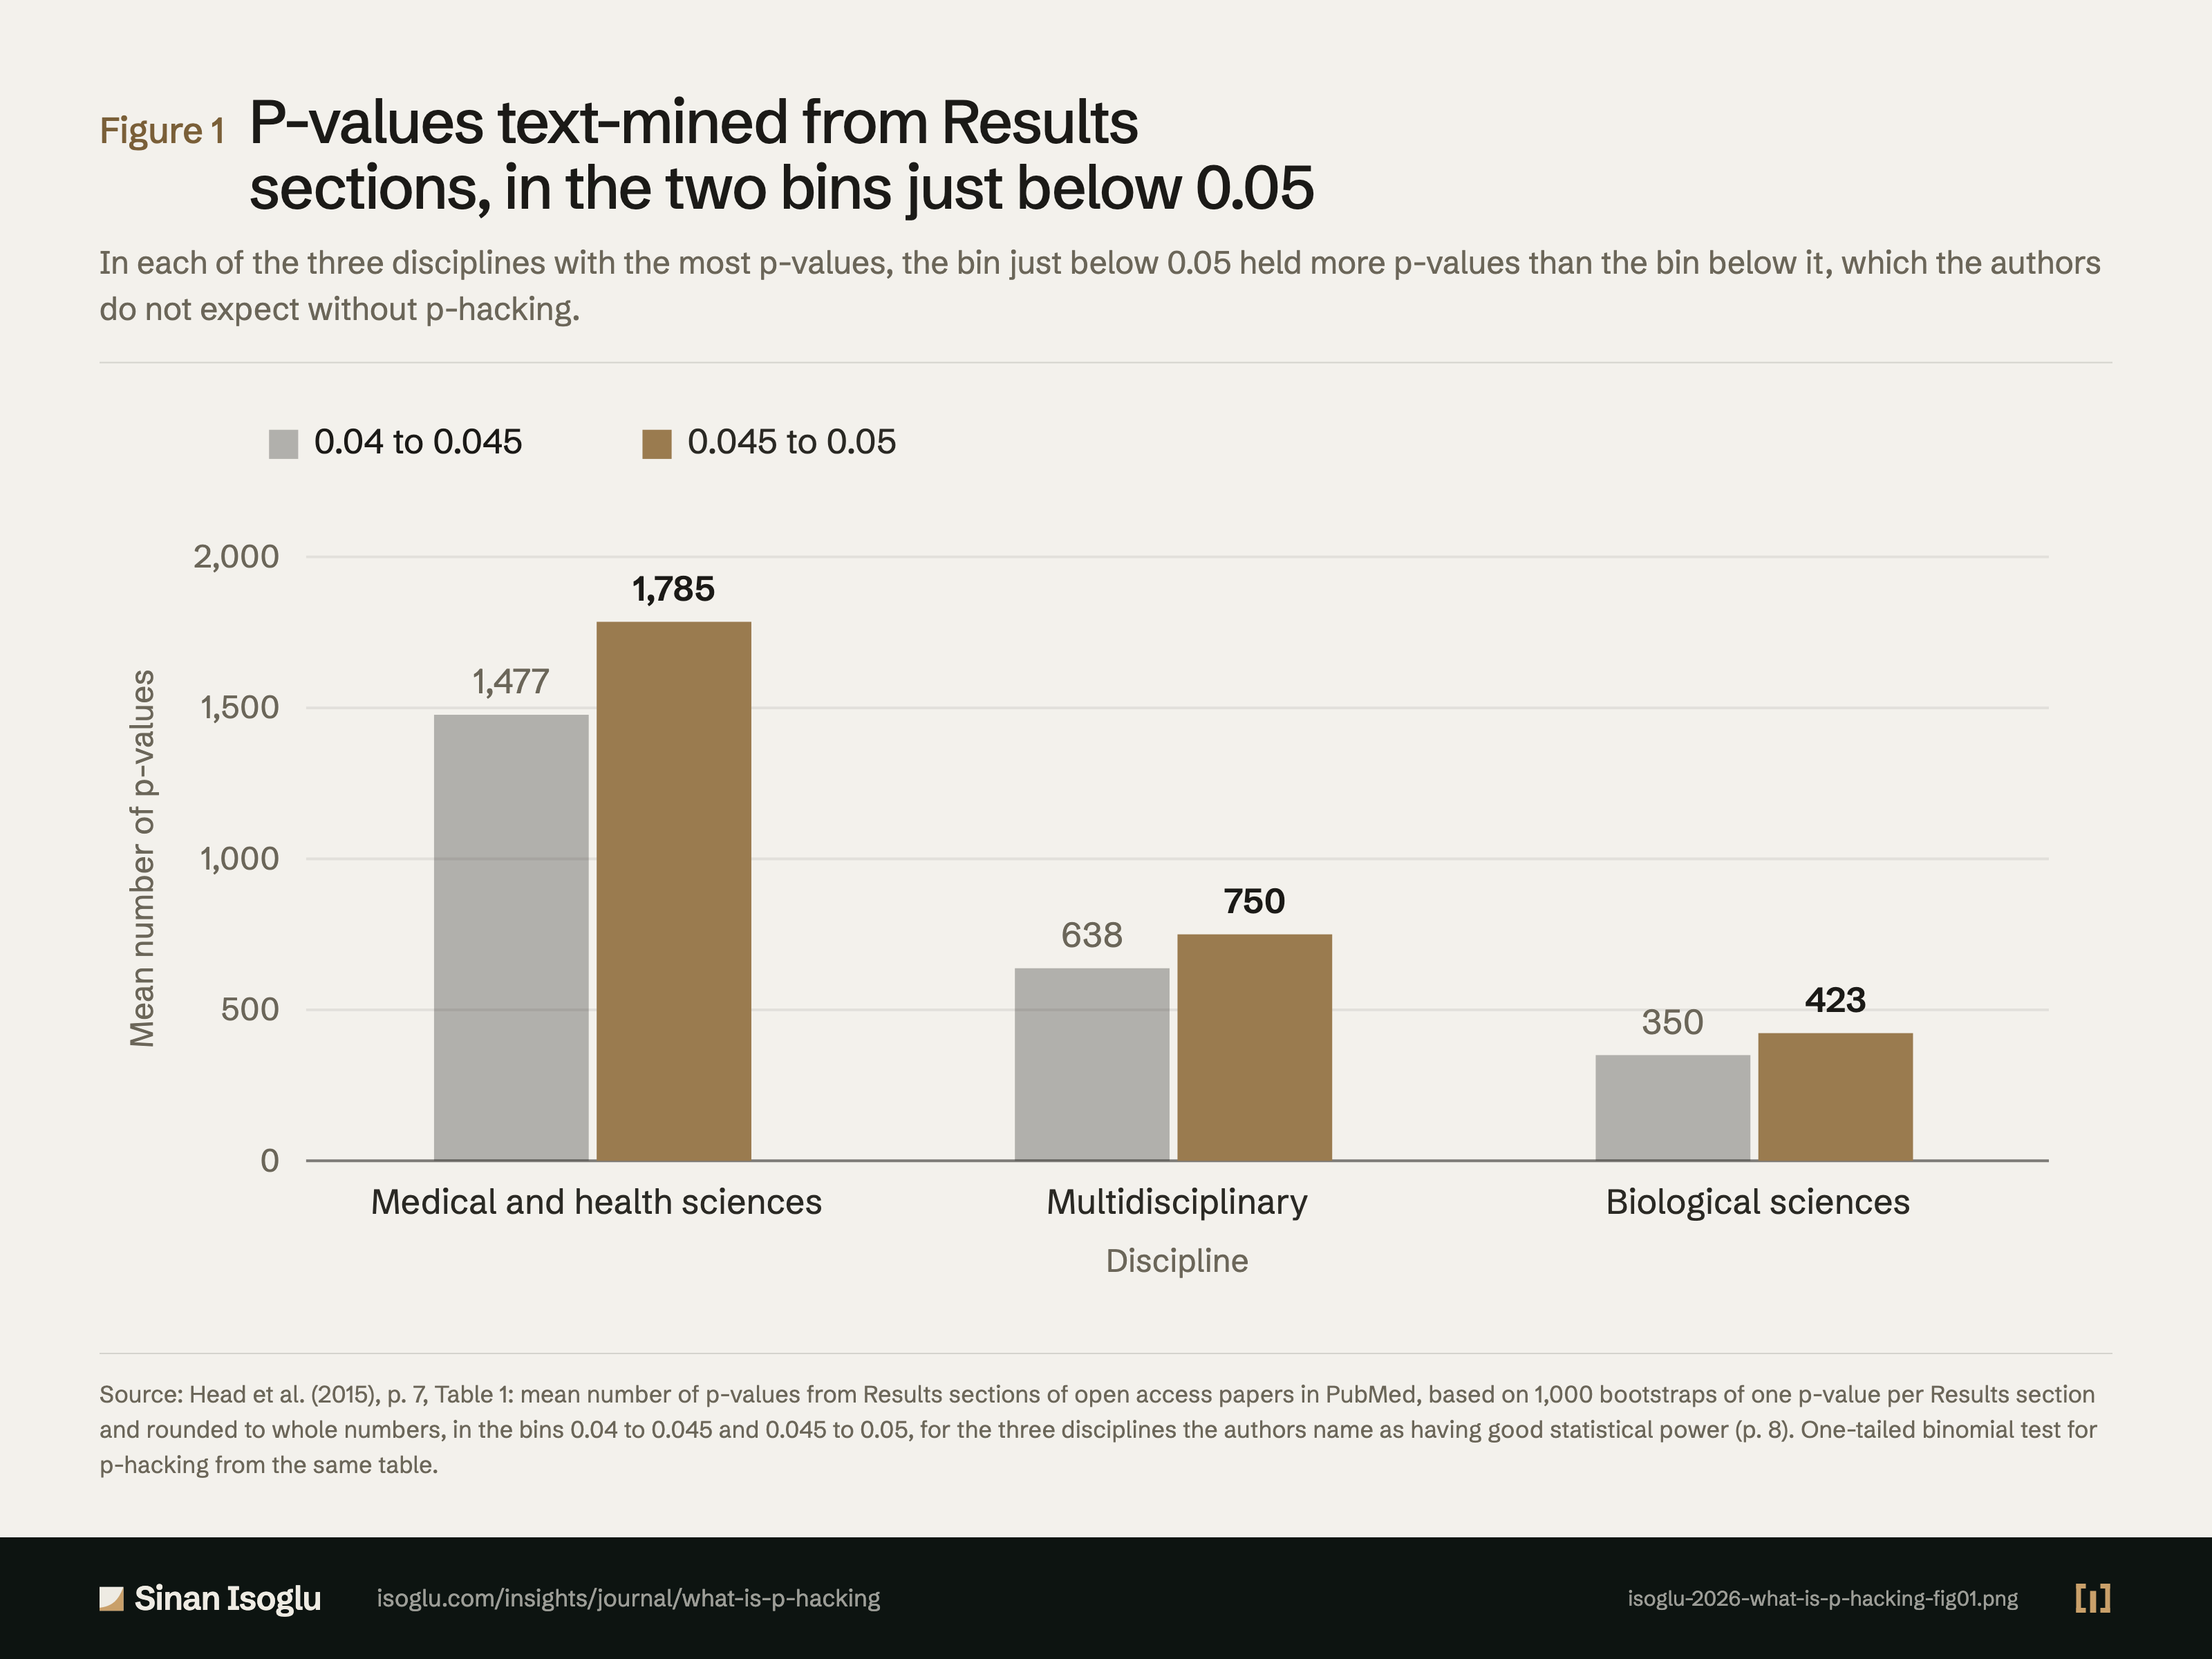
Figure 1Figure
P-values text-mined from Results sections, in the two bins just below 0.05
What is p-hacking?
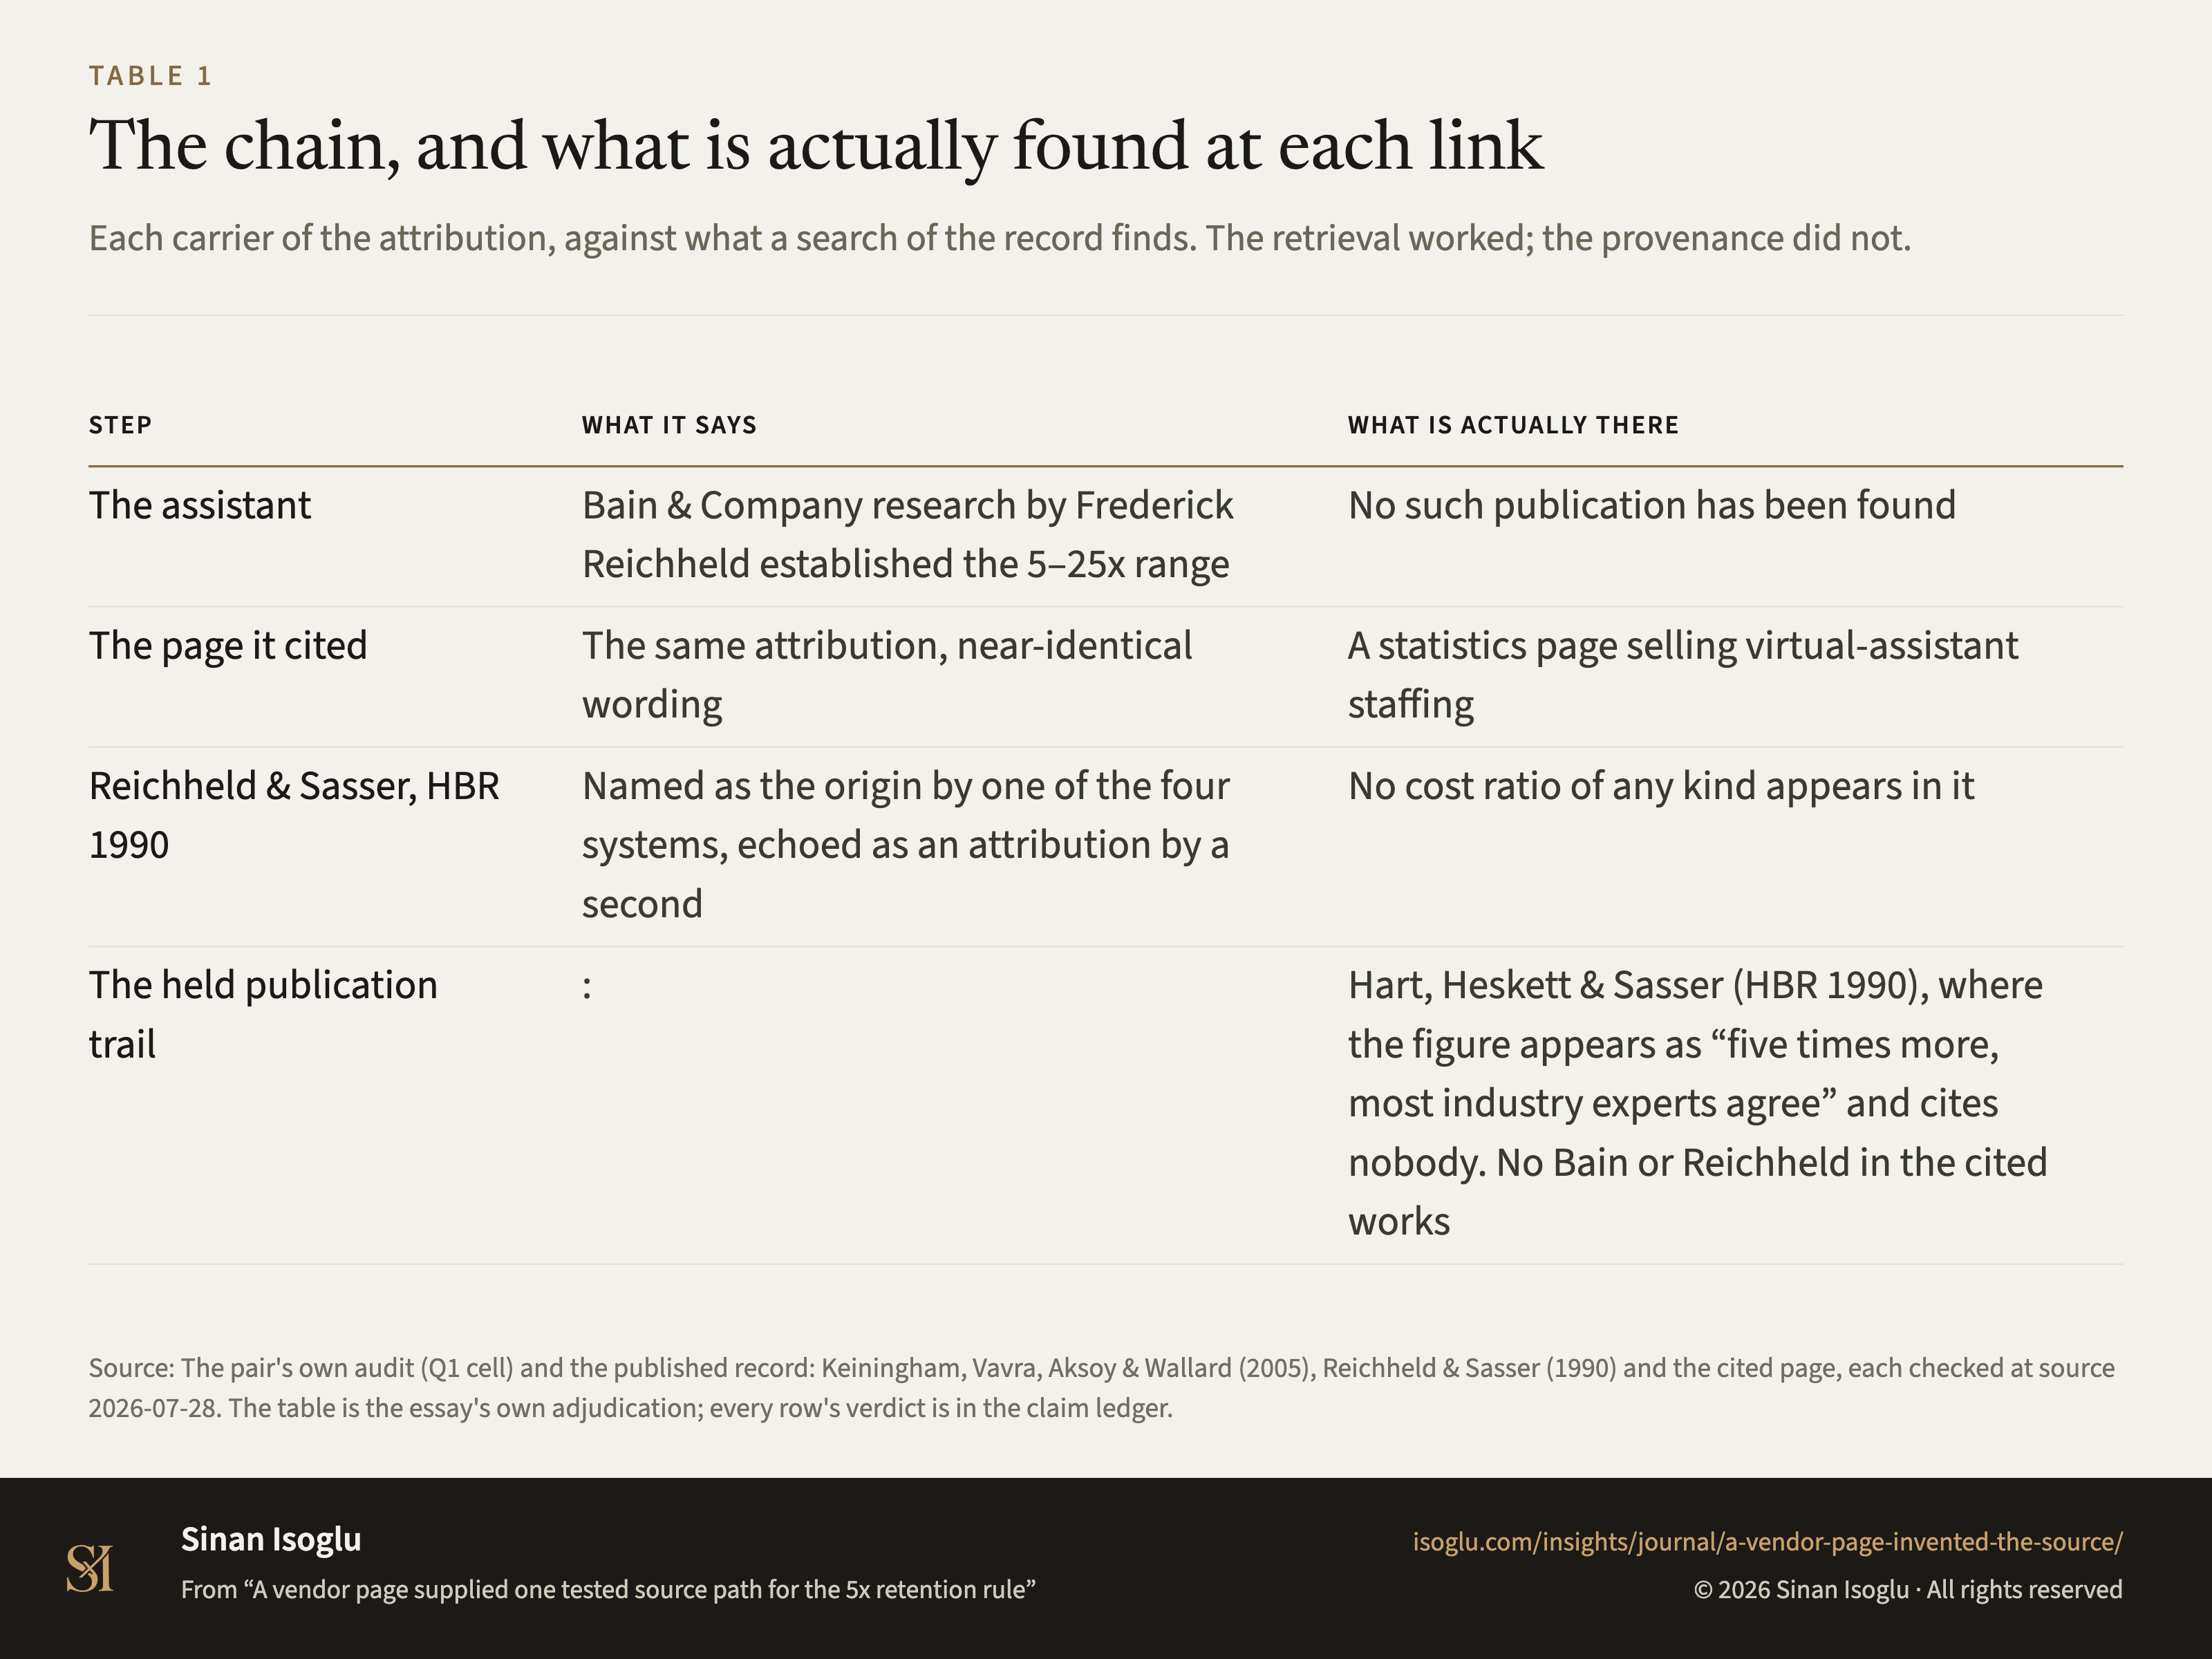
Table 1Table
The chain, and what is actually found at each link
A vendor page supplied one tested source path for the 5x retention rule
Contact
Bring the question you're working on.
Research, a guest lecture, or a commercial question.