Figure 1From “What is regression to the mean?”
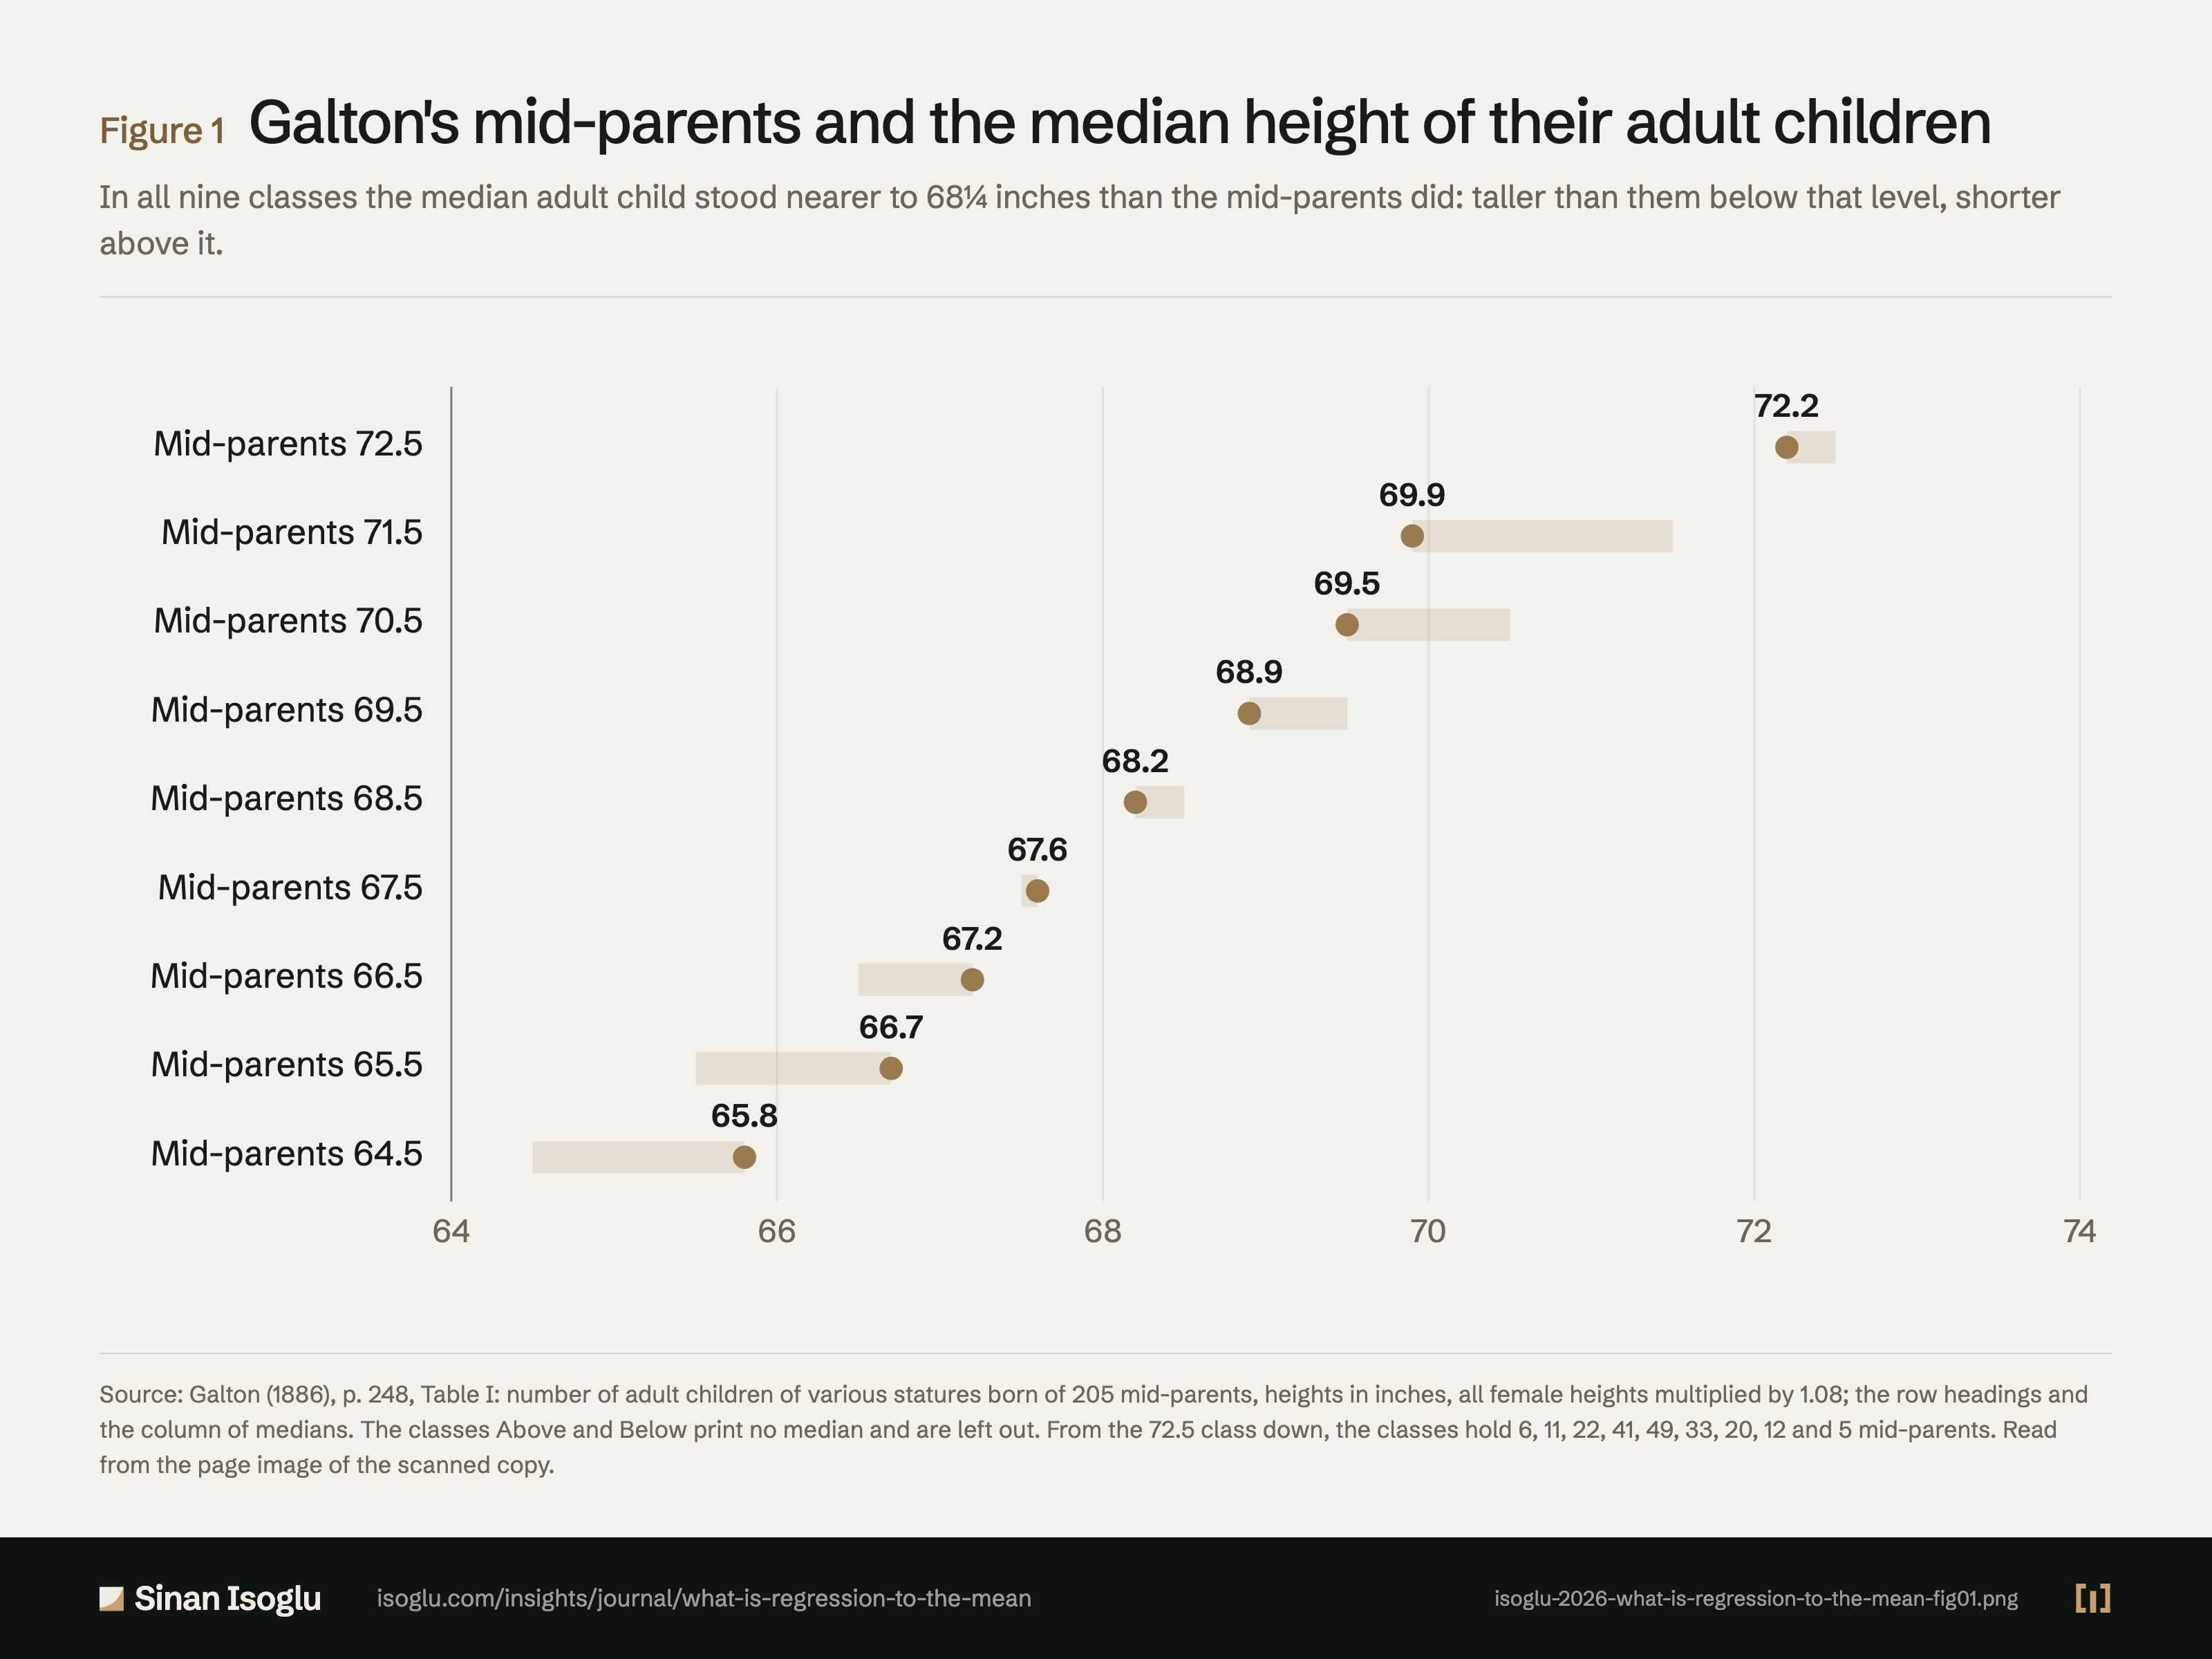
Galton's mid-parents and the median height of their adult children
In all nine classes the median adult child stood nearer to 68¼ inches than the mid-parents did: taller than them below that level, shorter above it.
Figure 1Galton's mid-parents and the median height of their adult children
Source: Galton (1886), p. 248, Table I: number of adult children of various statures born of 205 mid-parents, heights in inches, all female heights multiplied by 1.08; the row headings and the column of medians. The classes Above and Below print no median and are left out. From the 72.5 class down, the classes hold 6, 11, 22, 41, 49, 33, 20, 12 and 5 mid-parents. Read from the page image of the scanned copy.
Source and evidence
Each line names a claim related to this exhibit, its source, and how it was checked.
- A GAL86-C4 Table I, number of adult children of various statures born of 205 mid-parents, all female heights multiplied by 1.08: median height of the adult children by class of mid-parental height, class 72.5 median 72.2, 71.5 median 69.9, 70.5 median 69.5, 69.5 median 68.9, 68.5 median 68.2, 67.5 median 67.6, 66.5 median 67.2, 65.5 median 66.7, 64.5 median 65.8; the classes Above and Below print no median; the nine classes hold 6, 11, 22, 41, 49, 33, 20, 12 and 5 mid-parents; totals 928 adult children and 205 mid-parents; the note to the table says the children's columns are headed 62.2, 63.2 and so on instead of 62.5, 63.5 because the observations are unequally distributed, with a strong bias in favour of integral inches, an inequality not apparent for the mid-parents (p. 248, read from the page image): "Number of adult children of various statures born of 205"; "all female heights have been"; "The reason why the headings run"Galton (1886) · Galton. (1886)
Grades: A, verified against the printed page of the primary source · B, primary source, text layer only · C, authoritative secondary · D, reported.
From the essay
From the research bench
What is regression to the mean?
Regression to the mean: after an extreme measurement, the next tends to be less extreme. In a group chosen for that extreme, it can look like real change.
Read the essayThis exhibit belongs to an essay: the numbers live here, the argument lives there.
Cite or embed
Related exhibits
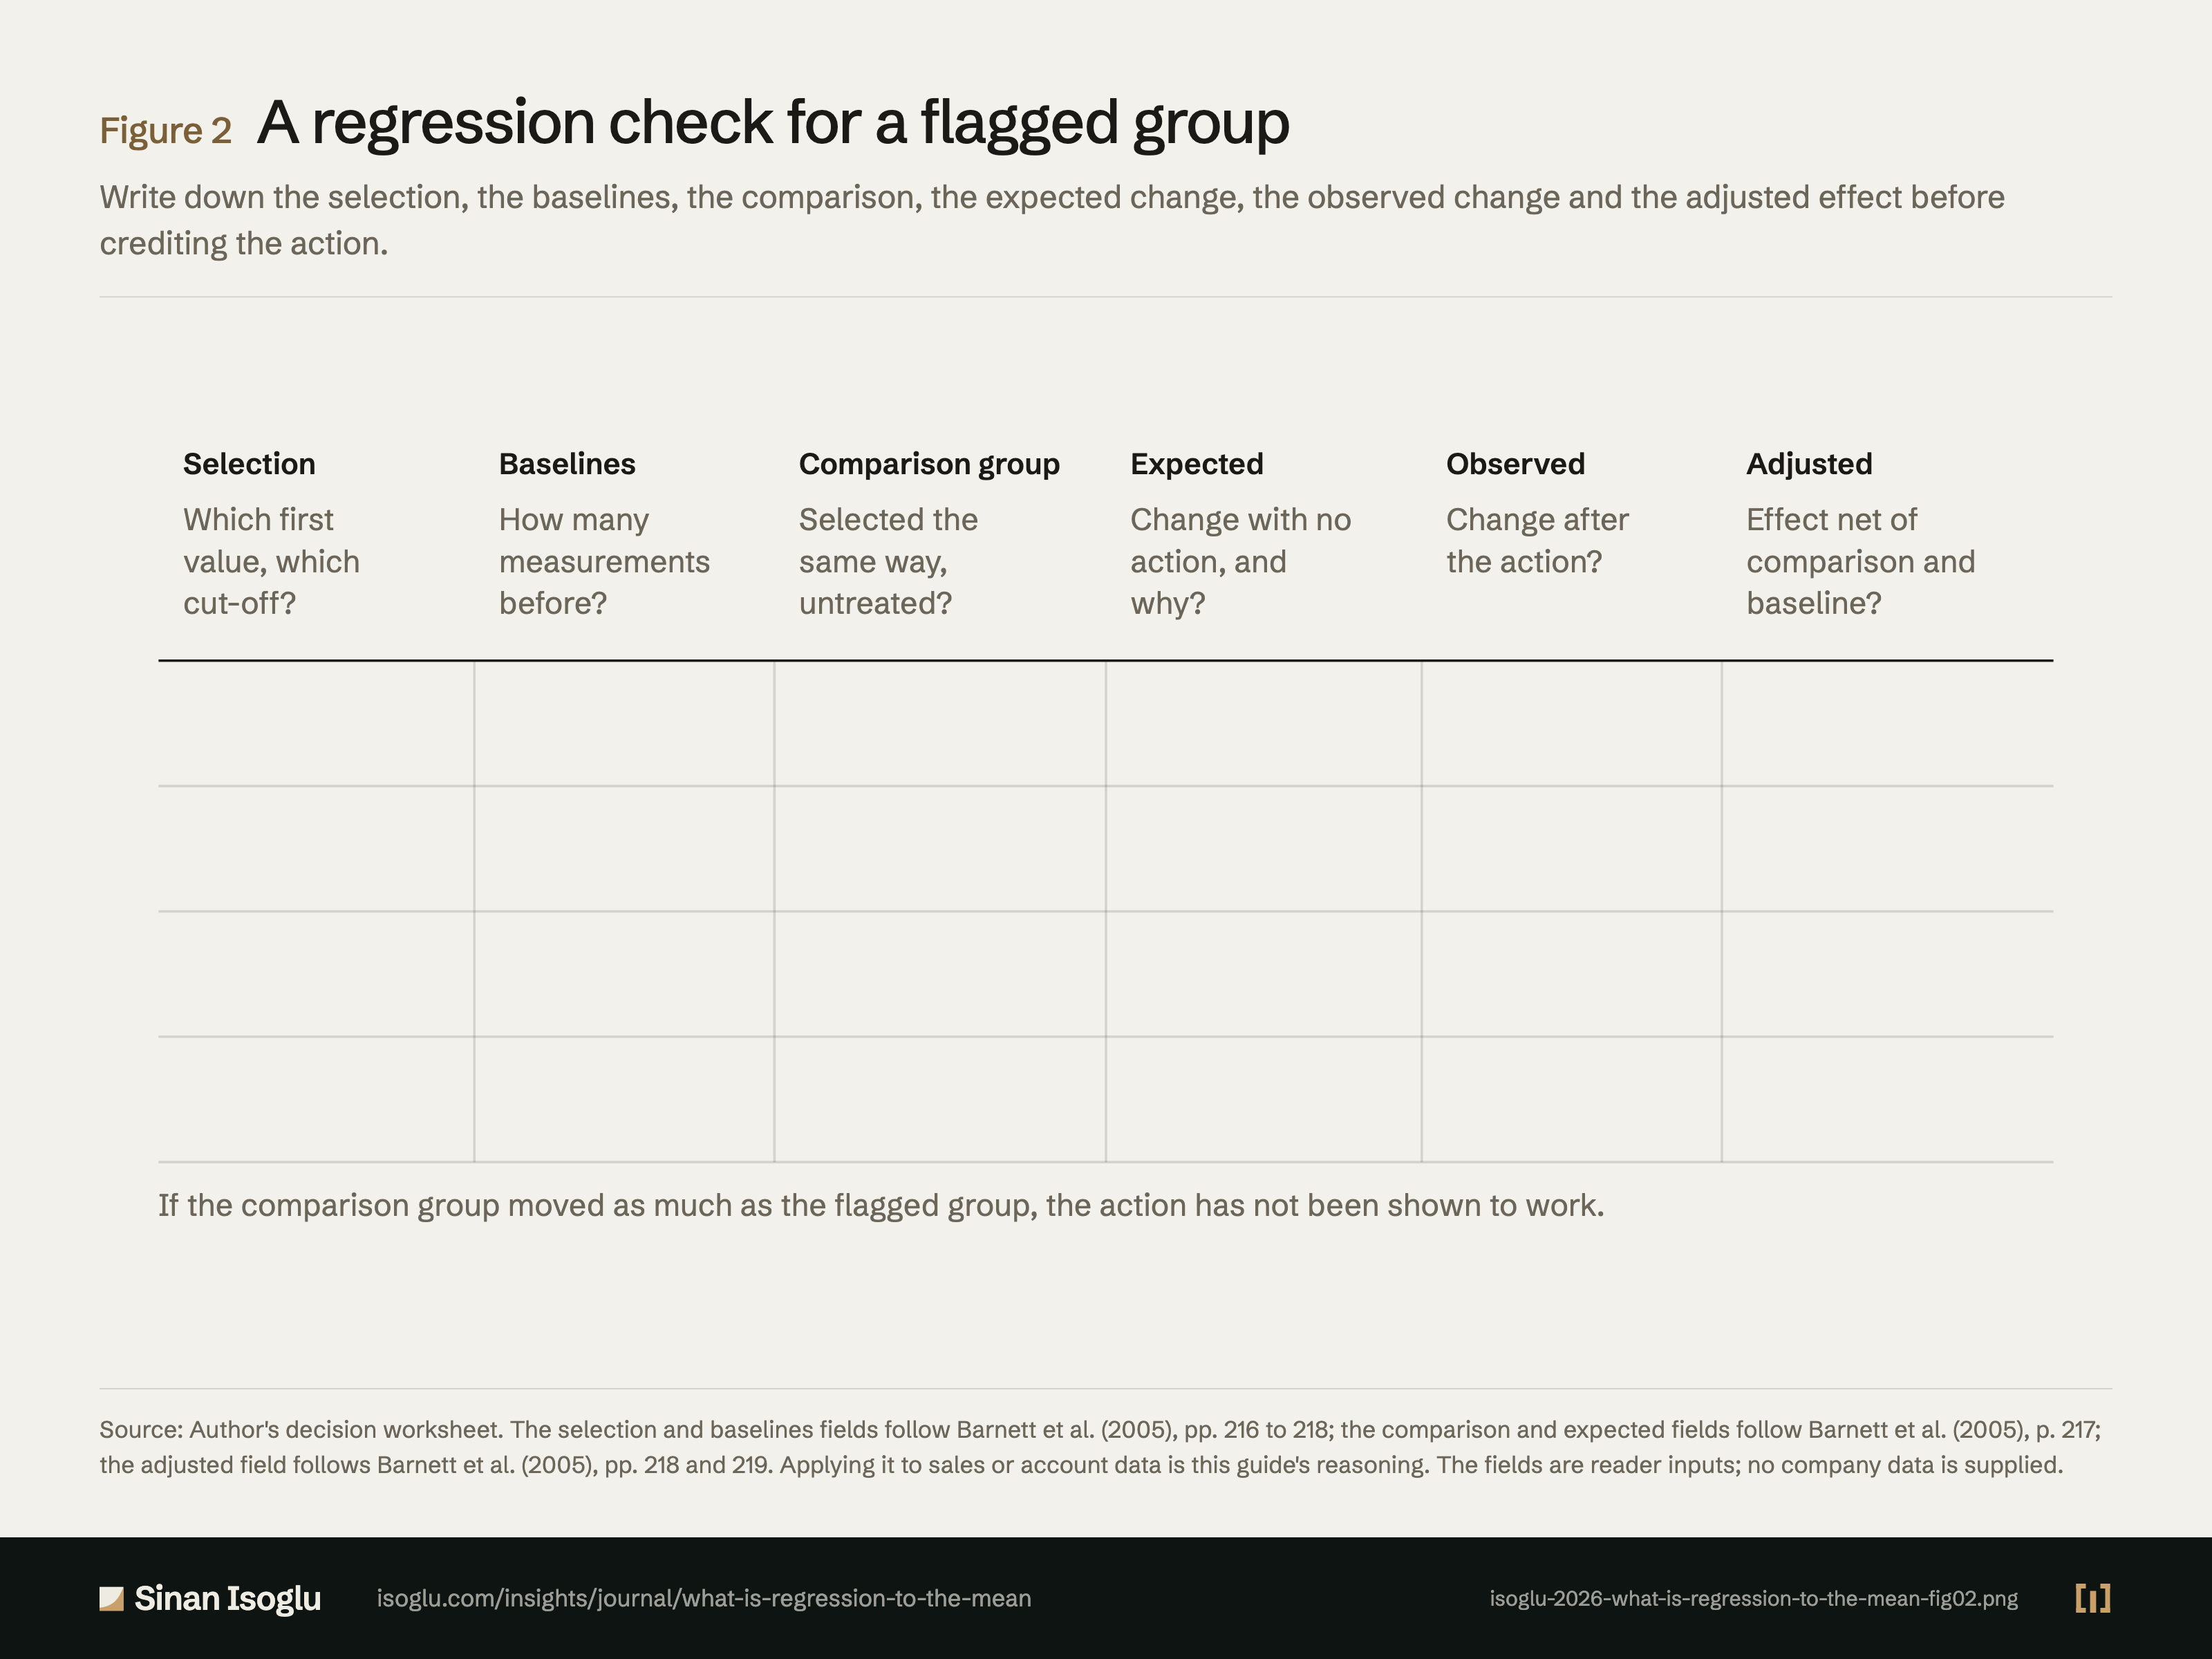
Figure 2Figure
A regression check for a flagged group
What is regression to the mean?
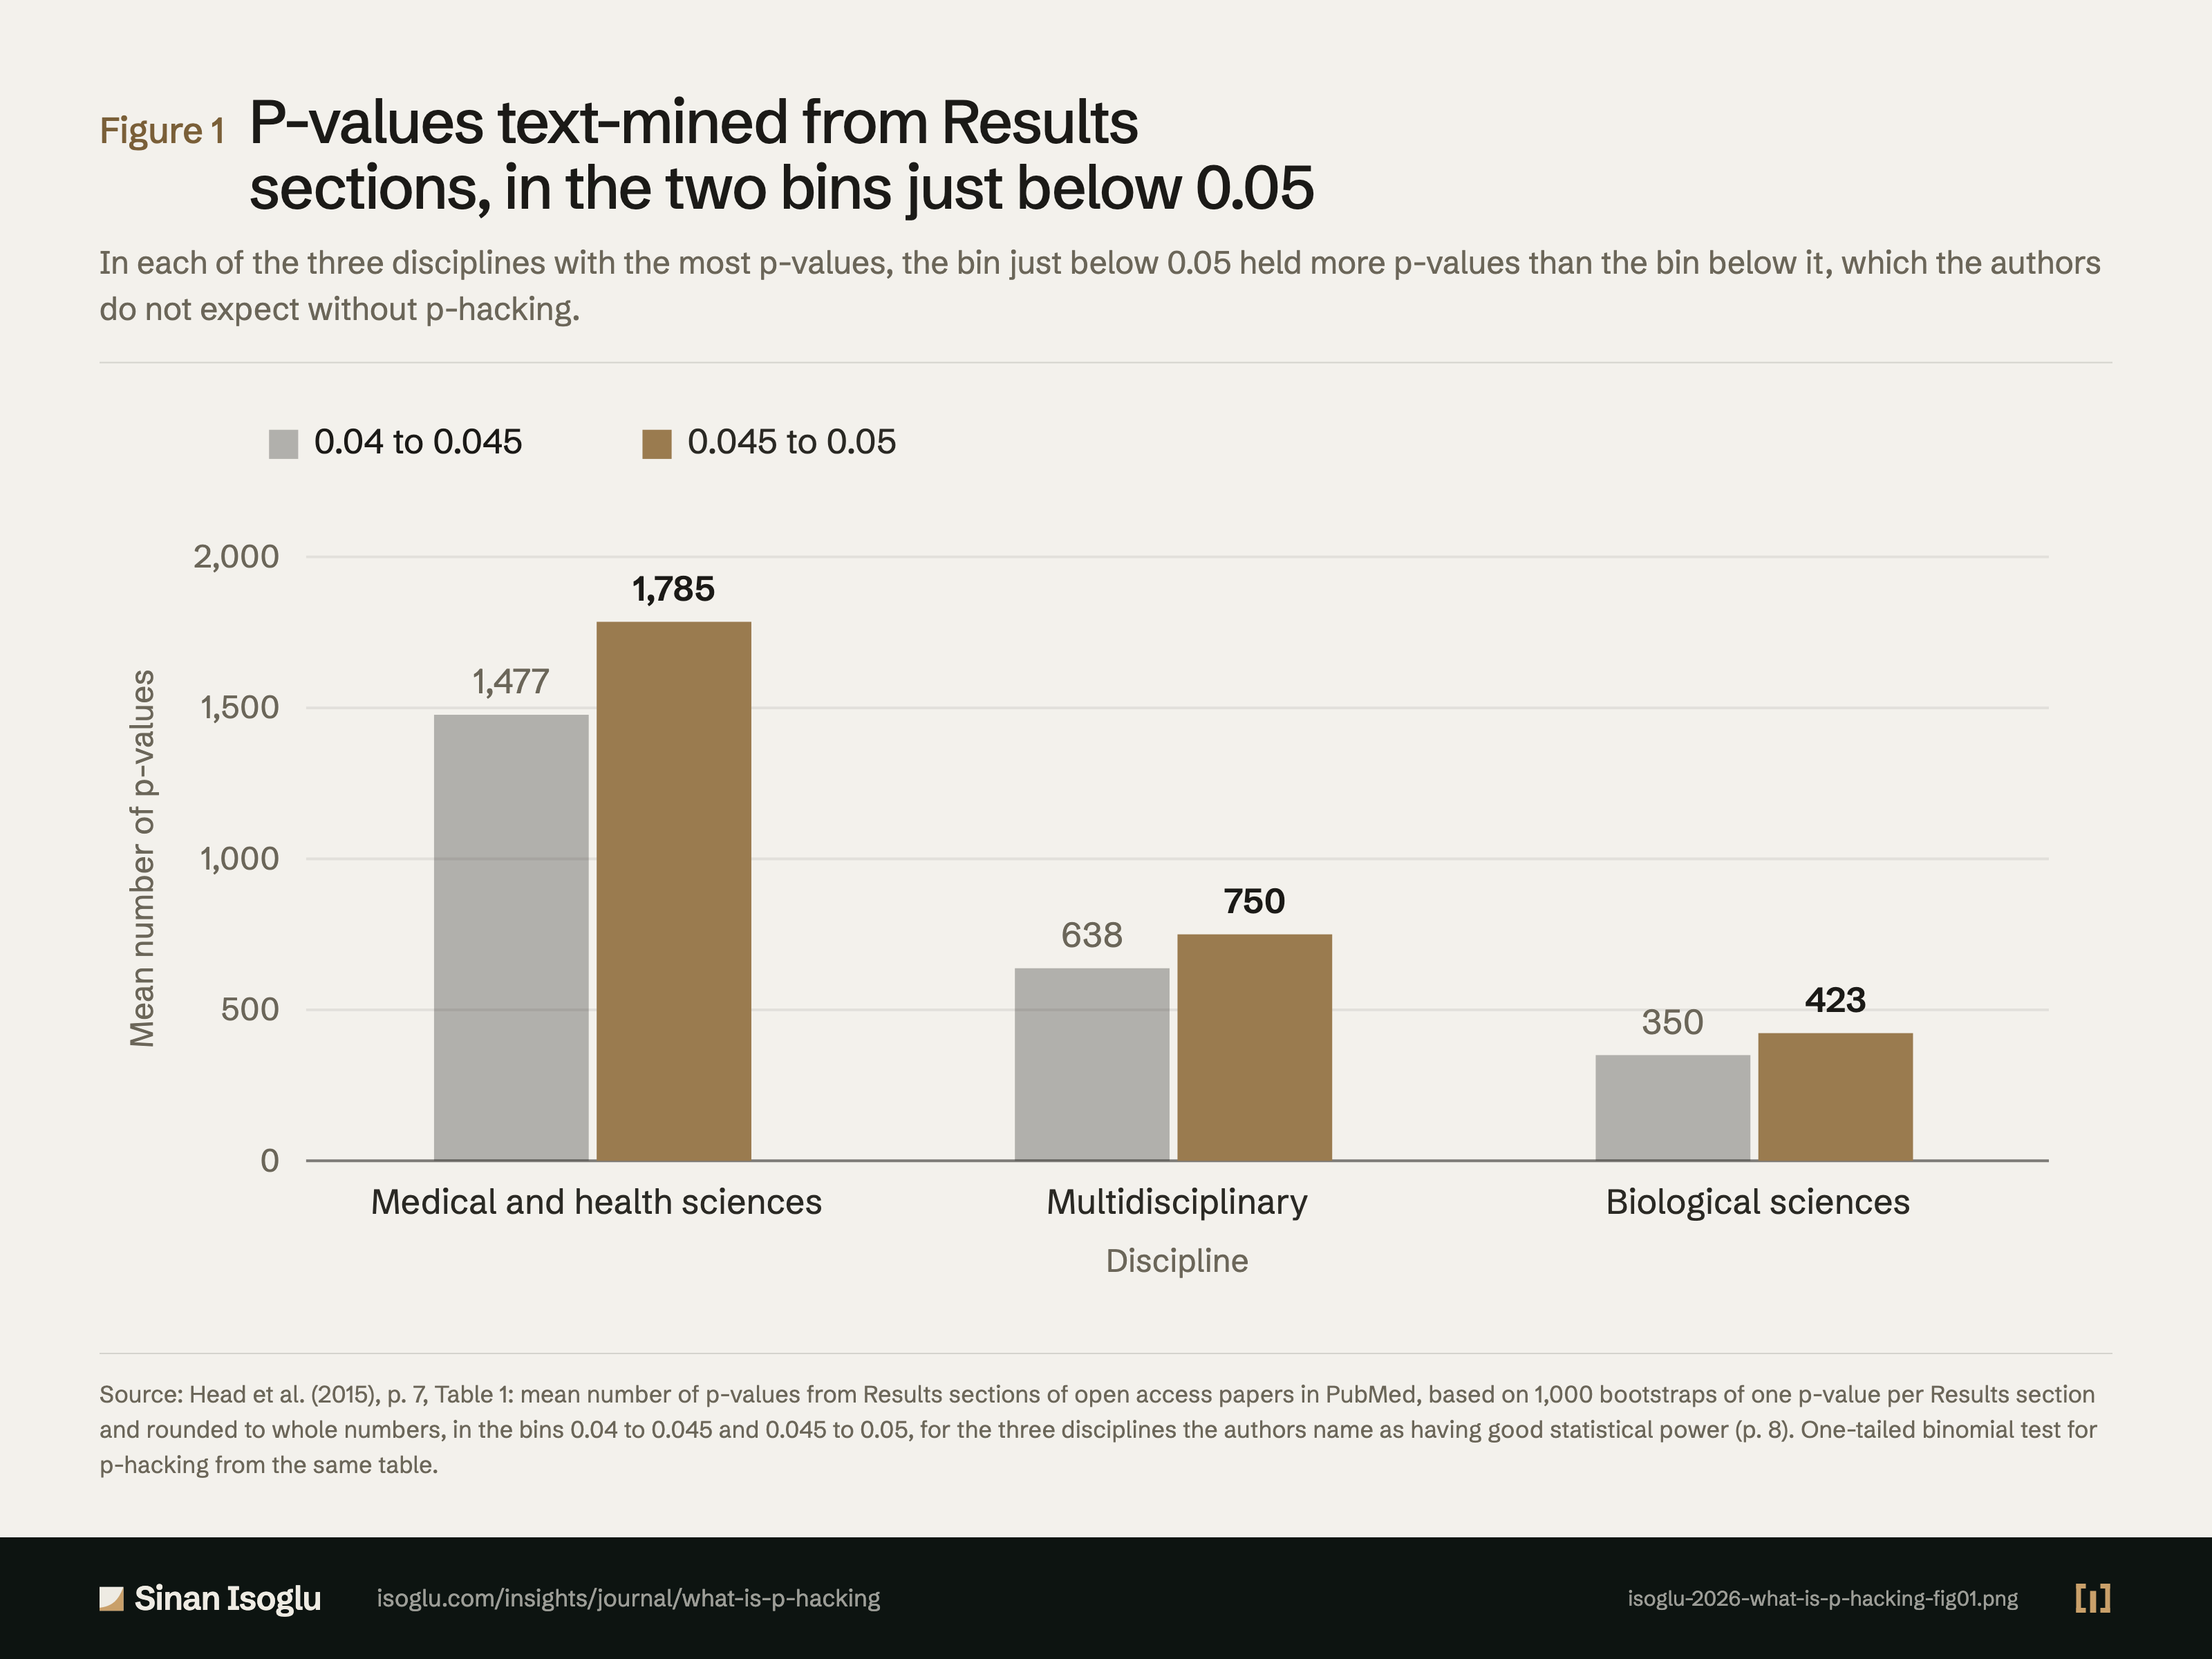
Figure 1Figure
P-values text-mined from Results sections, in the two bins just below 0.05
What is p-hacking?
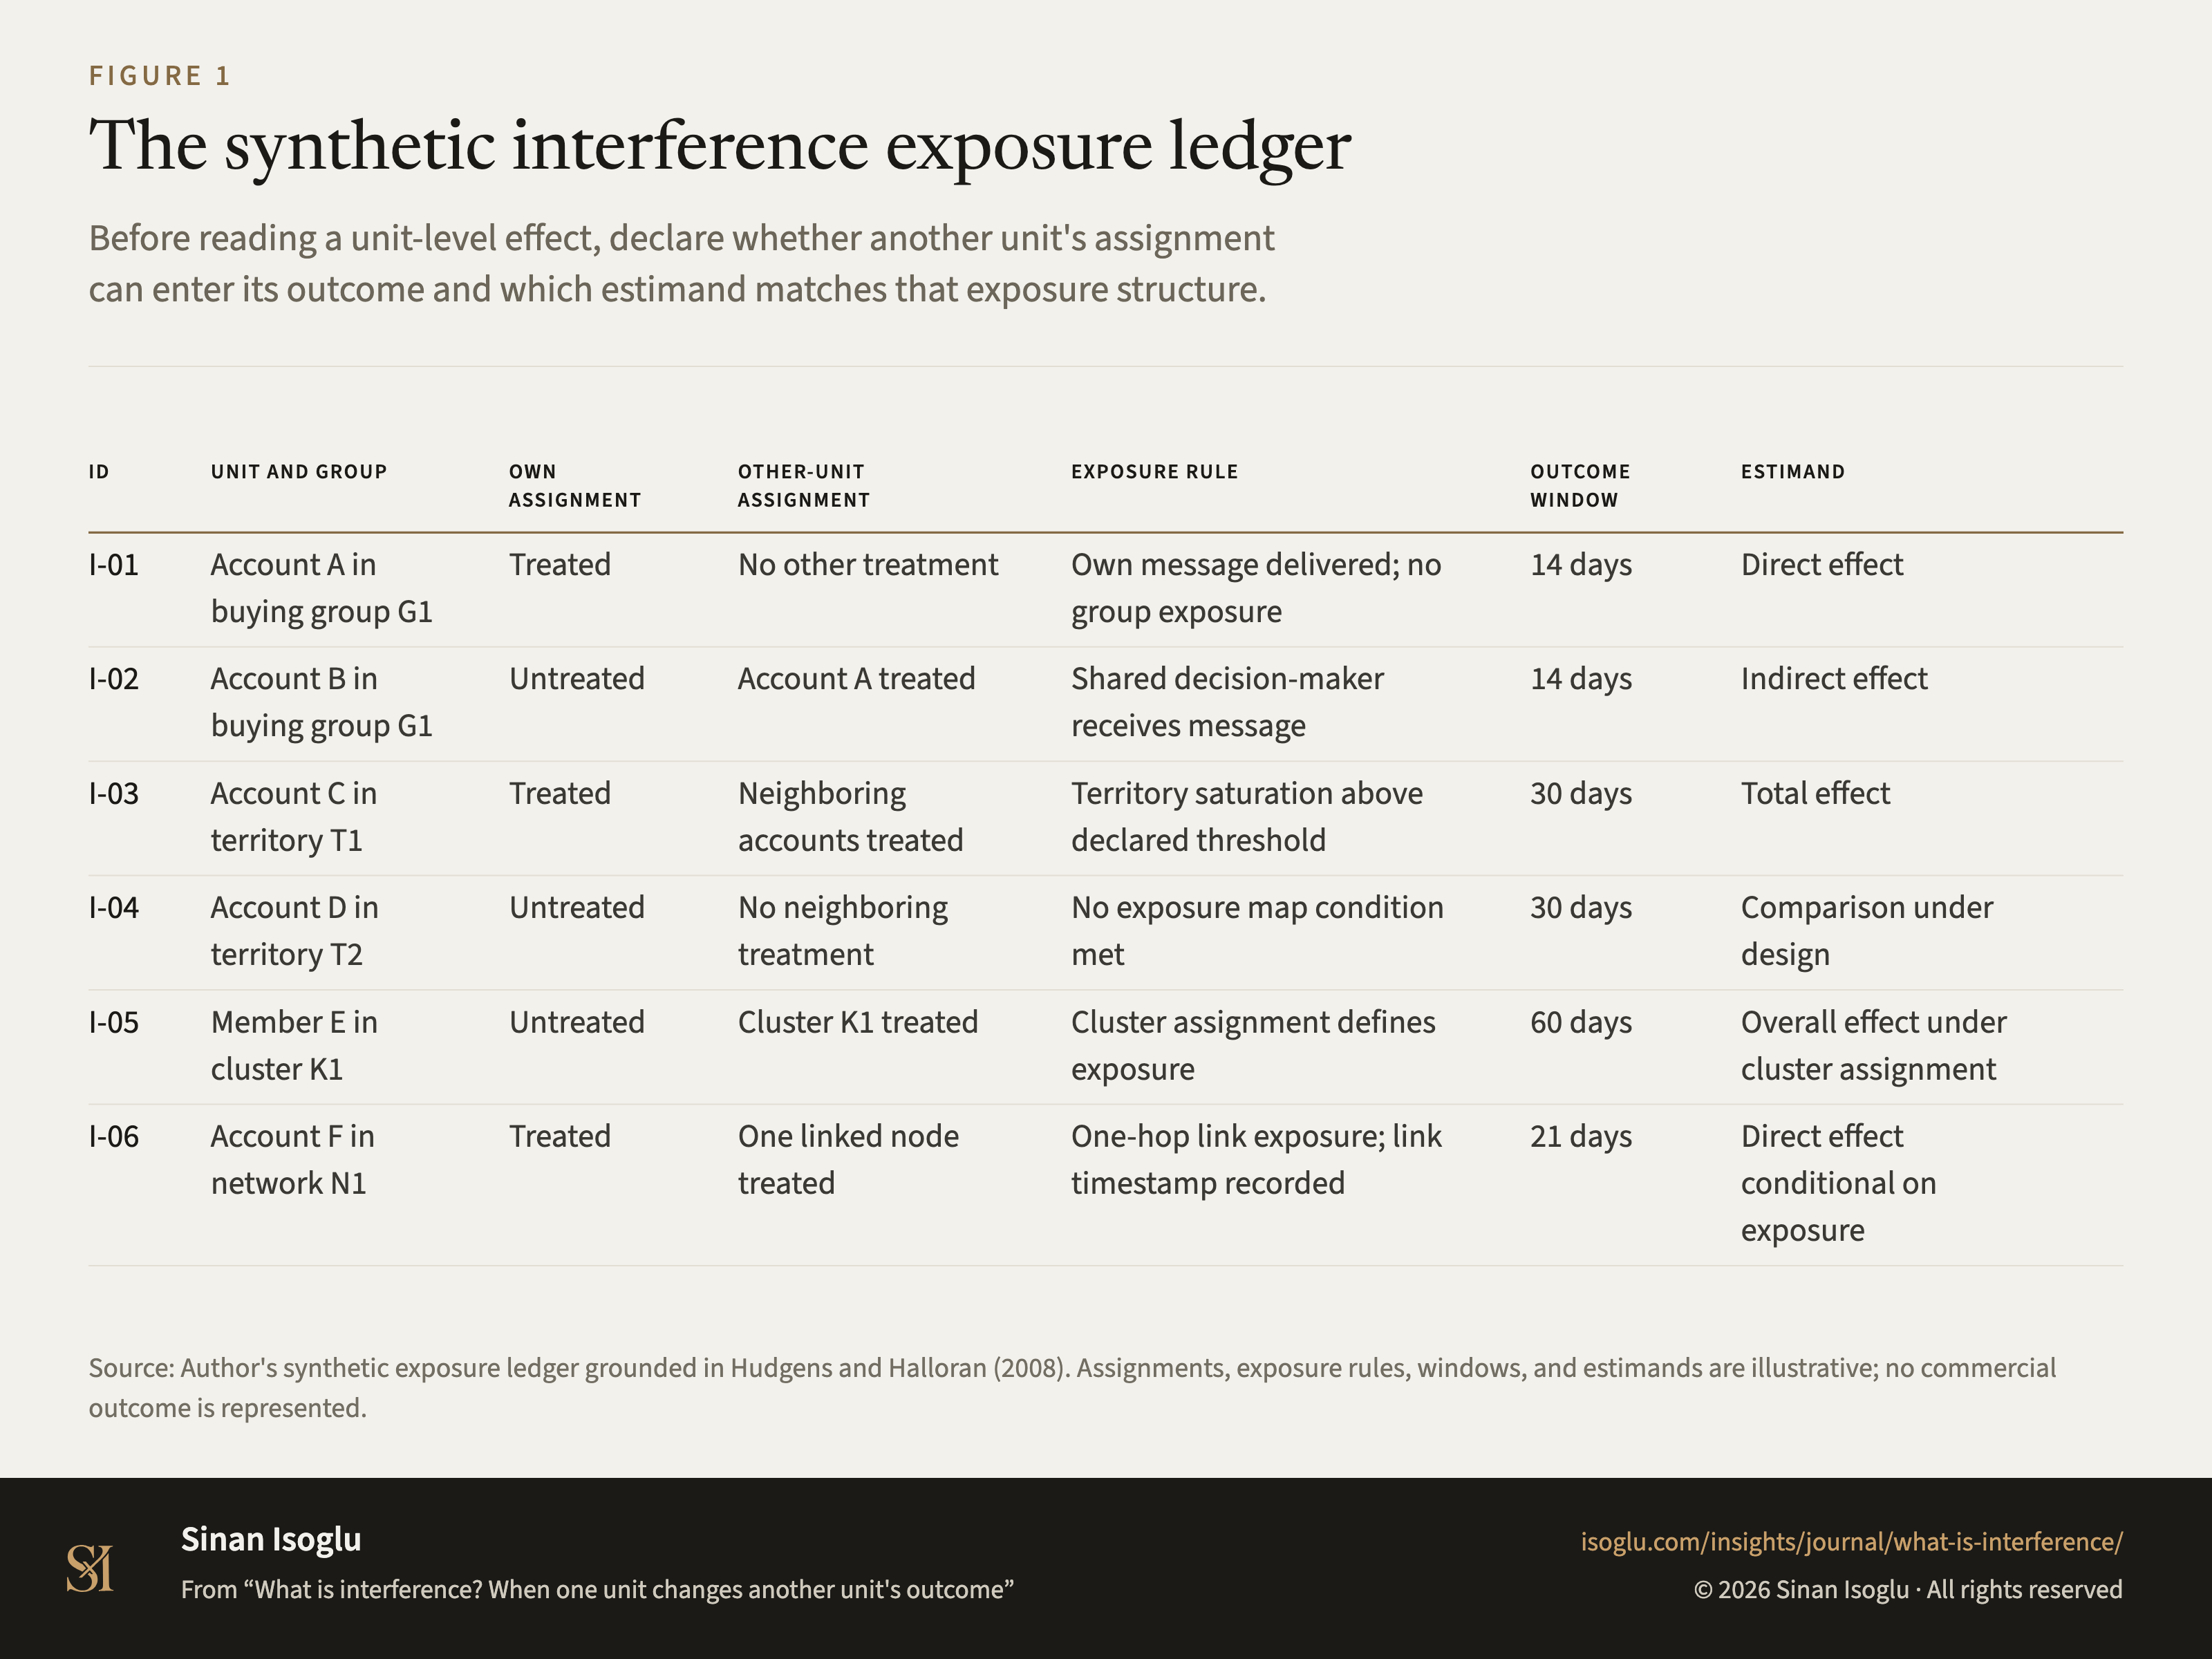
Figure 1Figure
The synthetic interference exposure ledger
What is interference? When one unit changes another unit's outcome
Contact
Bring the question you're working on.
Research, a guest lecture, or a commercial question.