Figure 1From “What is publication bias?”
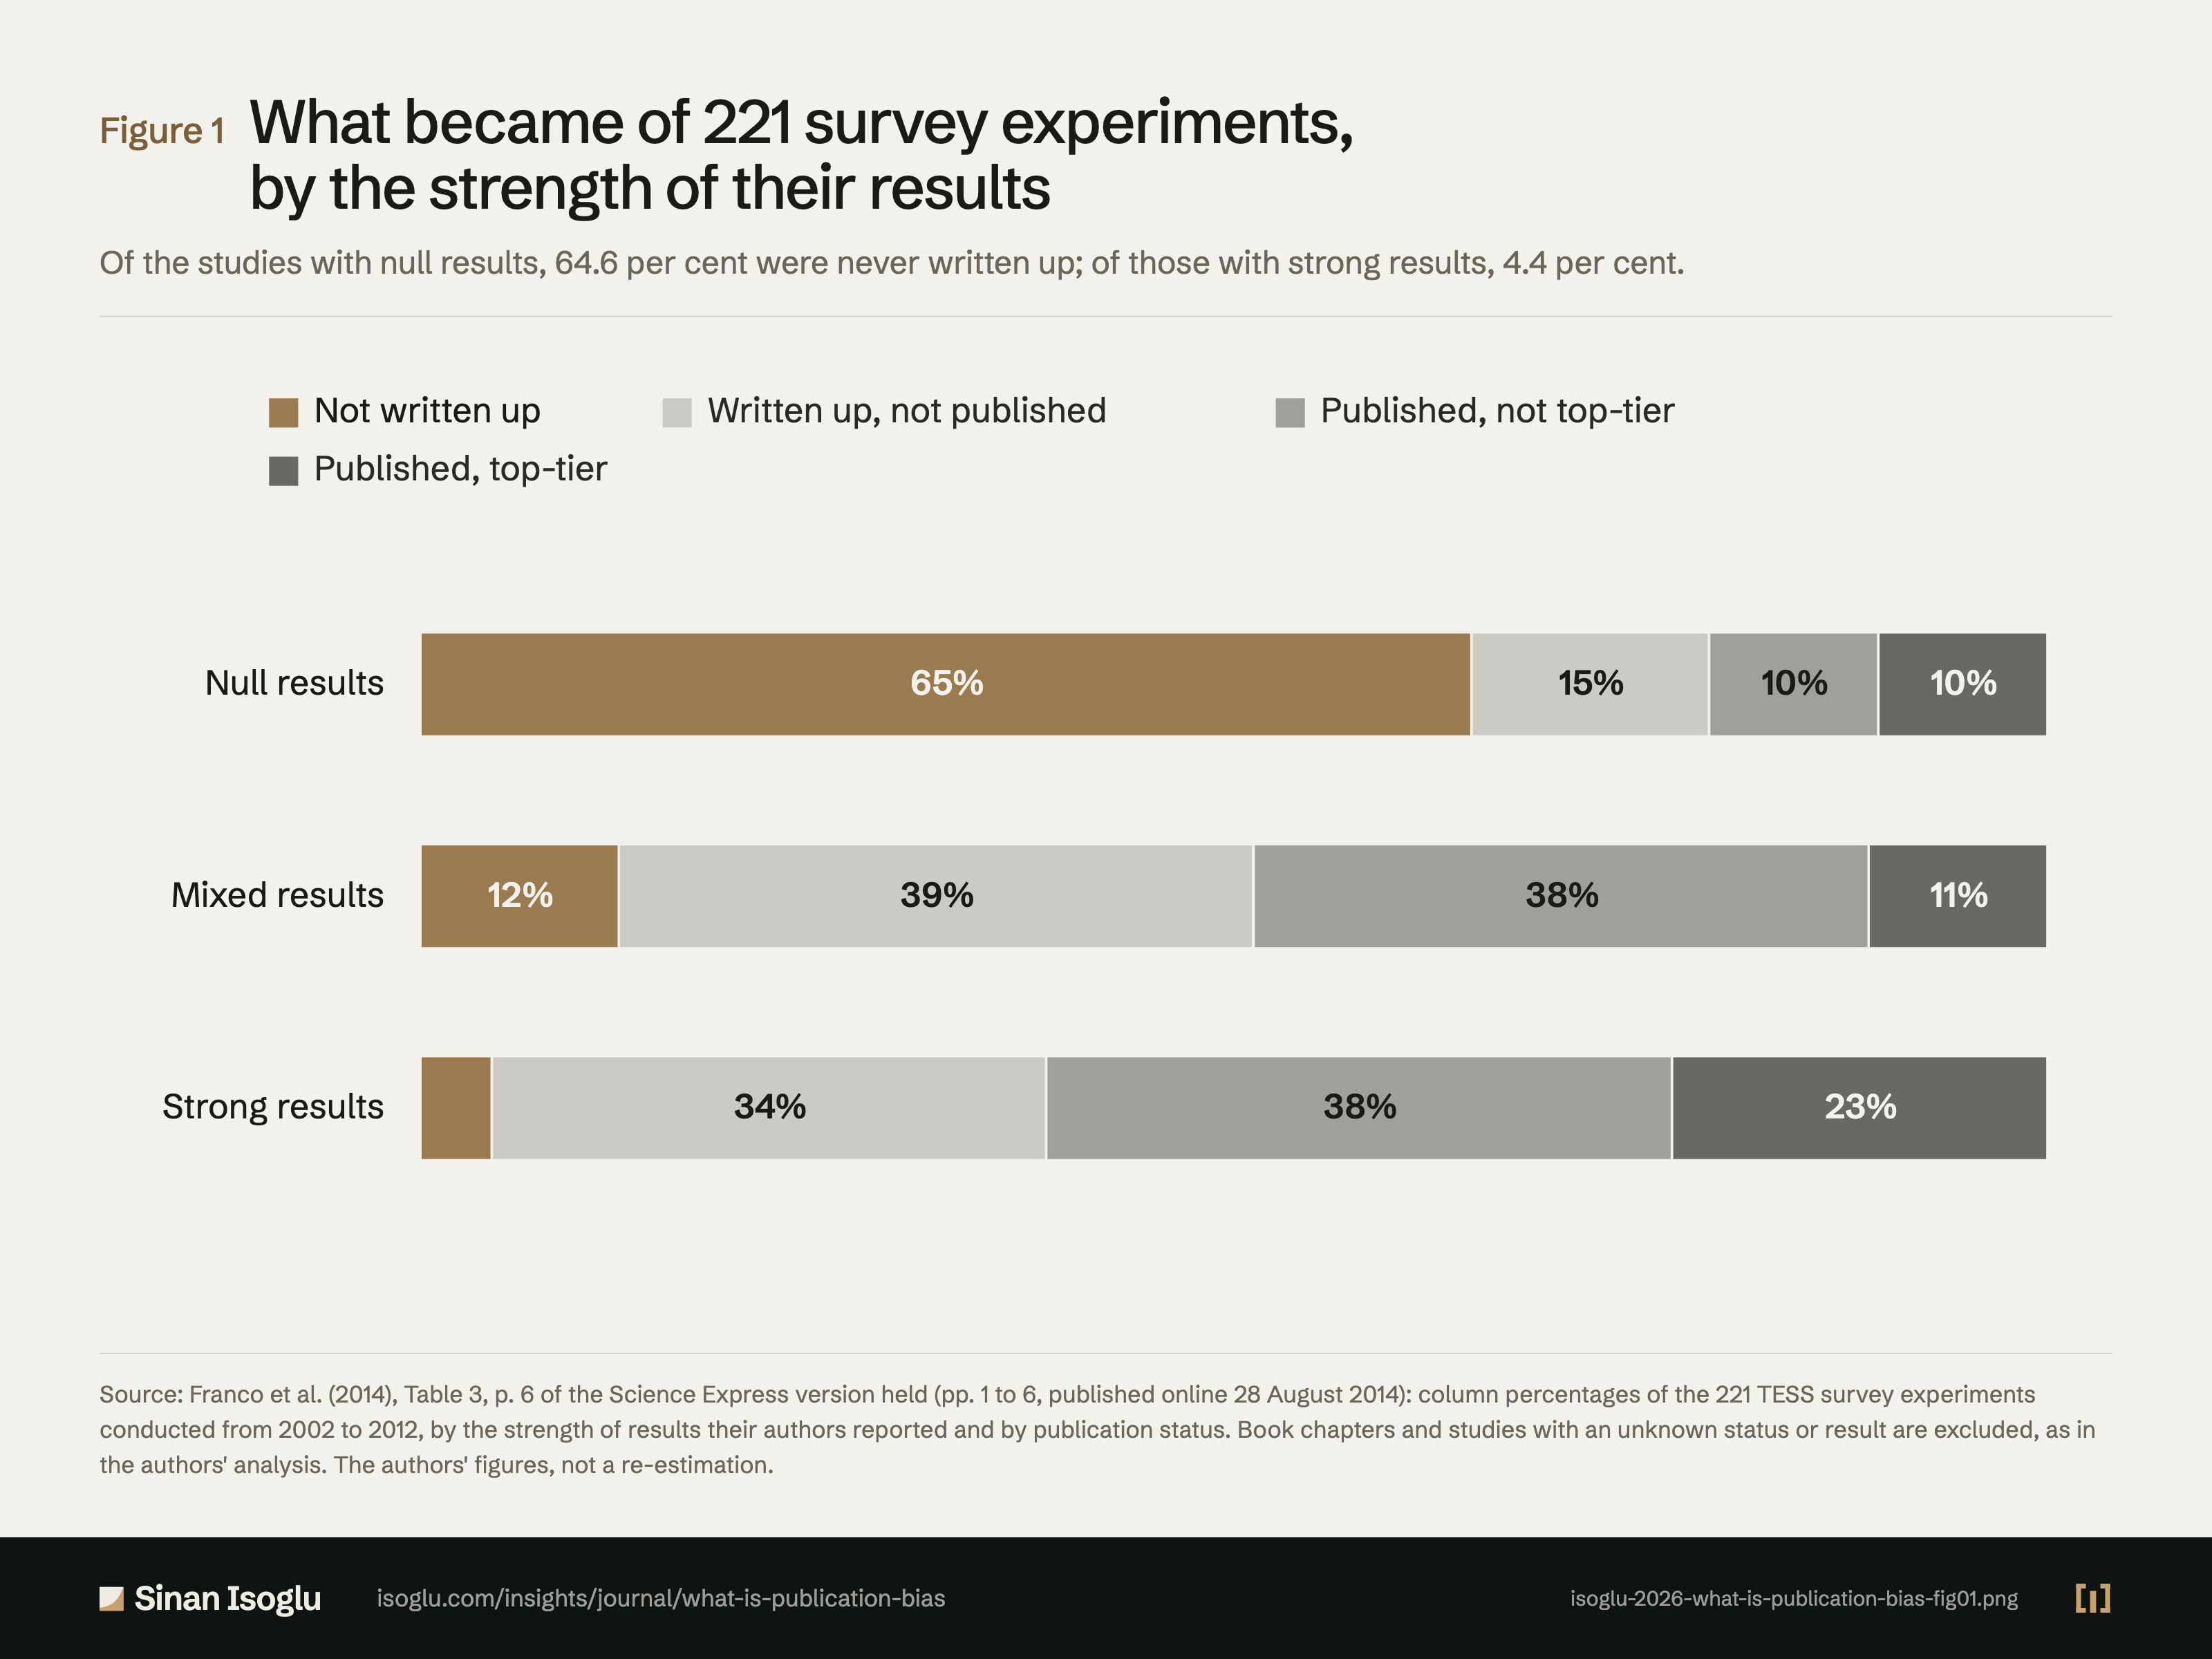
What became of 221 survey experiments, by the strength of their results
Of the studies with null results, 64.6 per cent were never written up; of those with strong results, 4.4 per cent.
Figure 1What became of 221 survey experiments, by the strength of their results
Source: Franco et al. (2014), Table 3, p. 6 of the Science Express version held (pp. 1 to 6, published online 28 August 2014): column percentages of the 221 TESS survey experiments conducted from 2002 to 2012, by the strength of results their authors reported and by publication status. Book chapters and studies with an unknown status or result are excluded, as in the authors' analysis. The authors' figures, not a re-estimation.
Source and evidence
Each line names a claim related to this exhibit, its source, and how it was checked.
- A FMS14-C3 Main result: strong results 40 percentage points more likely to be published than null results and 60 percentage points more likely to be written up; Table 3 (p. 6), column percentages for null, mixed and strong results: not written 64.6, 12.2, 4.4; written but not published 14.6, 39.0, 34.1; published in non-top-tier journals 10.4, 37.8, 38.5; published in top-tier journals 10.4, 11.0, 23.1; Table 2 (p. 6) analysed counts not written, written and published: null 31, 7, 10; mixed 10, 32, 40; strong 4, 31, 56, which sum to 48, 82 and 91 studies (this guide's sums); Pearson chi-squared test of independence χ2(6) = 80.3, P < 0.001; about half published, 20% of null results in print against roughly 60% of strong and 50% of mixed results; more than 20% of the studies had null findings but less than 10% of published articles report such results; 65% of null results never written up; among written-up studies no significant relationship between strength of results and publication status (pp. 1, 2, 6 of the Science Express version): "results are 40 percentage points more likely to be published than null results, and"; "60 percentage points more likely to be written up"; "Cross-tabulation between statistical results of TESS studies and their publication status (column percentages"; "Not written 64.6% 12.2% 4.4%"; "Written but not published 14.6 39.0 34.1"; "Published (non-top-tier) 10.4 37.8 38.5"; "Published (top-tier) 10.4 11.0 23.1"; "Null results 31 7 10 1 0 49"; "Mixed results 10 32 40 3 1 86"; "Strong results 4 31 56 1 1 93"; "[χ2(6) = 80.3, P < 0.001]"; "sample were published, only 20% of those with null results appeared in"; "print. In contrast, roughly 60% of studies with strong results and 50% of"; "those with mixed results were published."; "studies in our sample had null findings, less than 10% of published"; "null results are published, but that so many of them are never even writ"; "ten up (65%)"; "once we condition on studies that"; "no significant relationship between strength of"; "results and publication status (see Table S2)."Franco, Malhotra & Simonovits (2014) · Franco, Malhotra & Simonovits. (2014)
Grades: A, verified against the printed page of the primary source · B, primary source, text layer only · C, authoritative secondary · D, reported.
From the essay
From the research bench
What is publication bias?
Publication bias is when a study's result decides whether it reaches print. In one known set of studies, most null results were never even written up.
Read the essayThis exhibit belongs to an essay: the numbers live here, the argument lives there.
Cite or embed
Related exhibits
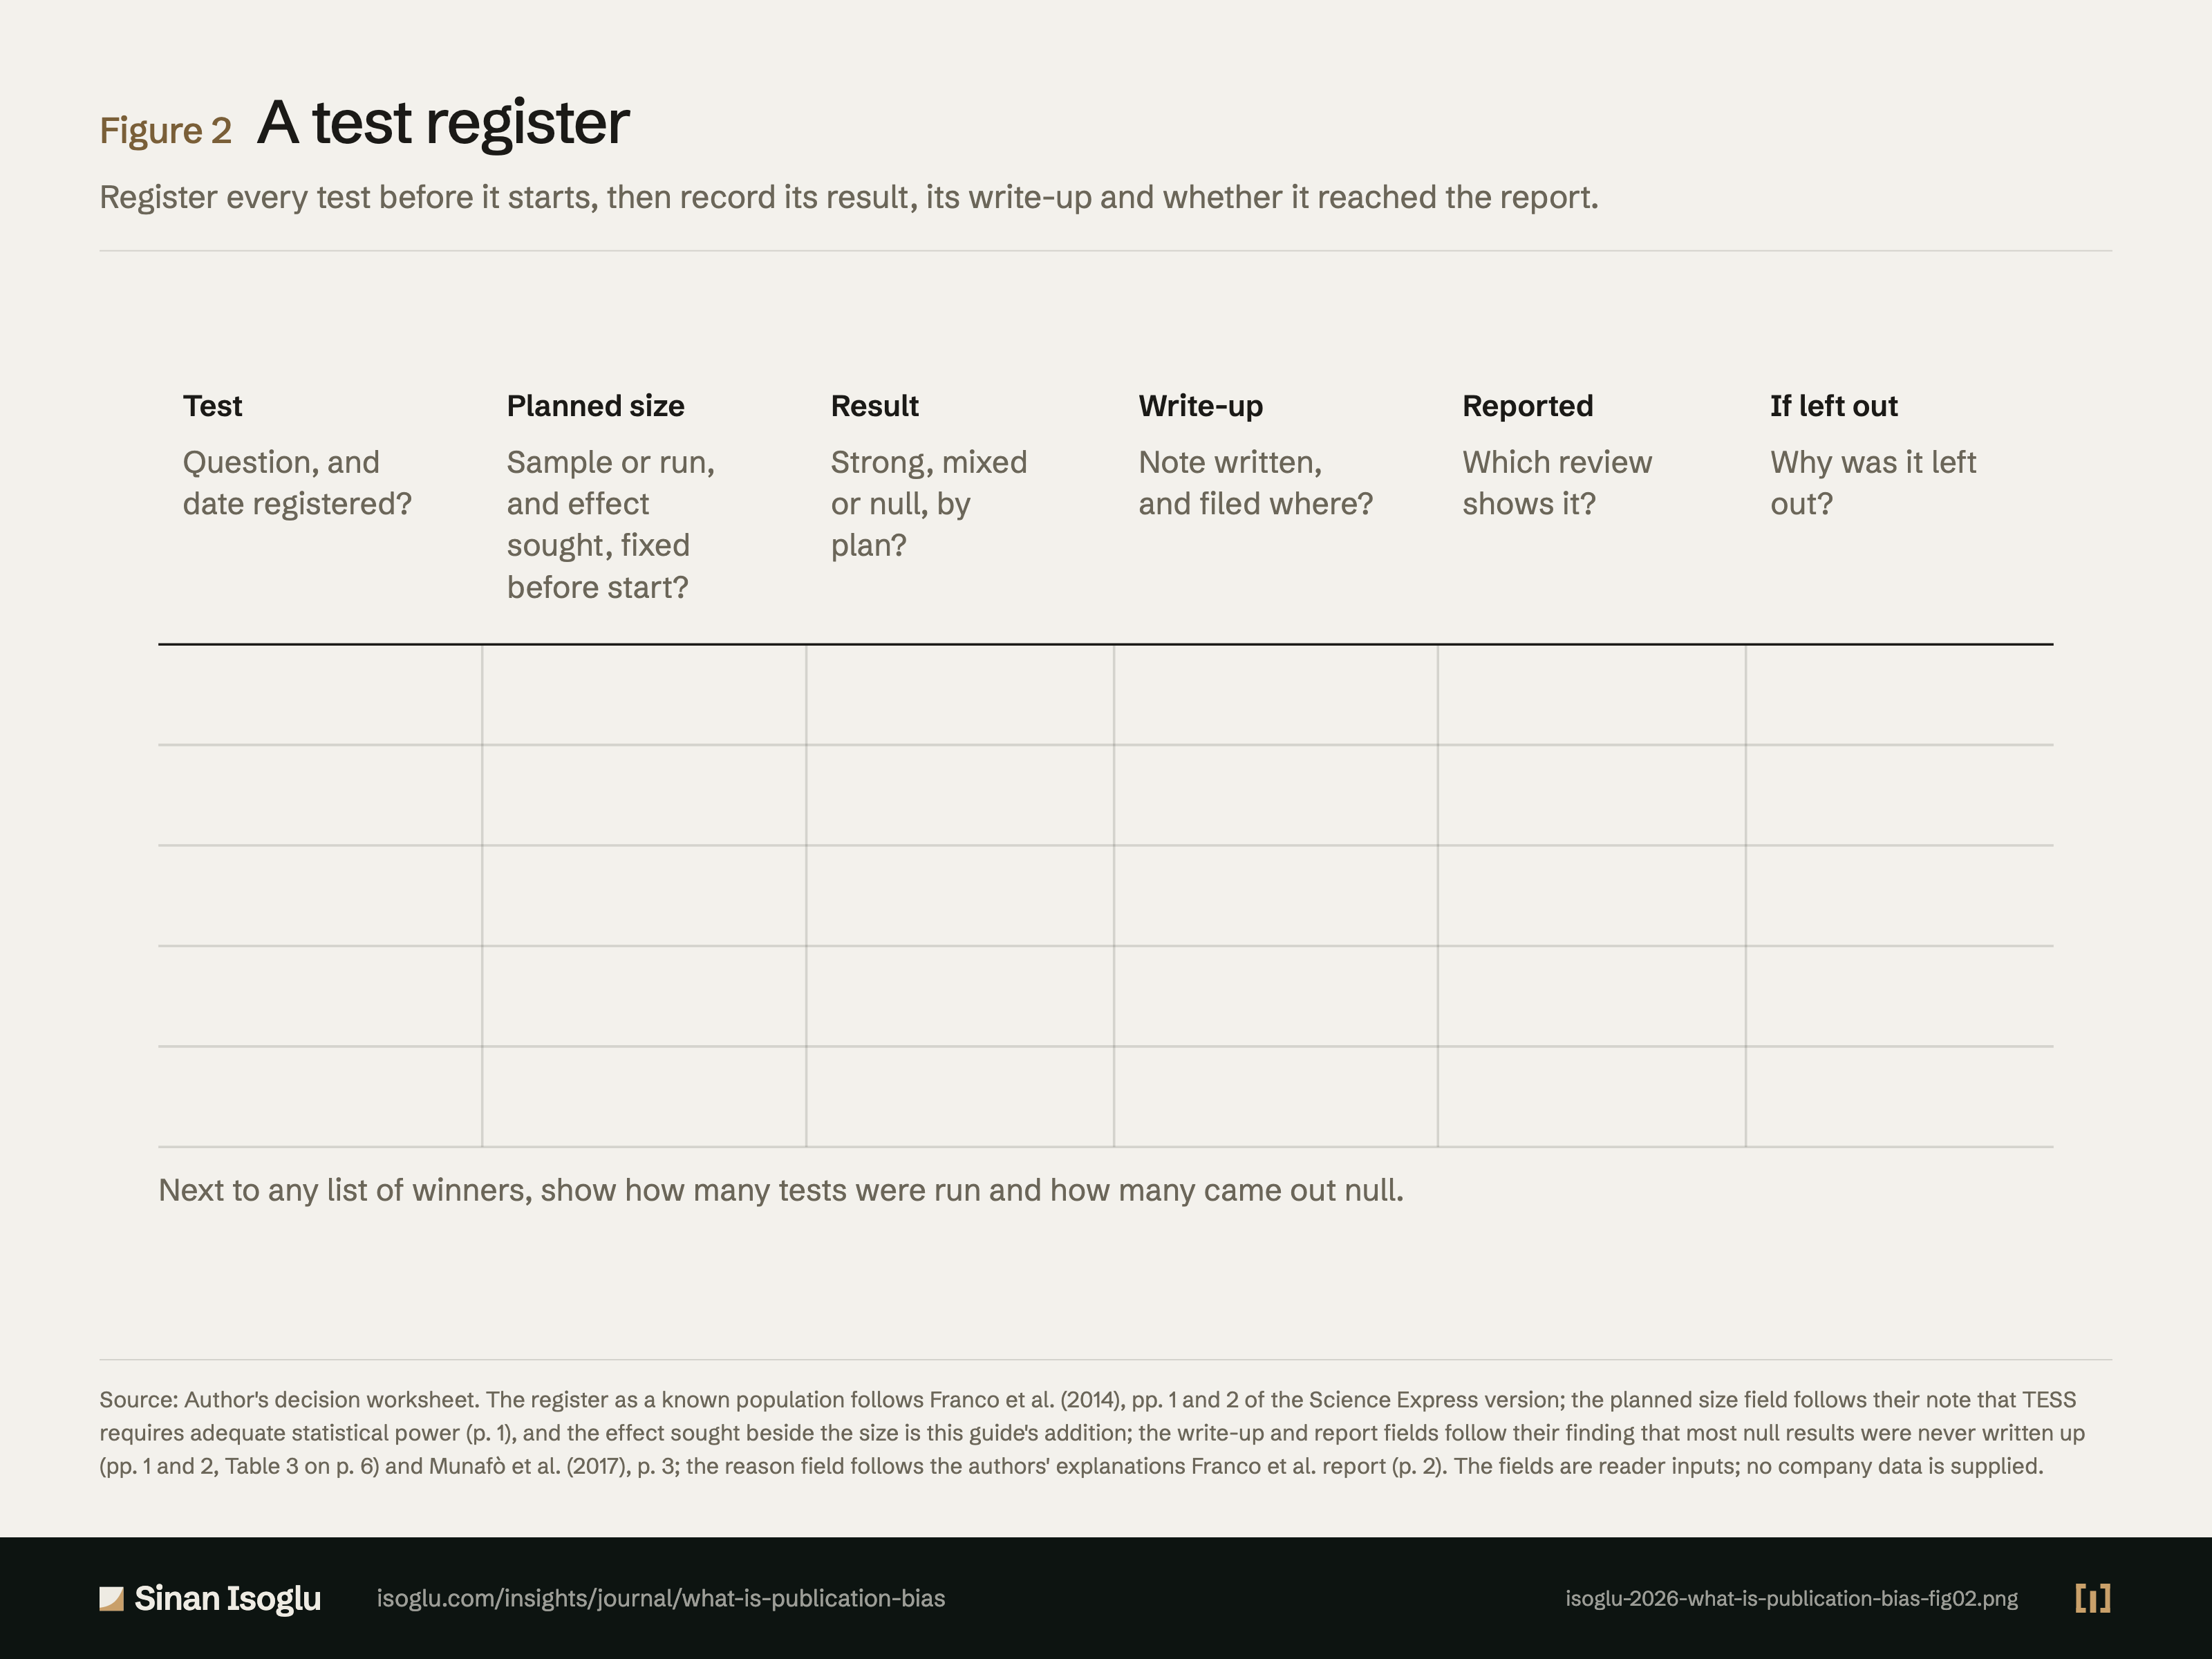
Figure 2Figure
A test register
What is publication bias?
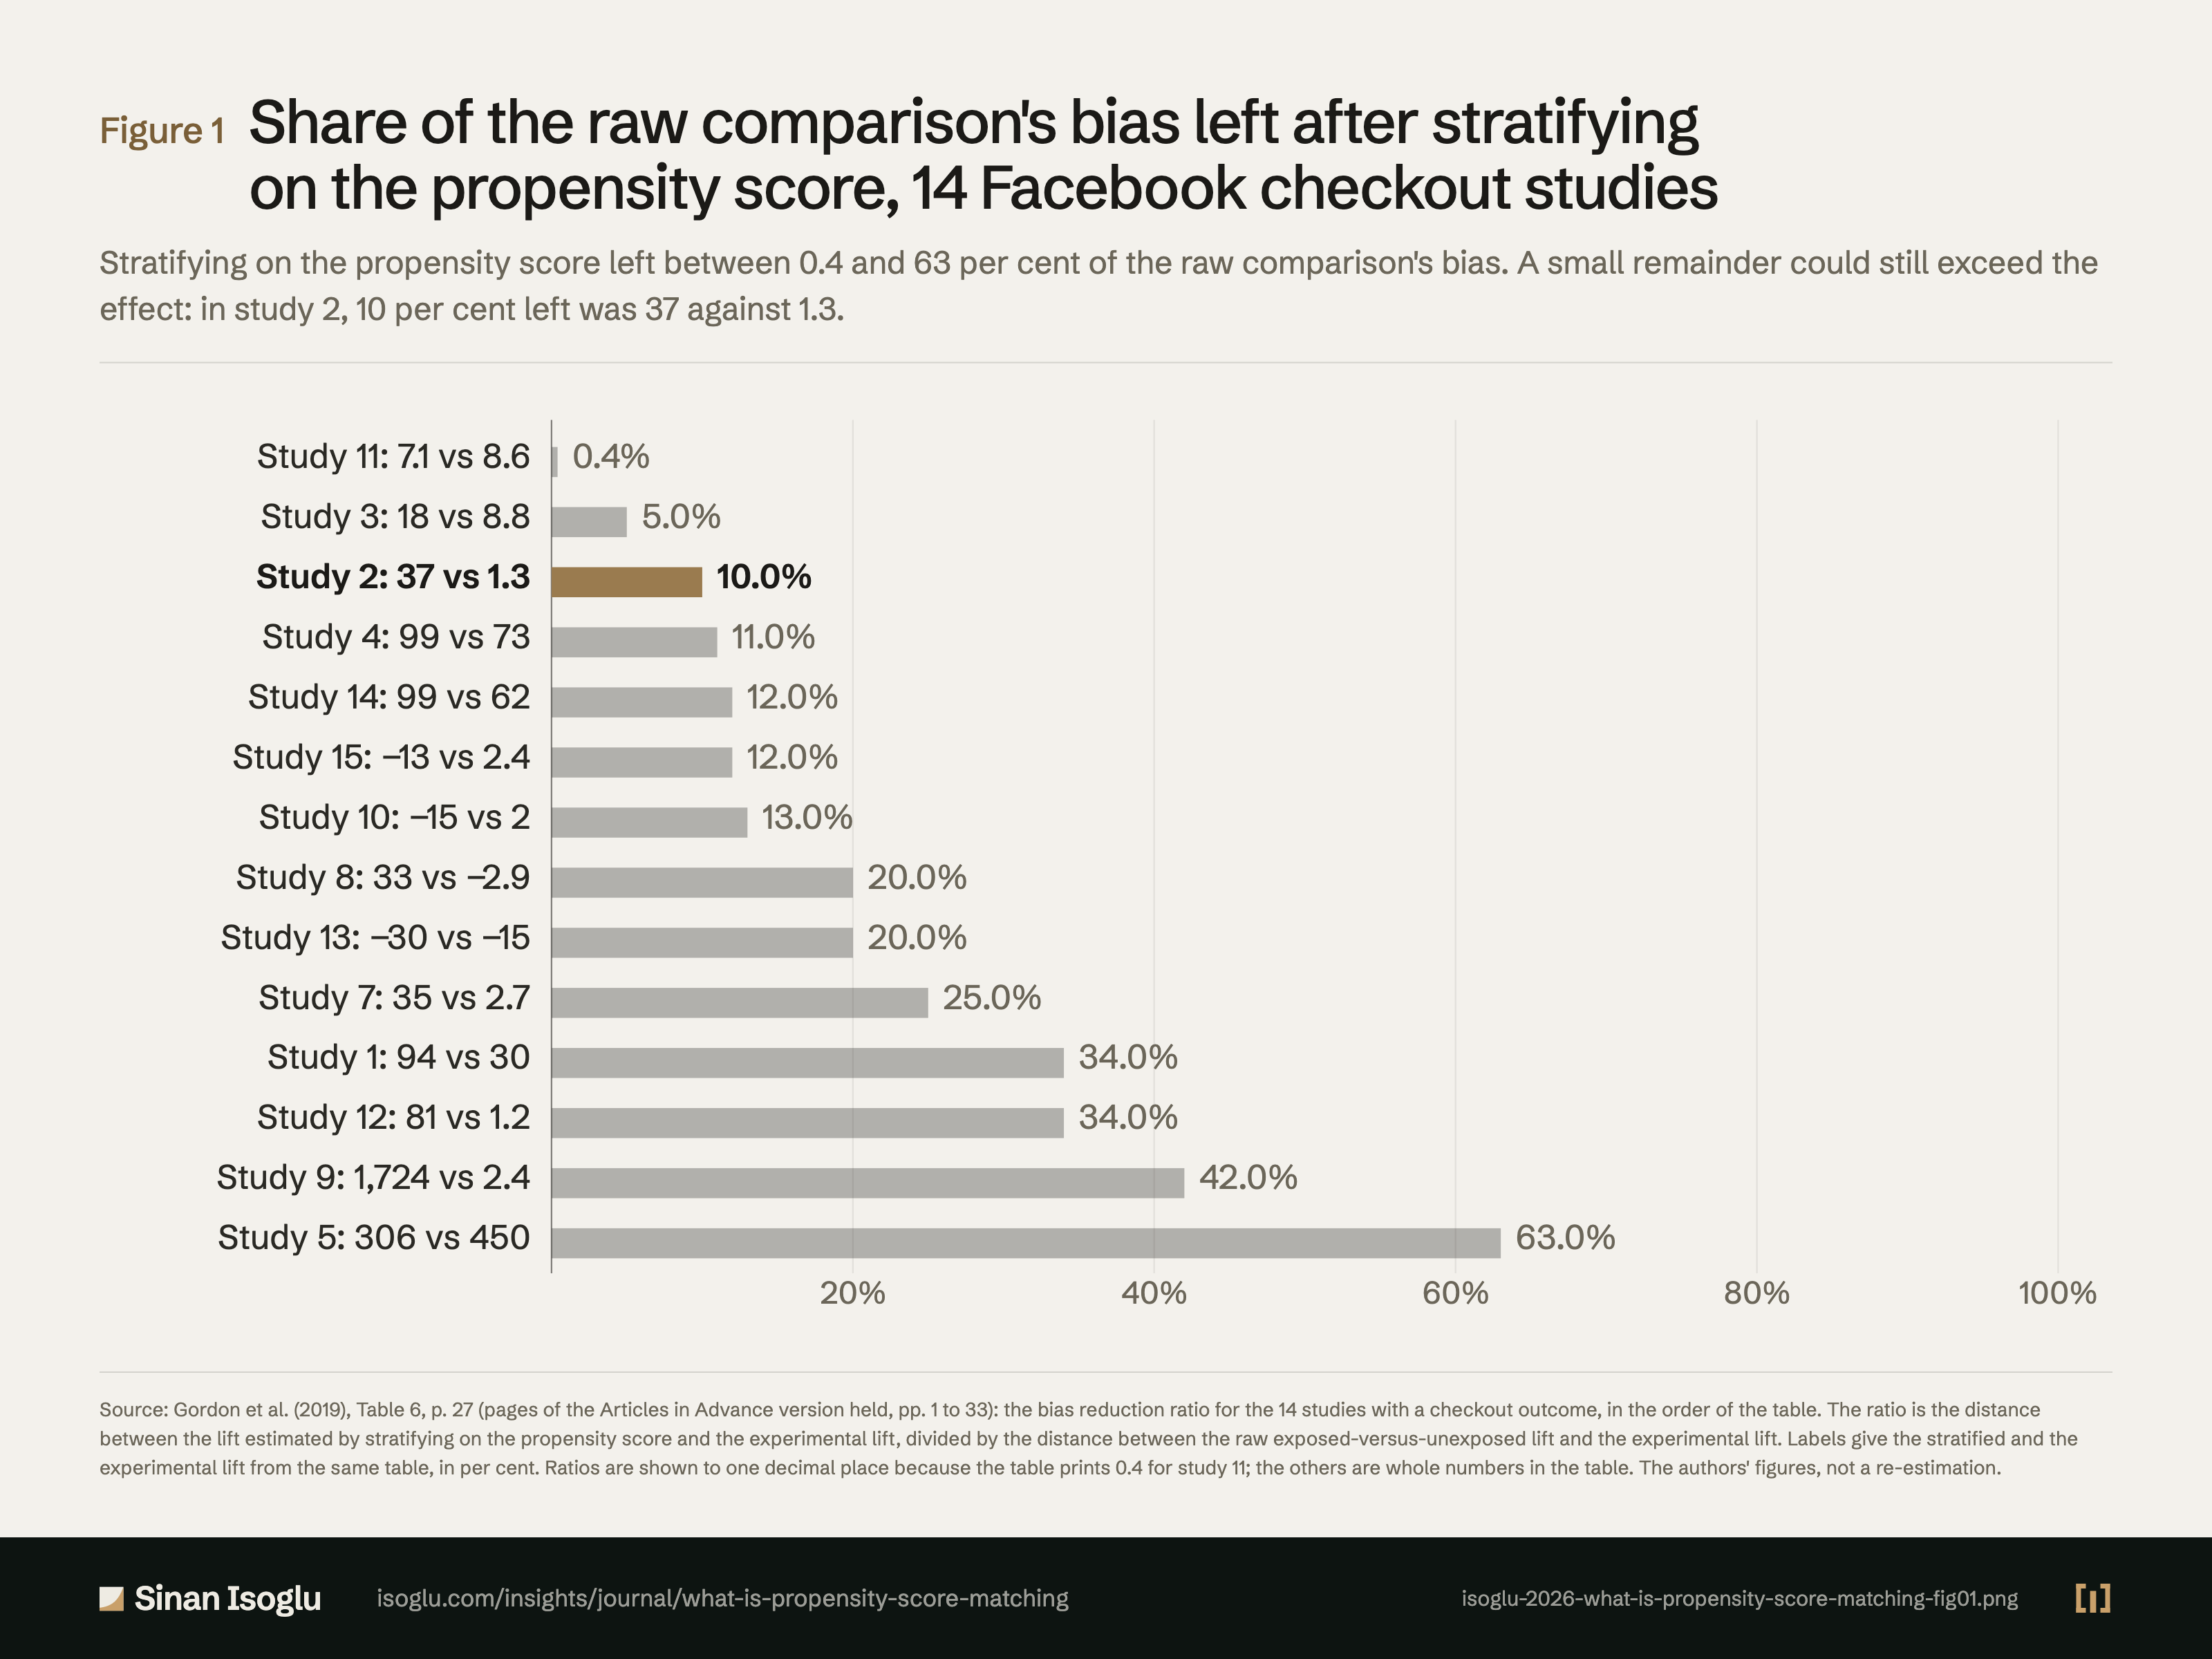
Figure 1Figure
Share of the raw comparison's bias left after stratifying on the propensity score, 14 Facebook checkout studies
What is propensity score matching?
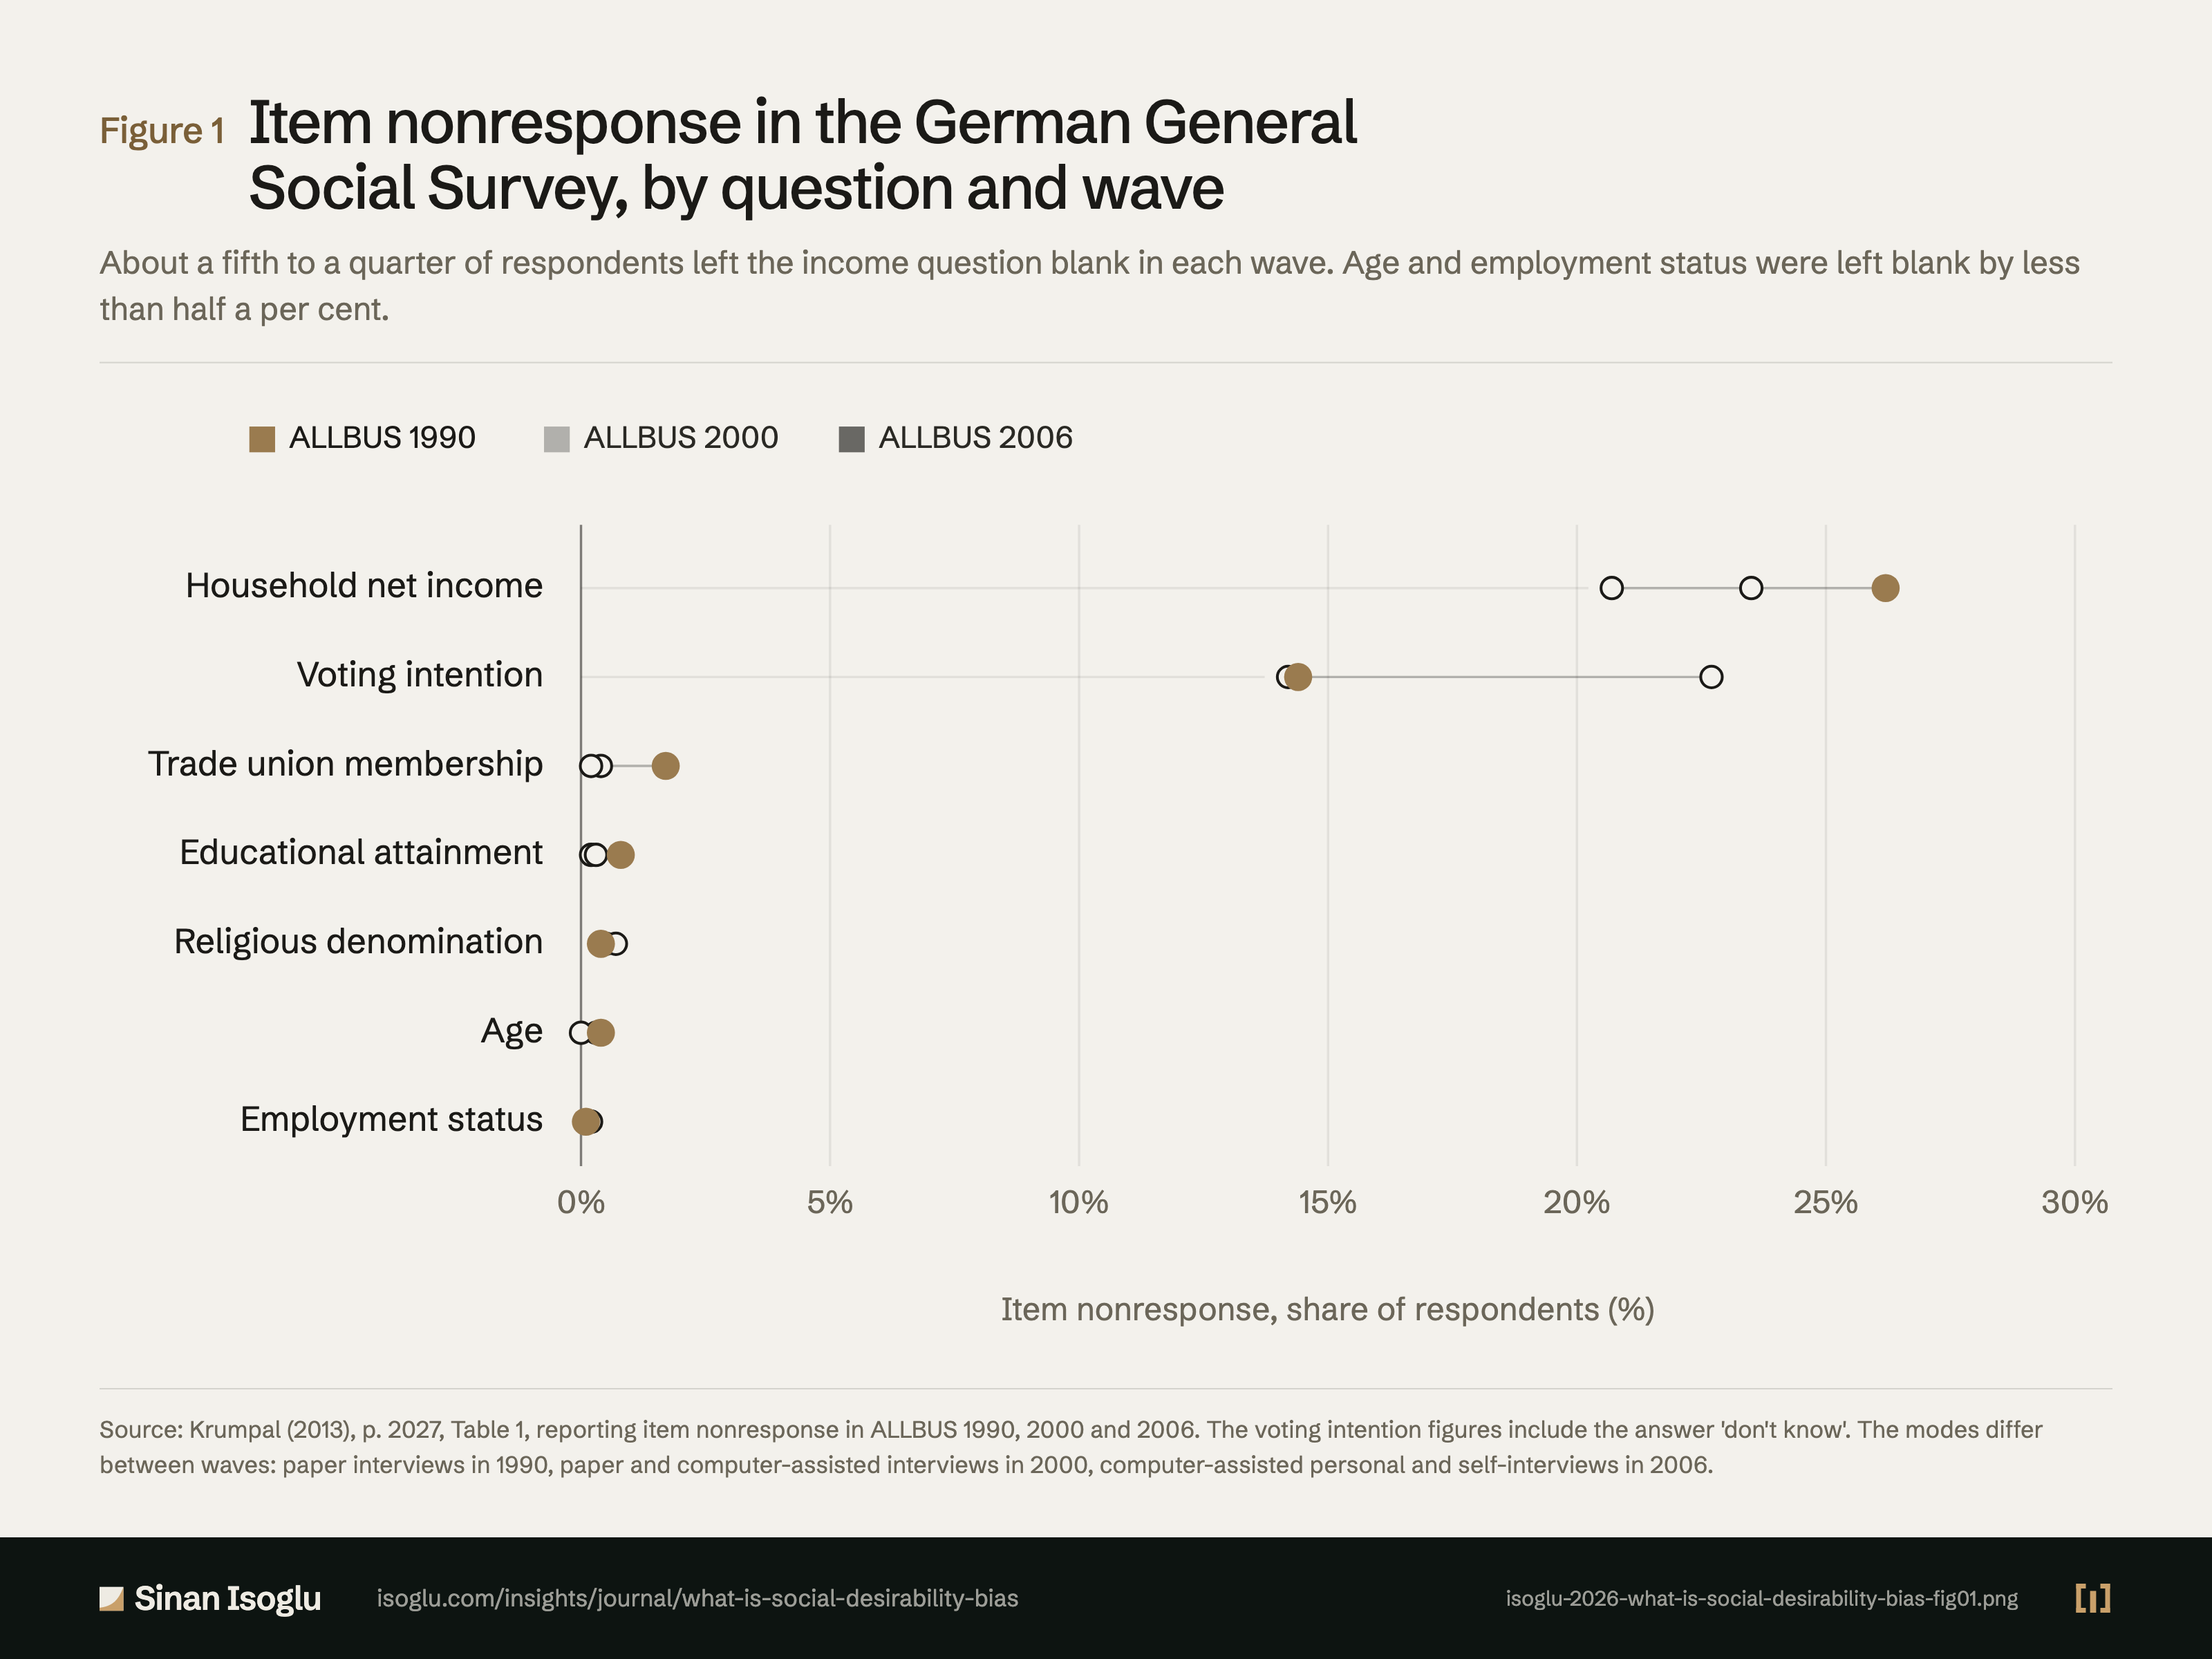
Figure 1Figure
Item nonresponse in the German General Social Survey, by question and wave
What is social desirability bias?
Contact
Bring the question you're working on.
Research, a guest lecture, or a commercial question.