Figure 1From “What is propensity score matching?”
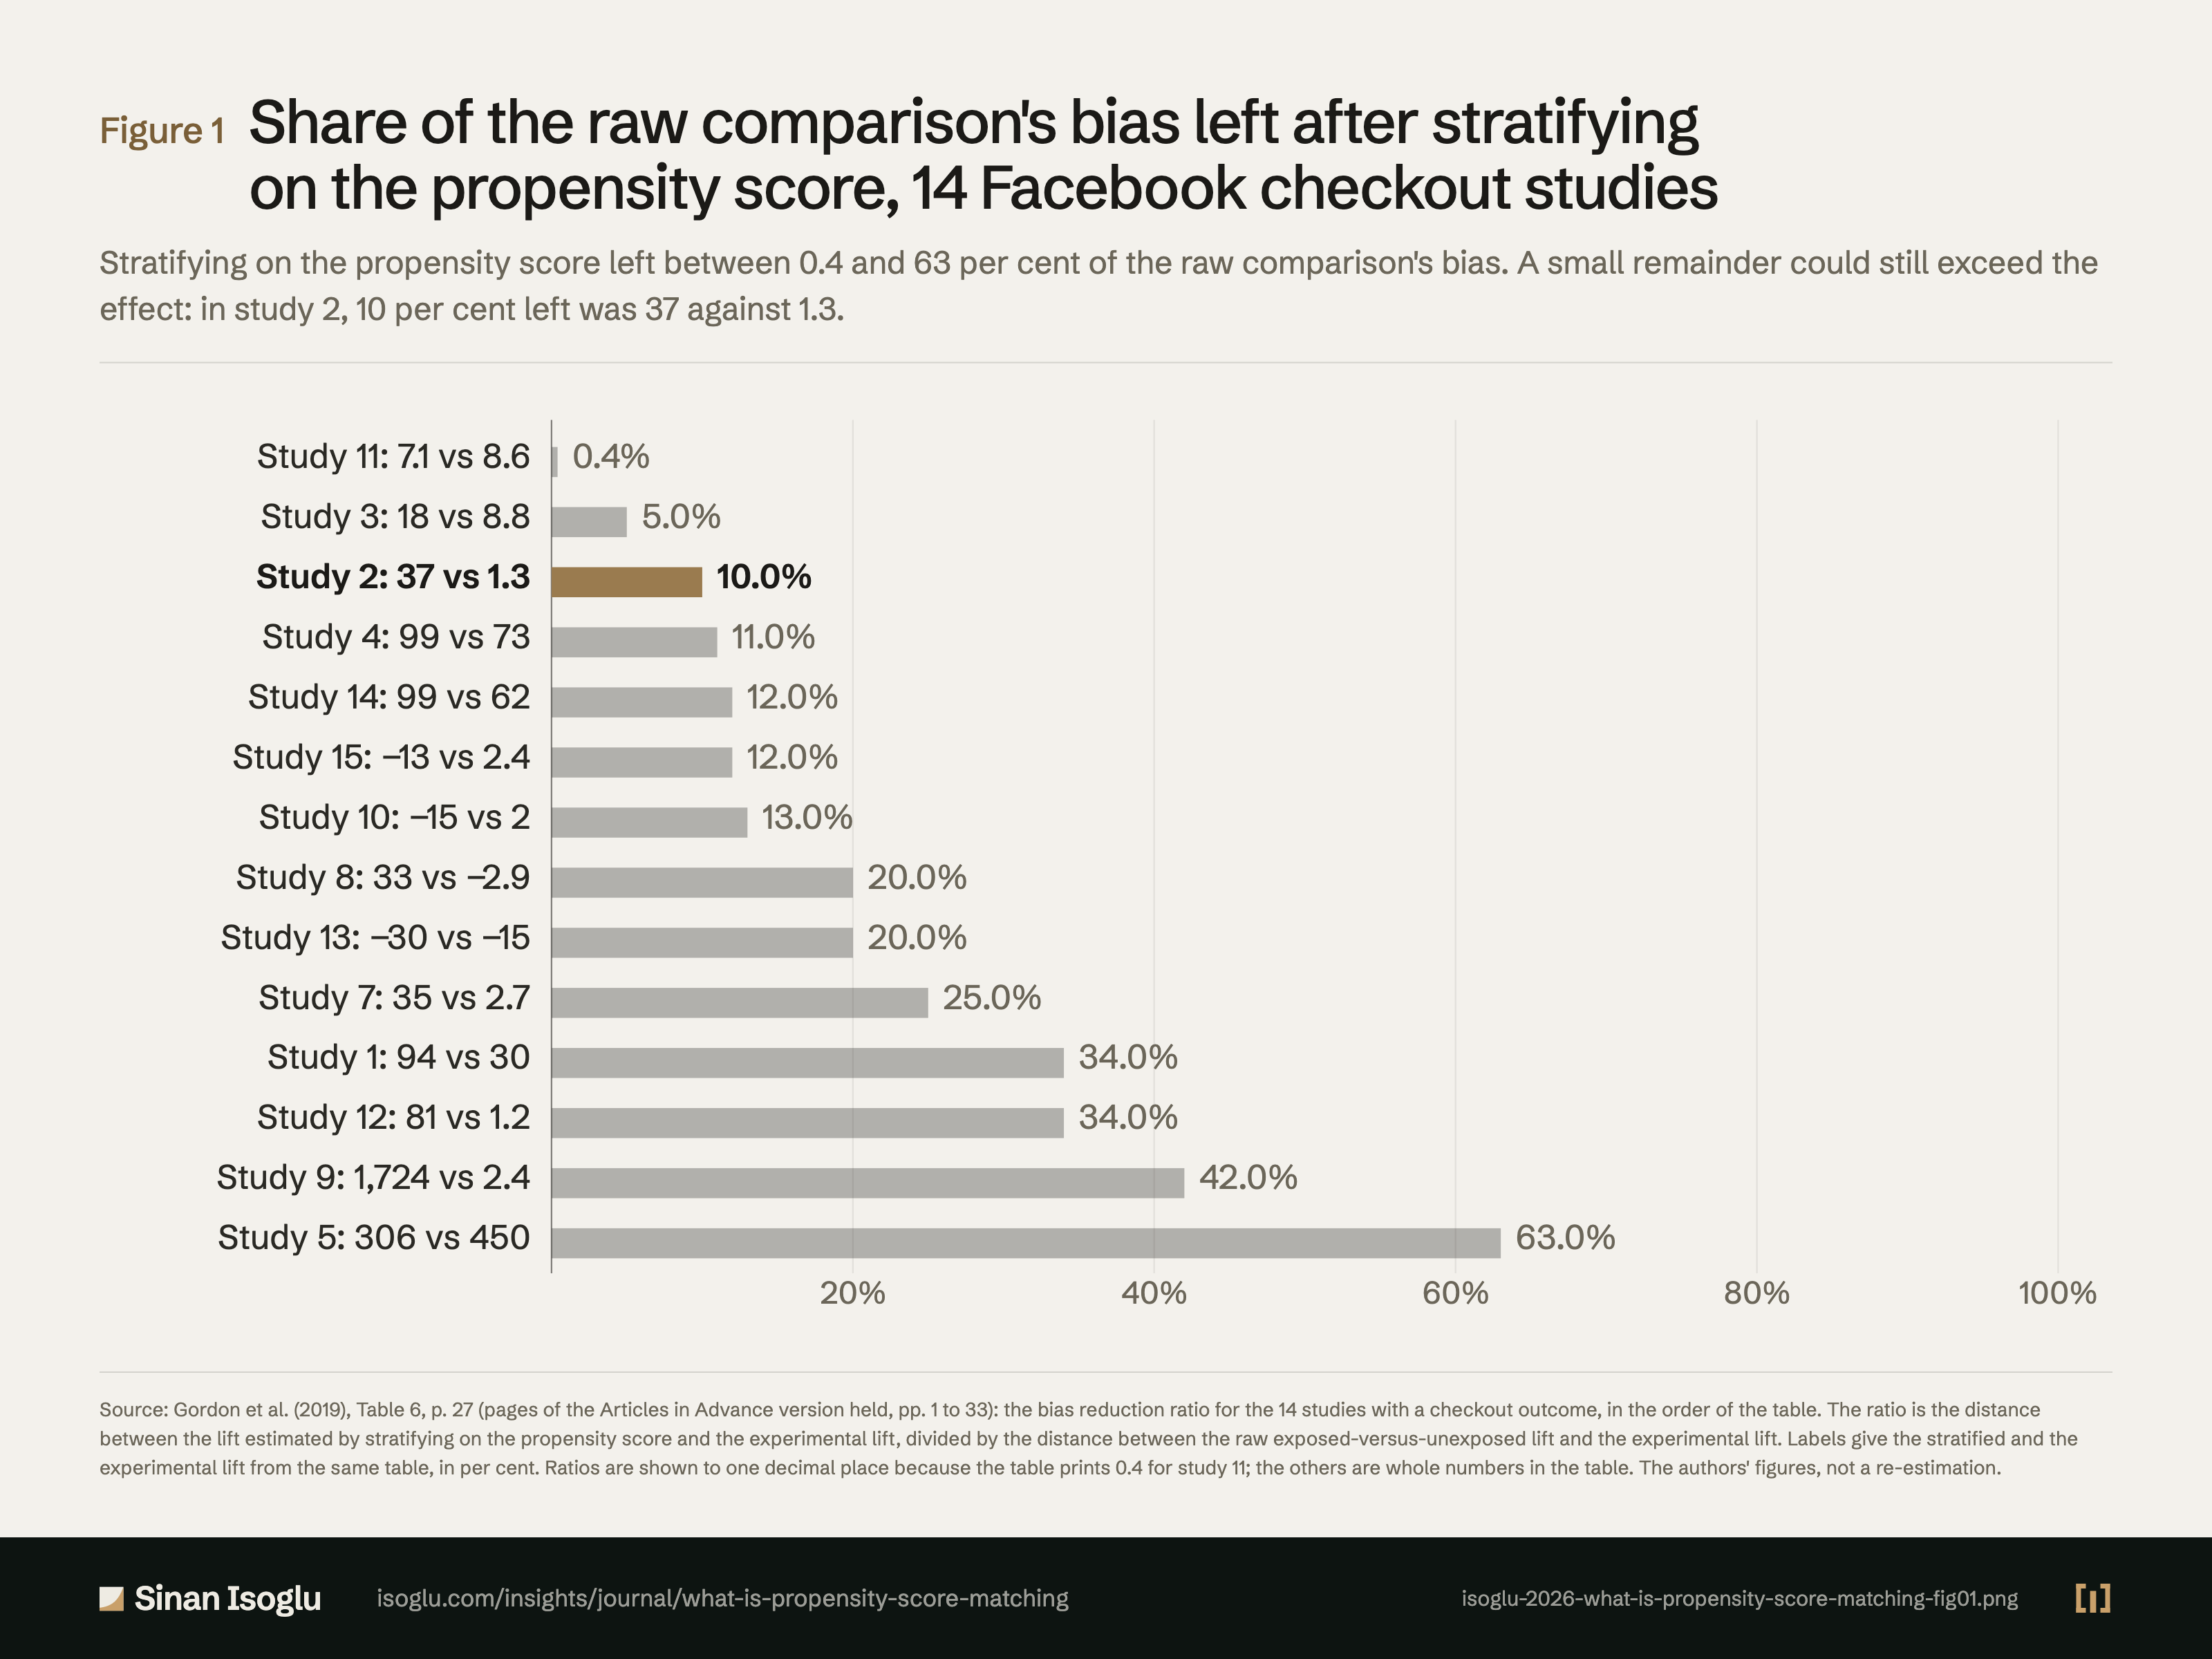
Share of the raw comparison's bias left after stratifying on the propensity score, 14 Facebook checkout studies
Stratifying on the propensity score left between 0.4 and 63 per cent of the raw comparison's bias. A small remainder could still exceed the effect: in study 2, 10 per cent left was 37 against 1.3.
Figure 1Share of the raw comparison's bias left after stratifying on the propensity score, 14 Facebook checkout studies
Source: Gordon et al. (2019), Table 6, p. 27 (pages of the Articles in Advance version held, pp. 1 to 33): the bias reduction ratio for the 14 studies with a checkout outcome, in the order of the table. The ratio is the distance between the lift estimated by stratifying on the propensity score and the experimental lift, divided by the distance between the raw exposed-versus-unexposed lift and the experimental lift. Labels give the stratified and the experimental lift from the same table, in per cent. Ratios are shown to one decimal place because the table prints 0.4 for study 11; the others are whole numbers in the table. The authors' figures, not a re-estimation.
Source and evidence
Each line names a claim related to this exhibit, its source, and how it was checked.
- A GZBC19-C13 Table 6 (p. 27, page image): brr is the remaining bias after stratification over the total selection effect, the absolute gap between the stratified and the RCT lift divided by the absolute gap between the exposed-versus-unexposed and the RCT lift; for the 14 checkout studies in table order (study: EU, STRAT, RCT, brr, in per cent): 11: 392, 7.1, 8.6, 0.4; 3: 198, 18, 8.8, 5; 2: 377, 37, 1.3, 10; 4: 316, 99, 73, 11; 14: 365, 99, 62, 12; 15: 126, -13, 2.4, 12; 10: 138, -15, 2, 13; 8: 179, 33, -2.9, 20; 13: 61, -30, -15, 20; 7: 131, 35, 2.7, 25; 1: 217, 94, 30, 34; 12: 233, 81, 1.2, 34; 9: 4,074, 1,724, 2.4, 42; 5: 678, 306, 450, 63; brr is below 50 in 13 of the 14 (author's count); in study 2, 90 per cent eliminated still leaves 37 against 1.3; Figure 10 (p. 24, page image) shows the same stratified values in the column with all four variable sets, except study 7, where Figure 10 and Figure A.1 (p. 29) print -35 and -35.3 against Table 6's 35, which would put its brr near 30 (corrected at G5 2026-10-15); in studies 5, 10, 11, 13 and 15 the stratified lift lies on the other side of the RCT lift from the raw one, so the ratio there measures an overcorrection (pp. 24, 25, 27, 29): "Summary of Bias Reduction Through Stratification"; "be the ratio of remaining bias after stratification and the total selection effect"; "although we have already eliminated 90% of the bias in study 2 (brr = 10%), we need data that would allow us to reduce the remaining bias from 37% to 1.3%"; "using stratification produces a treatment with a lift estimate of 99%, compared with the RCT estimate of 73%"Gordon, Zettelmeyer, Bhargava & Chapsky (2019) · Gordon et al. (2019)
Grades: A, verified against the printed page of the primary source · B, primary source, text layer only · C, authoritative secondary · D, reported.
From the essay
From the research bench
What is propensity score matching?
Propensity score matching compares treated units with untreated ones that had a similar estimated chance of treatment. It balances only what was measured.
Read the essayThis exhibit belongs to an essay: the numbers live here, the argument lives there.
Cite or embed
Contact
Bring the question you're working on.
Research, a guest lecture, or a commercial question.