Abbildung 1Aus „Was ist Publikationsbias?“
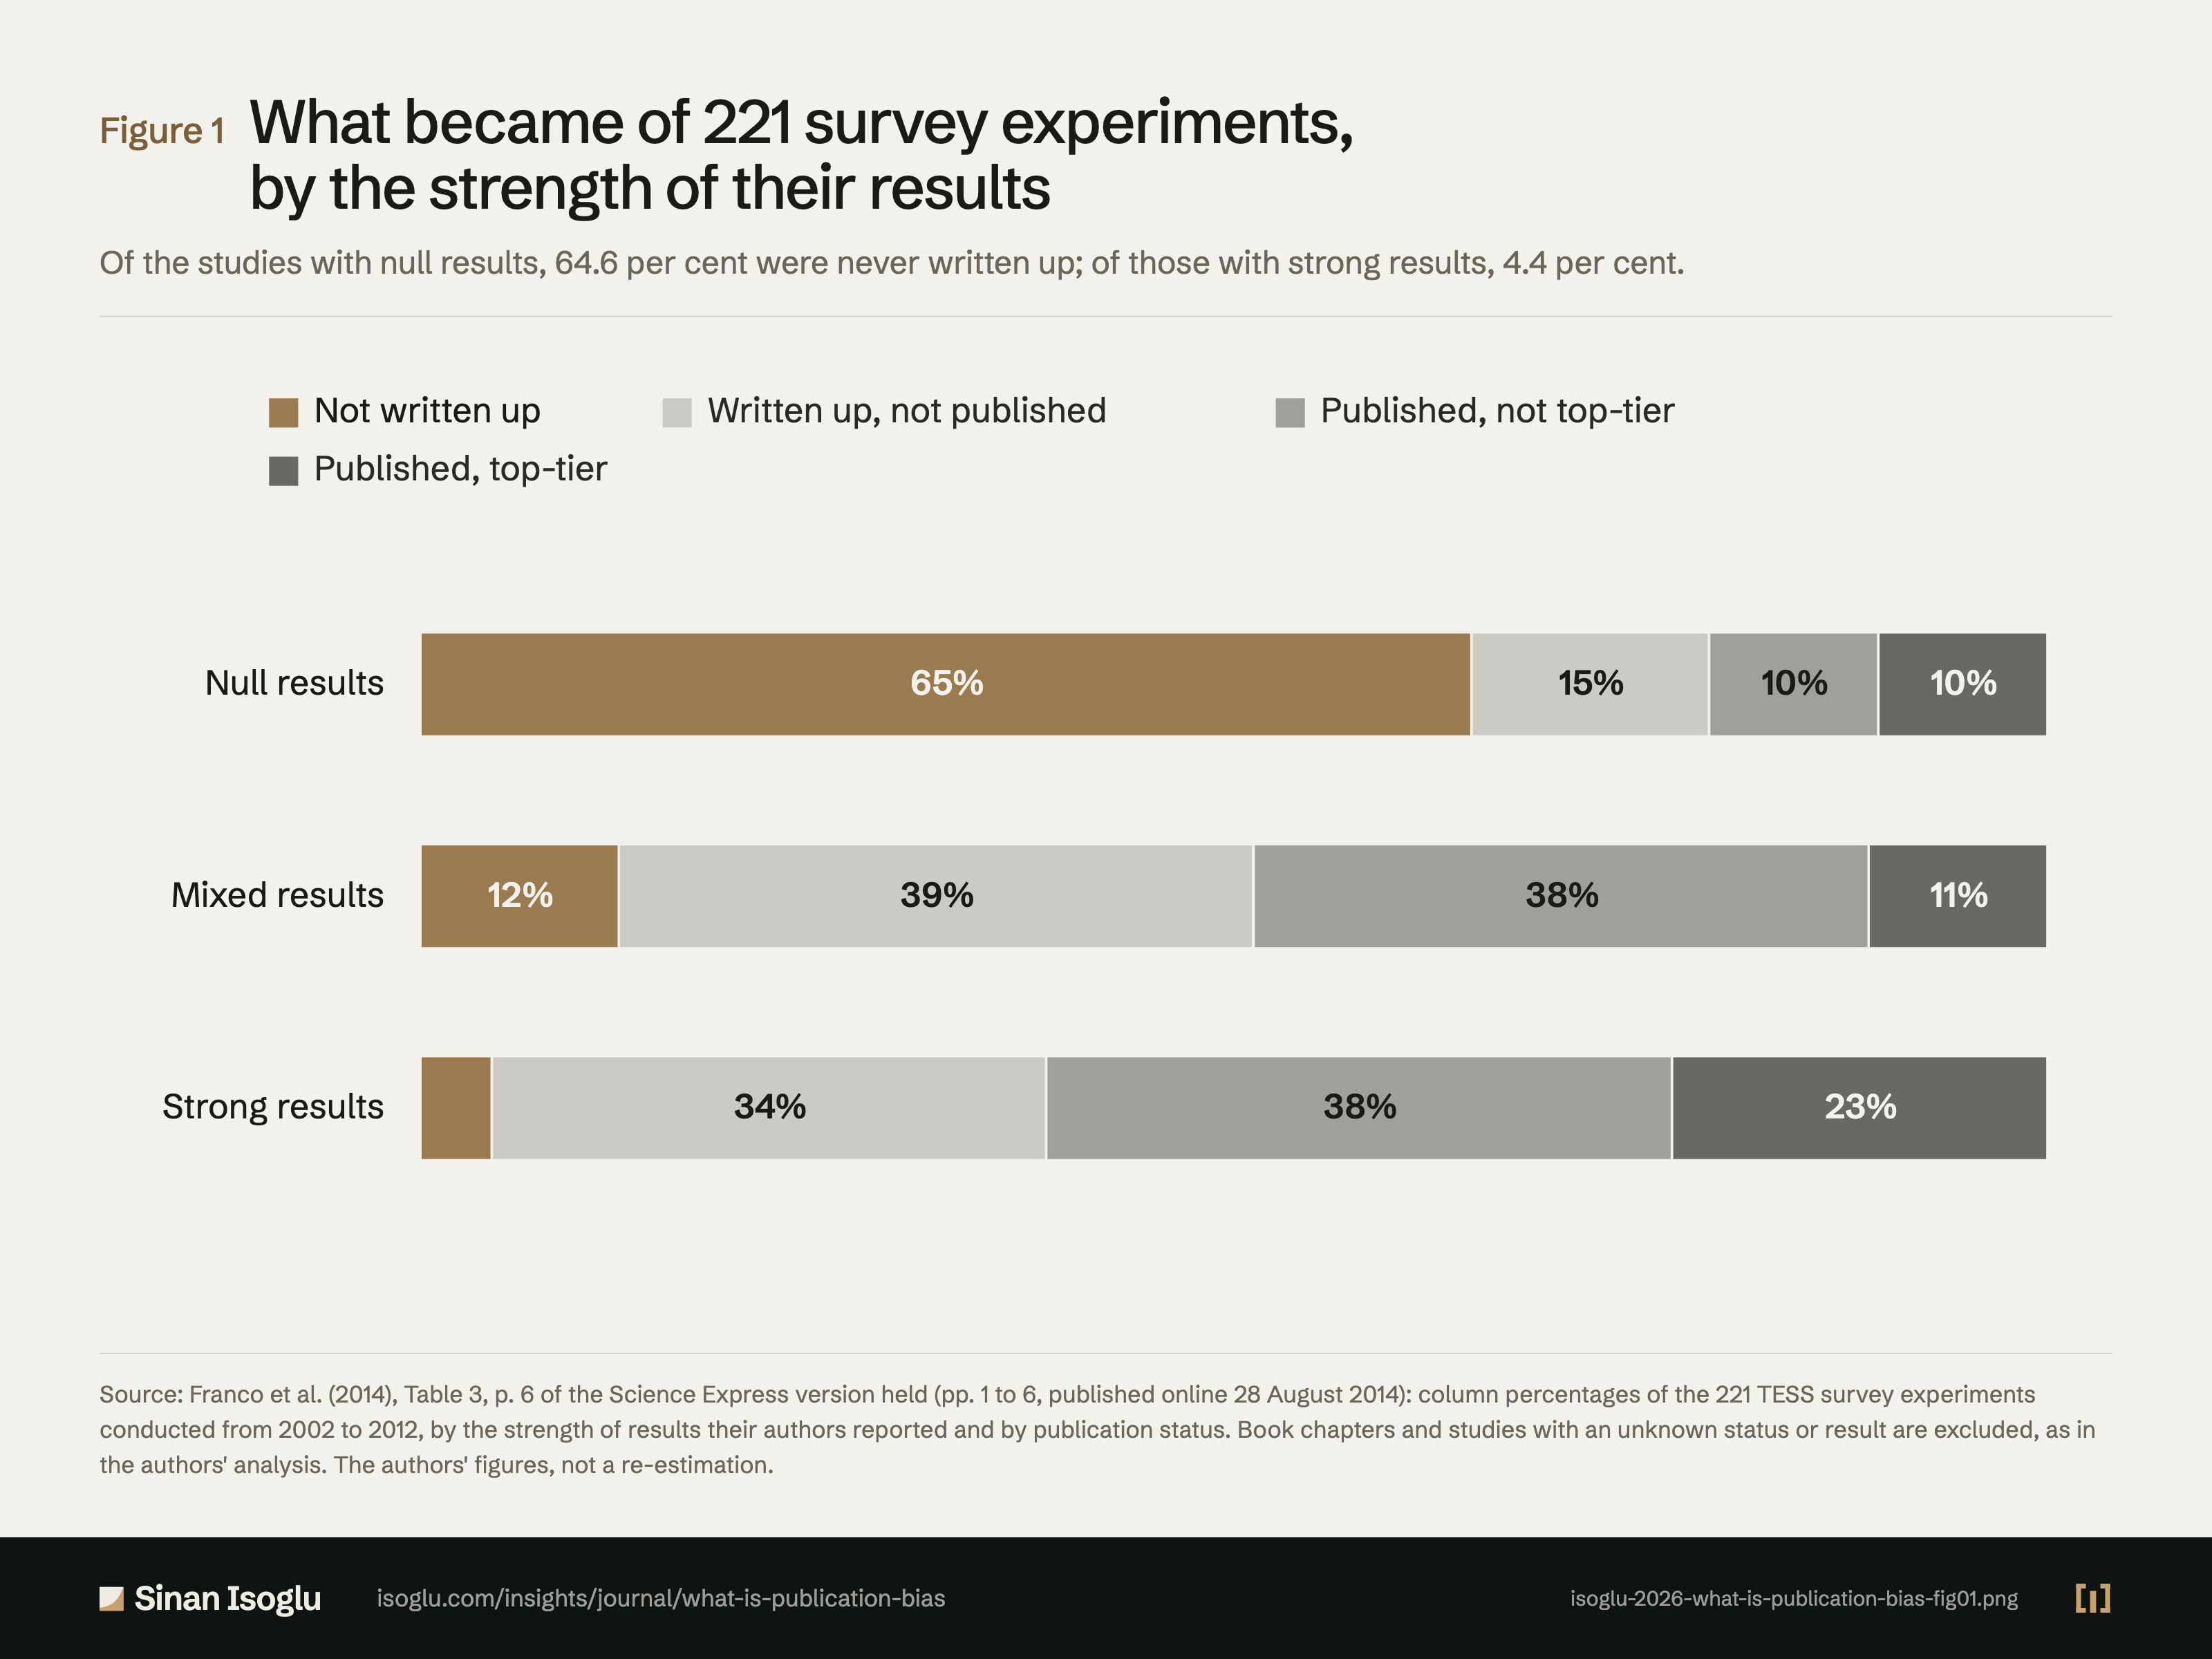
Was aus 221 Umfrageexperimenten wurde, nach der Stärke ihrer Ergebnisse
Von den Studien mit Nullergebnissen wurden 64,6 Prozent nie ausgearbeitet, von denen mit starken Ergebnissen 4,4 Prozent.
Abbildung 1Was aus 221 Umfrageexperimenten wurde, nach der Stärke ihrer Ergebnisse
Quelle: Franco et al. (2014), Tabelle 3, S. 6 der vorliegenden Science-Express-Fassung (S. 1 bis 6, online veröffentlicht am 28. August 2014): Spaltenprozente der 221 TESS-Umfrageexperimente aus den Jahren 2002 bis 2012, nach der von den Autorinnen und Autoren berichteten Stärke der Ergebnisse und nach dem Stand der Veröffentlichung. Buchkapitel und Studien mit unklarem Status oder Ergebnis sind wie in der Analyse der Autoren ausgeschlossen. Werte der Autoren, keine eigene Neuschätzung.
Quelle und Evidenz
Jede Zeile nennt eine Aussage zu dieser Abbildung, ihre Quelle und die Art ihrer Prüfung.
- A FMS14-C3 Main result: strong results 40 percentage points more likely to be published than null results and 60 percentage points more likely to be written up; Table 3 (p. 6), column percentages for null, mixed and strong results: not written 64.6, 12.2, 4.4; written but not published 14.6, 39.0, 34.1; published in non-top-tier journals 10.4, 37.8, 38.5; published in top-tier journals 10.4, 11.0, 23.1; Table 2 (p. 6) analysed counts not written, written and published: null 31, 7, 10; mixed 10, 32, 40; strong 4, 31, 56, which sum to 48, 82 and 91 studies (this guide's sums); Pearson chi-squared test of independence χ2(6) = 80.3, P < 0.001; about half published, 20% of null results in print against roughly 60% of strong and 50% of mixed results; more than 20% of the studies had null findings but less than 10% of published articles report such results; 65% of null results never written up; among written-up studies no significant relationship between strength of results and publication status (pp. 1, 2, 6 of the Science Express version): "results are 40 percentage points more likely to be published than null results, and"; "60 percentage points more likely to be written up"; "Cross-tabulation between statistical results of TESS studies and their publication status (column percentages"; "Not written 64.6% 12.2% 4.4%"; "Written but not published 14.6 39.0 34.1"; "Published (non-top-tier) 10.4 37.8 38.5"; "Published (top-tier) 10.4 11.0 23.1"; "Null results 31 7 10 1 0 49"; "Mixed results 10 32 40 3 1 86"; "Strong results 4 31 56 1 1 93"; "[χ2(6) = 80.3, P < 0.001]"; "sample were published, only 20% of those with null results appeared in"; "print. In contrast, roughly 60% of studies with strong results and 50% of"; "those with mixed results were published."; "studies in our sample had null findings, less than 10% of published"; "null results are published, but that so many of them are never even writ"; "ten up (65%)"; "once we condition on studies that"; "no significant relationship between strength of"; "results and publication status (see Table S2)."Franco, Malhotra & Simonovits (2014) · Franco, Malhotra & Simonovits. (2014)
Prüfgrade: A, gegen die gedruckte Seite der Primärquelle geprüft · B, Primärquelle, nur Textebene · C, belastbare Sekundärquelle · D, berichtet.
Aus dem Beitrag
Aus der Forschung
Was ist Publikationsbias?
Bei Publikationsbias bestimmt das Ergebnis, ob eine Studie erscheint. In einer bekannten Studienmenge wurden die meisten Nullergebnisse nie ausgearbeitet.
Den Beitrag lesenDiese Abbildung gehört zu einem Essay: Die Zahlen stehen hier, das Argument dort.
Zitieren oder einbetten
Verwandte Abbildungen
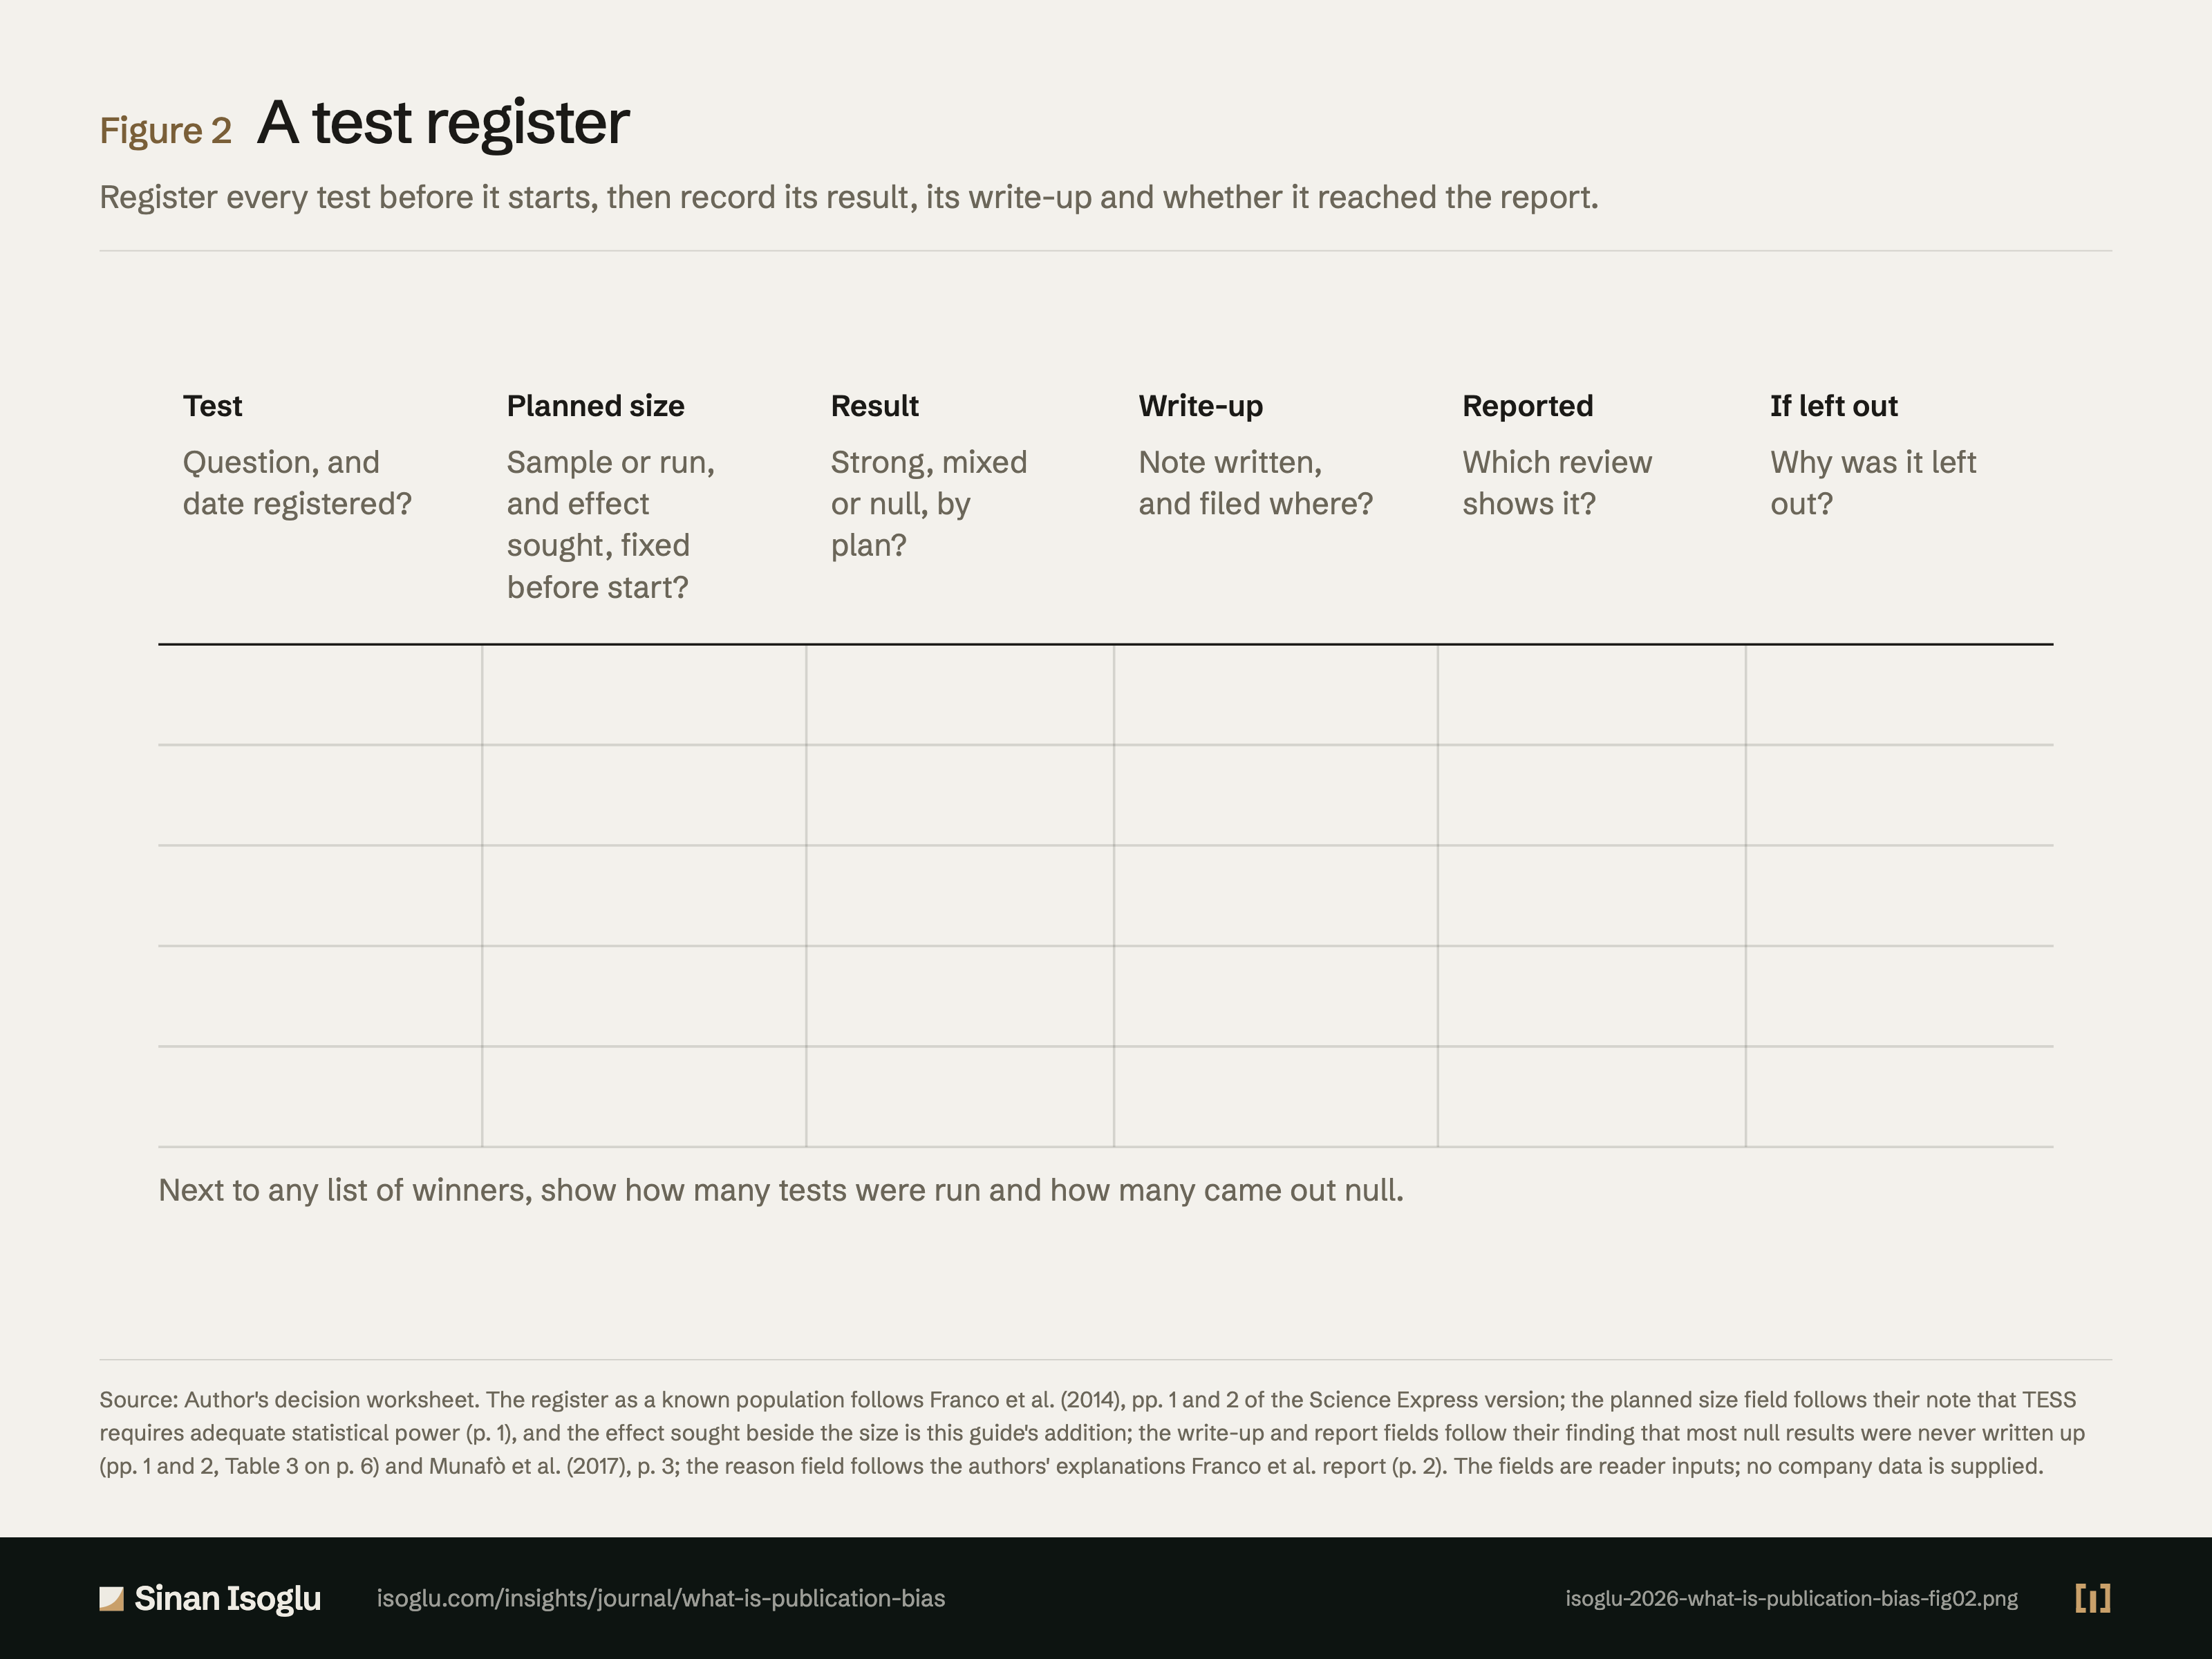
Abbildung 2Grafik
Ein Testregister
Was ist Publikationsbias?
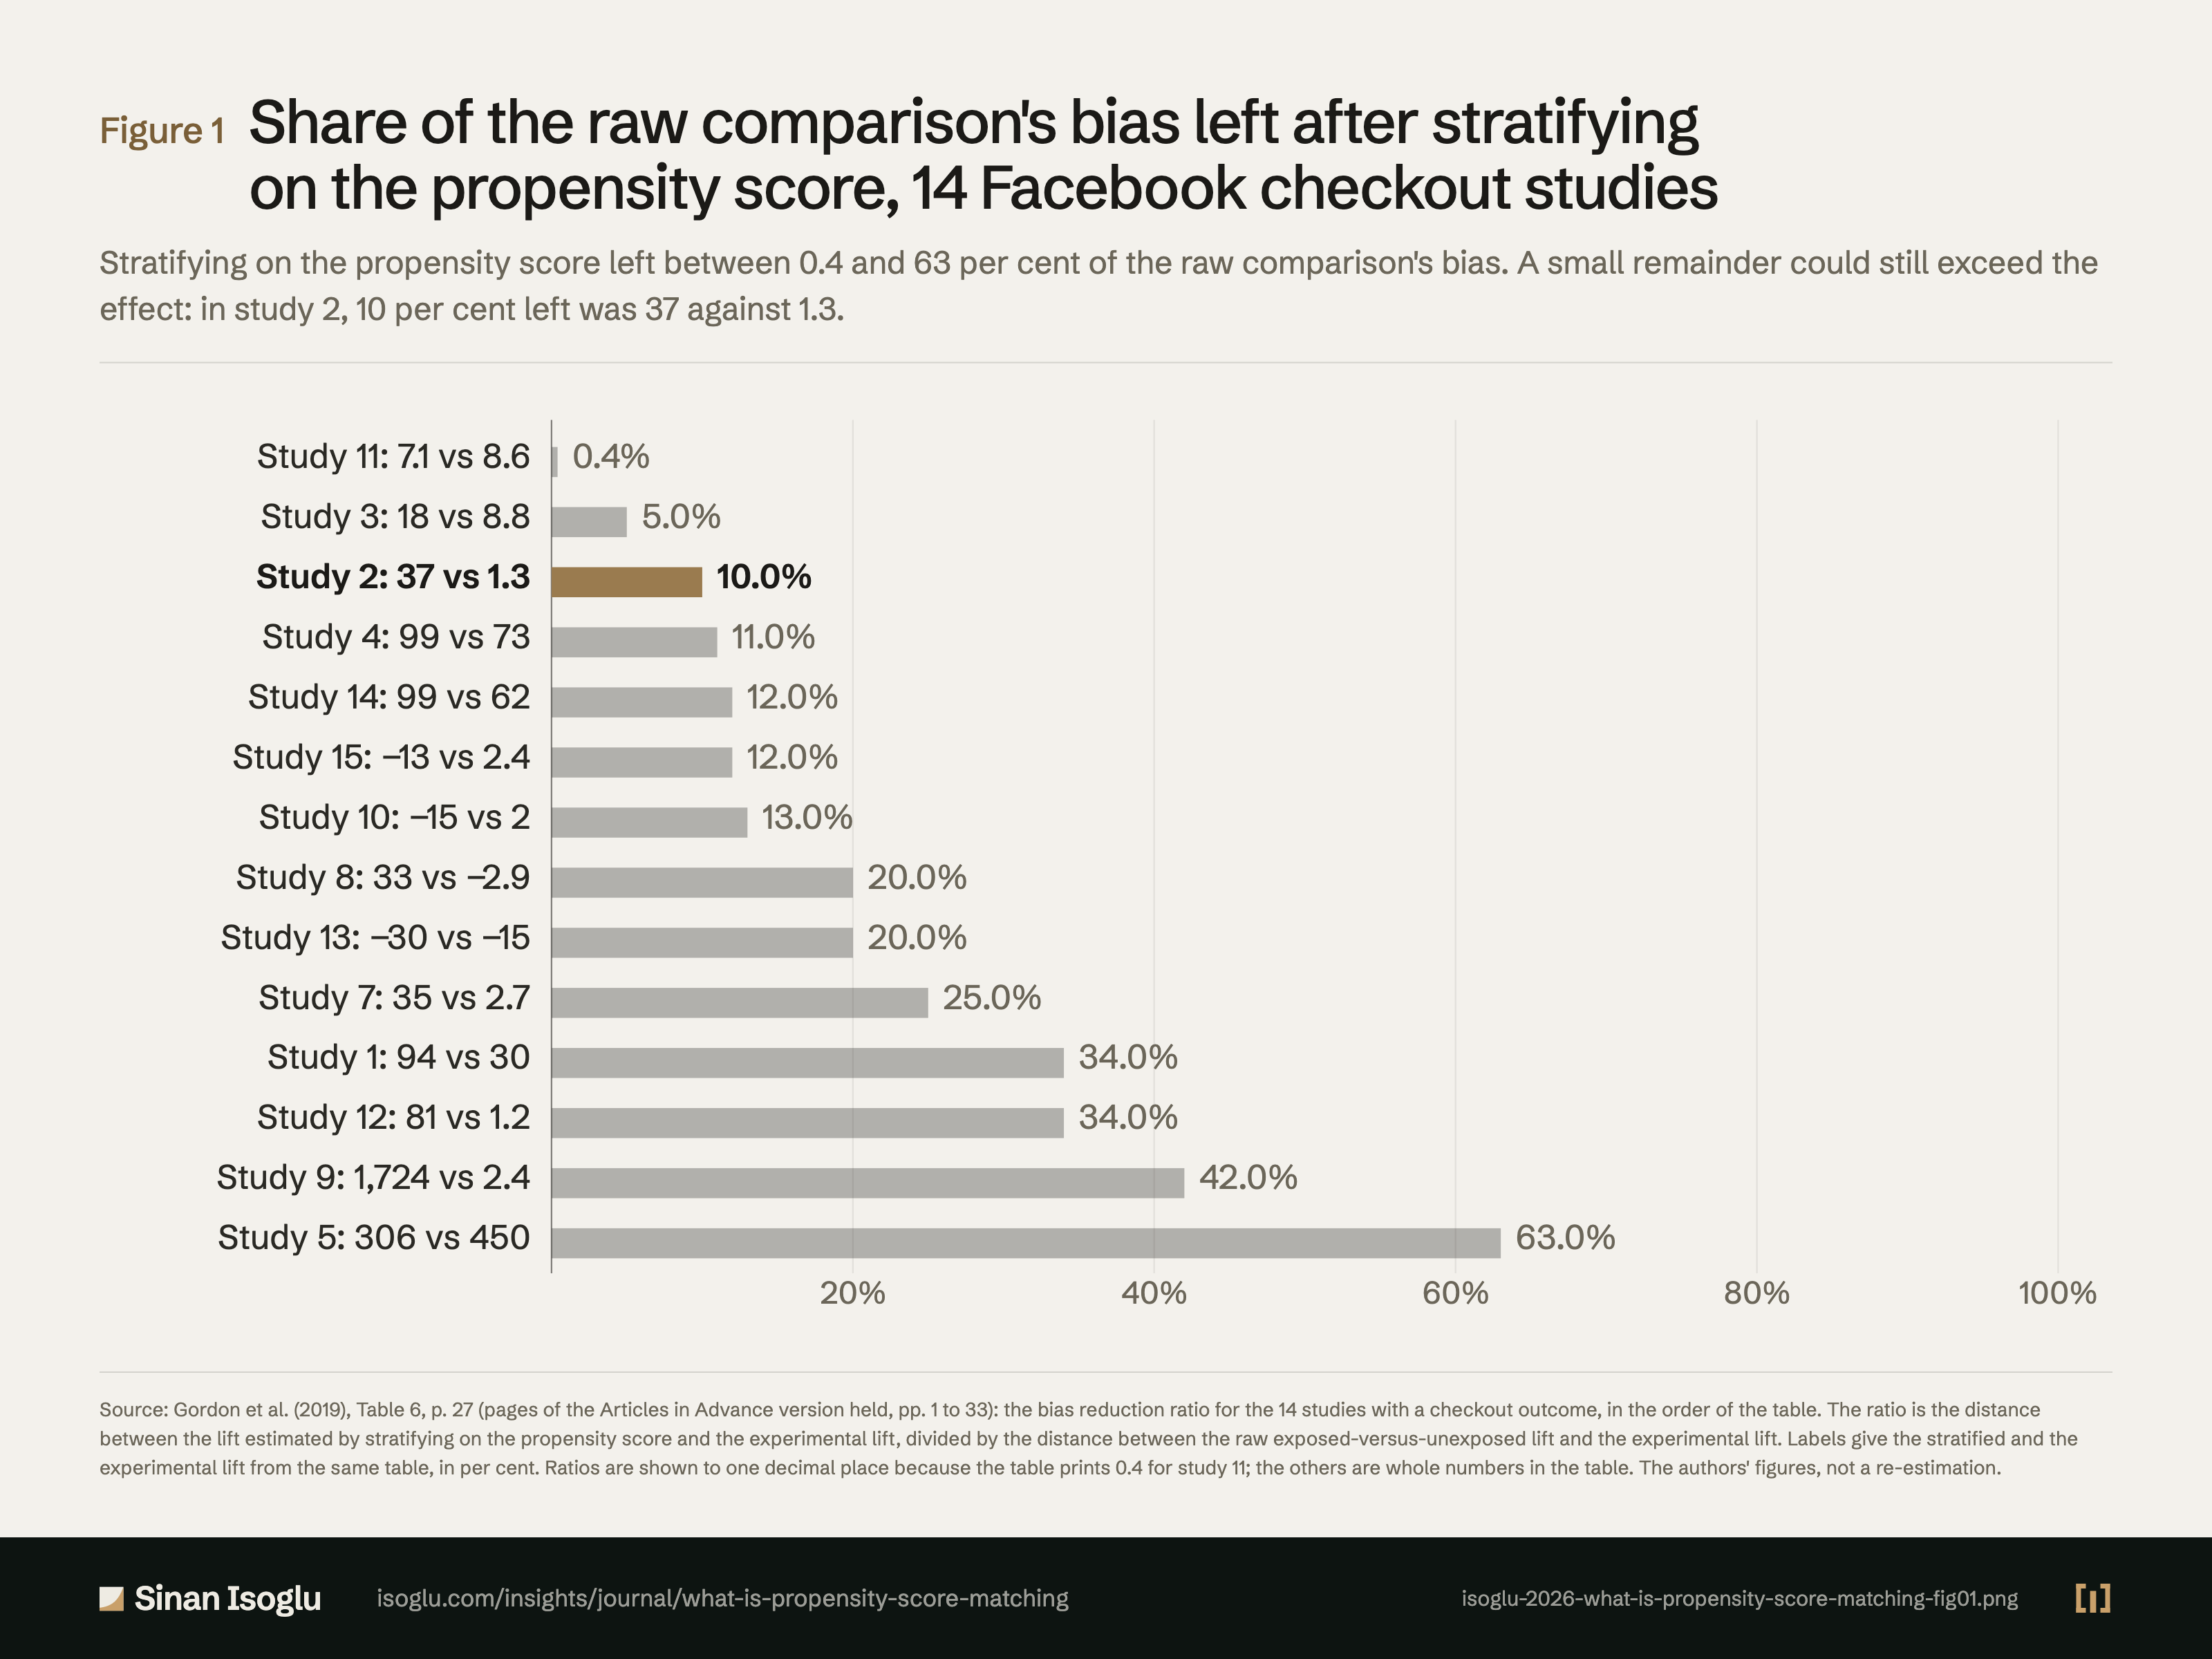
Abbildung 1Grafik
Anteil der Verzerrung des rohen Vergleichs nach der Stratifizierung auf dem Propensity Score, 14 Facebook-Studien mit Kauf als Conversion
Was ist Propensity-Score-Matching?
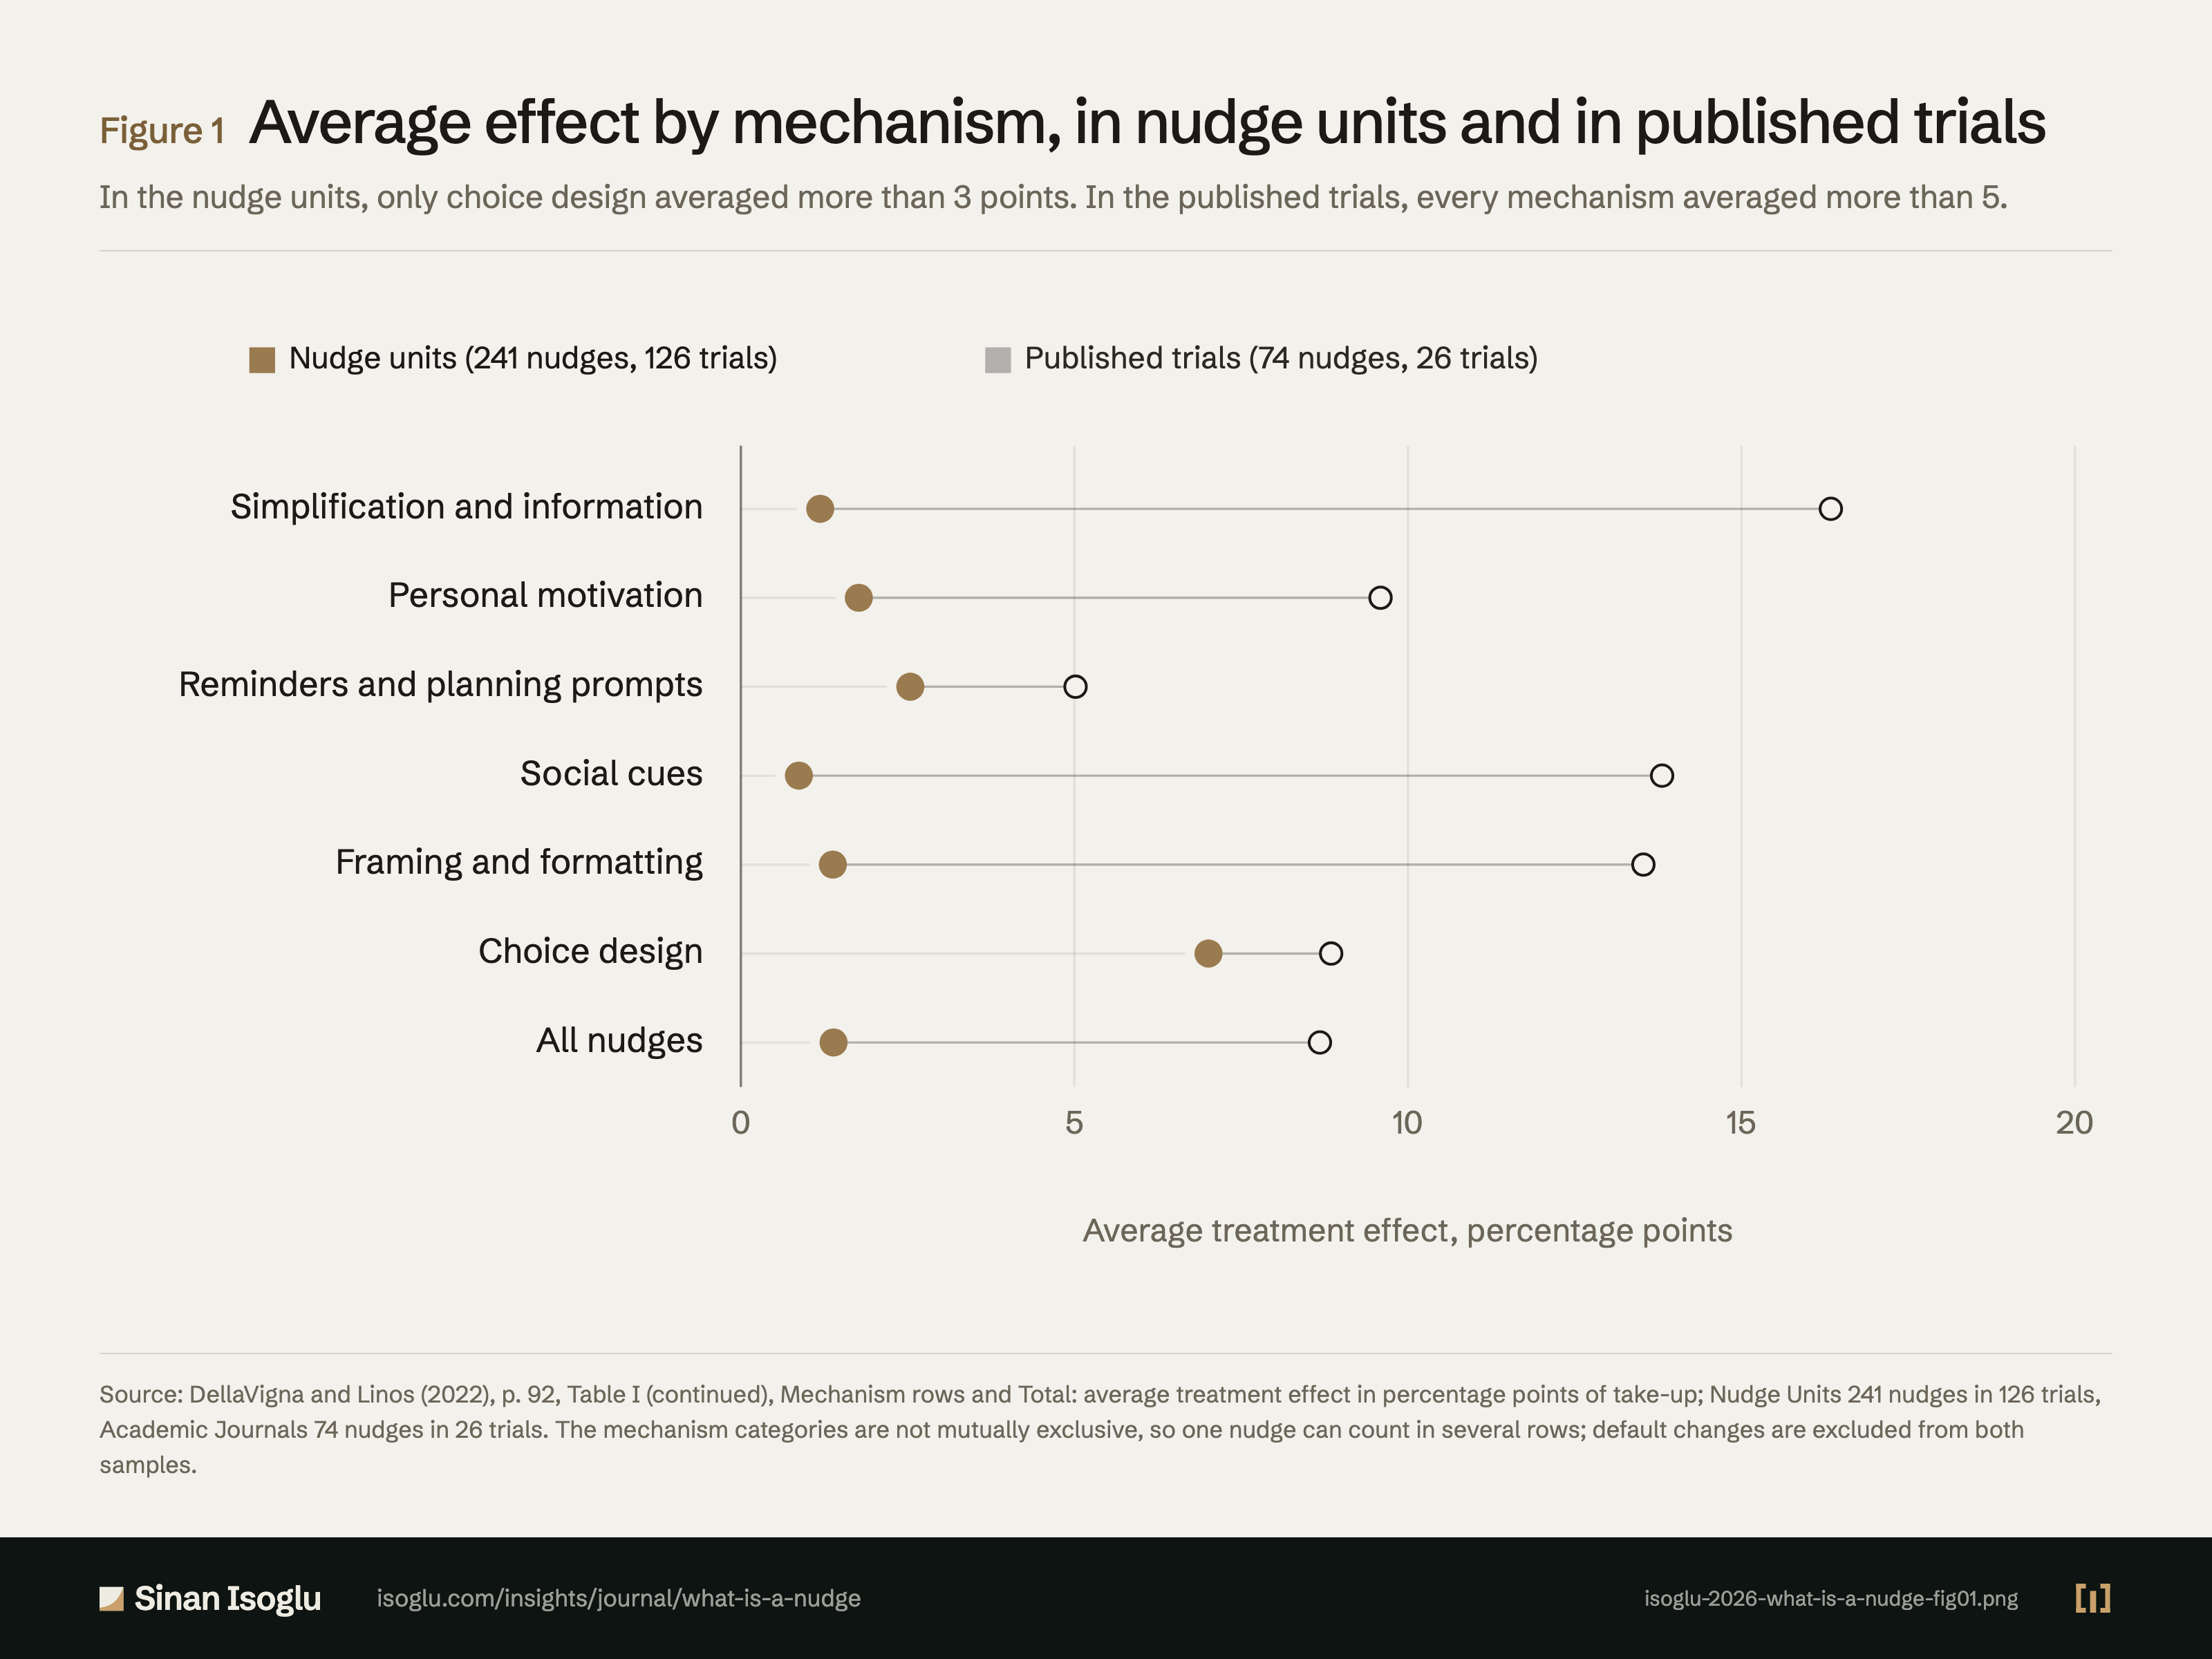
Abbildung 1Grafik
Durchschnittlicher Nudge-Effekt nach Mechanismus, in den Nudge-Einheiten und in publizierten Studien
Was ist ein Nudge?
Kontakt
Schicken Sie die Frage, an der Sie arbeiten.
Forschung, ein Gastvortrag oder eine Frage aus der Praxis.