Figure 3From “What is pricing strategy?”
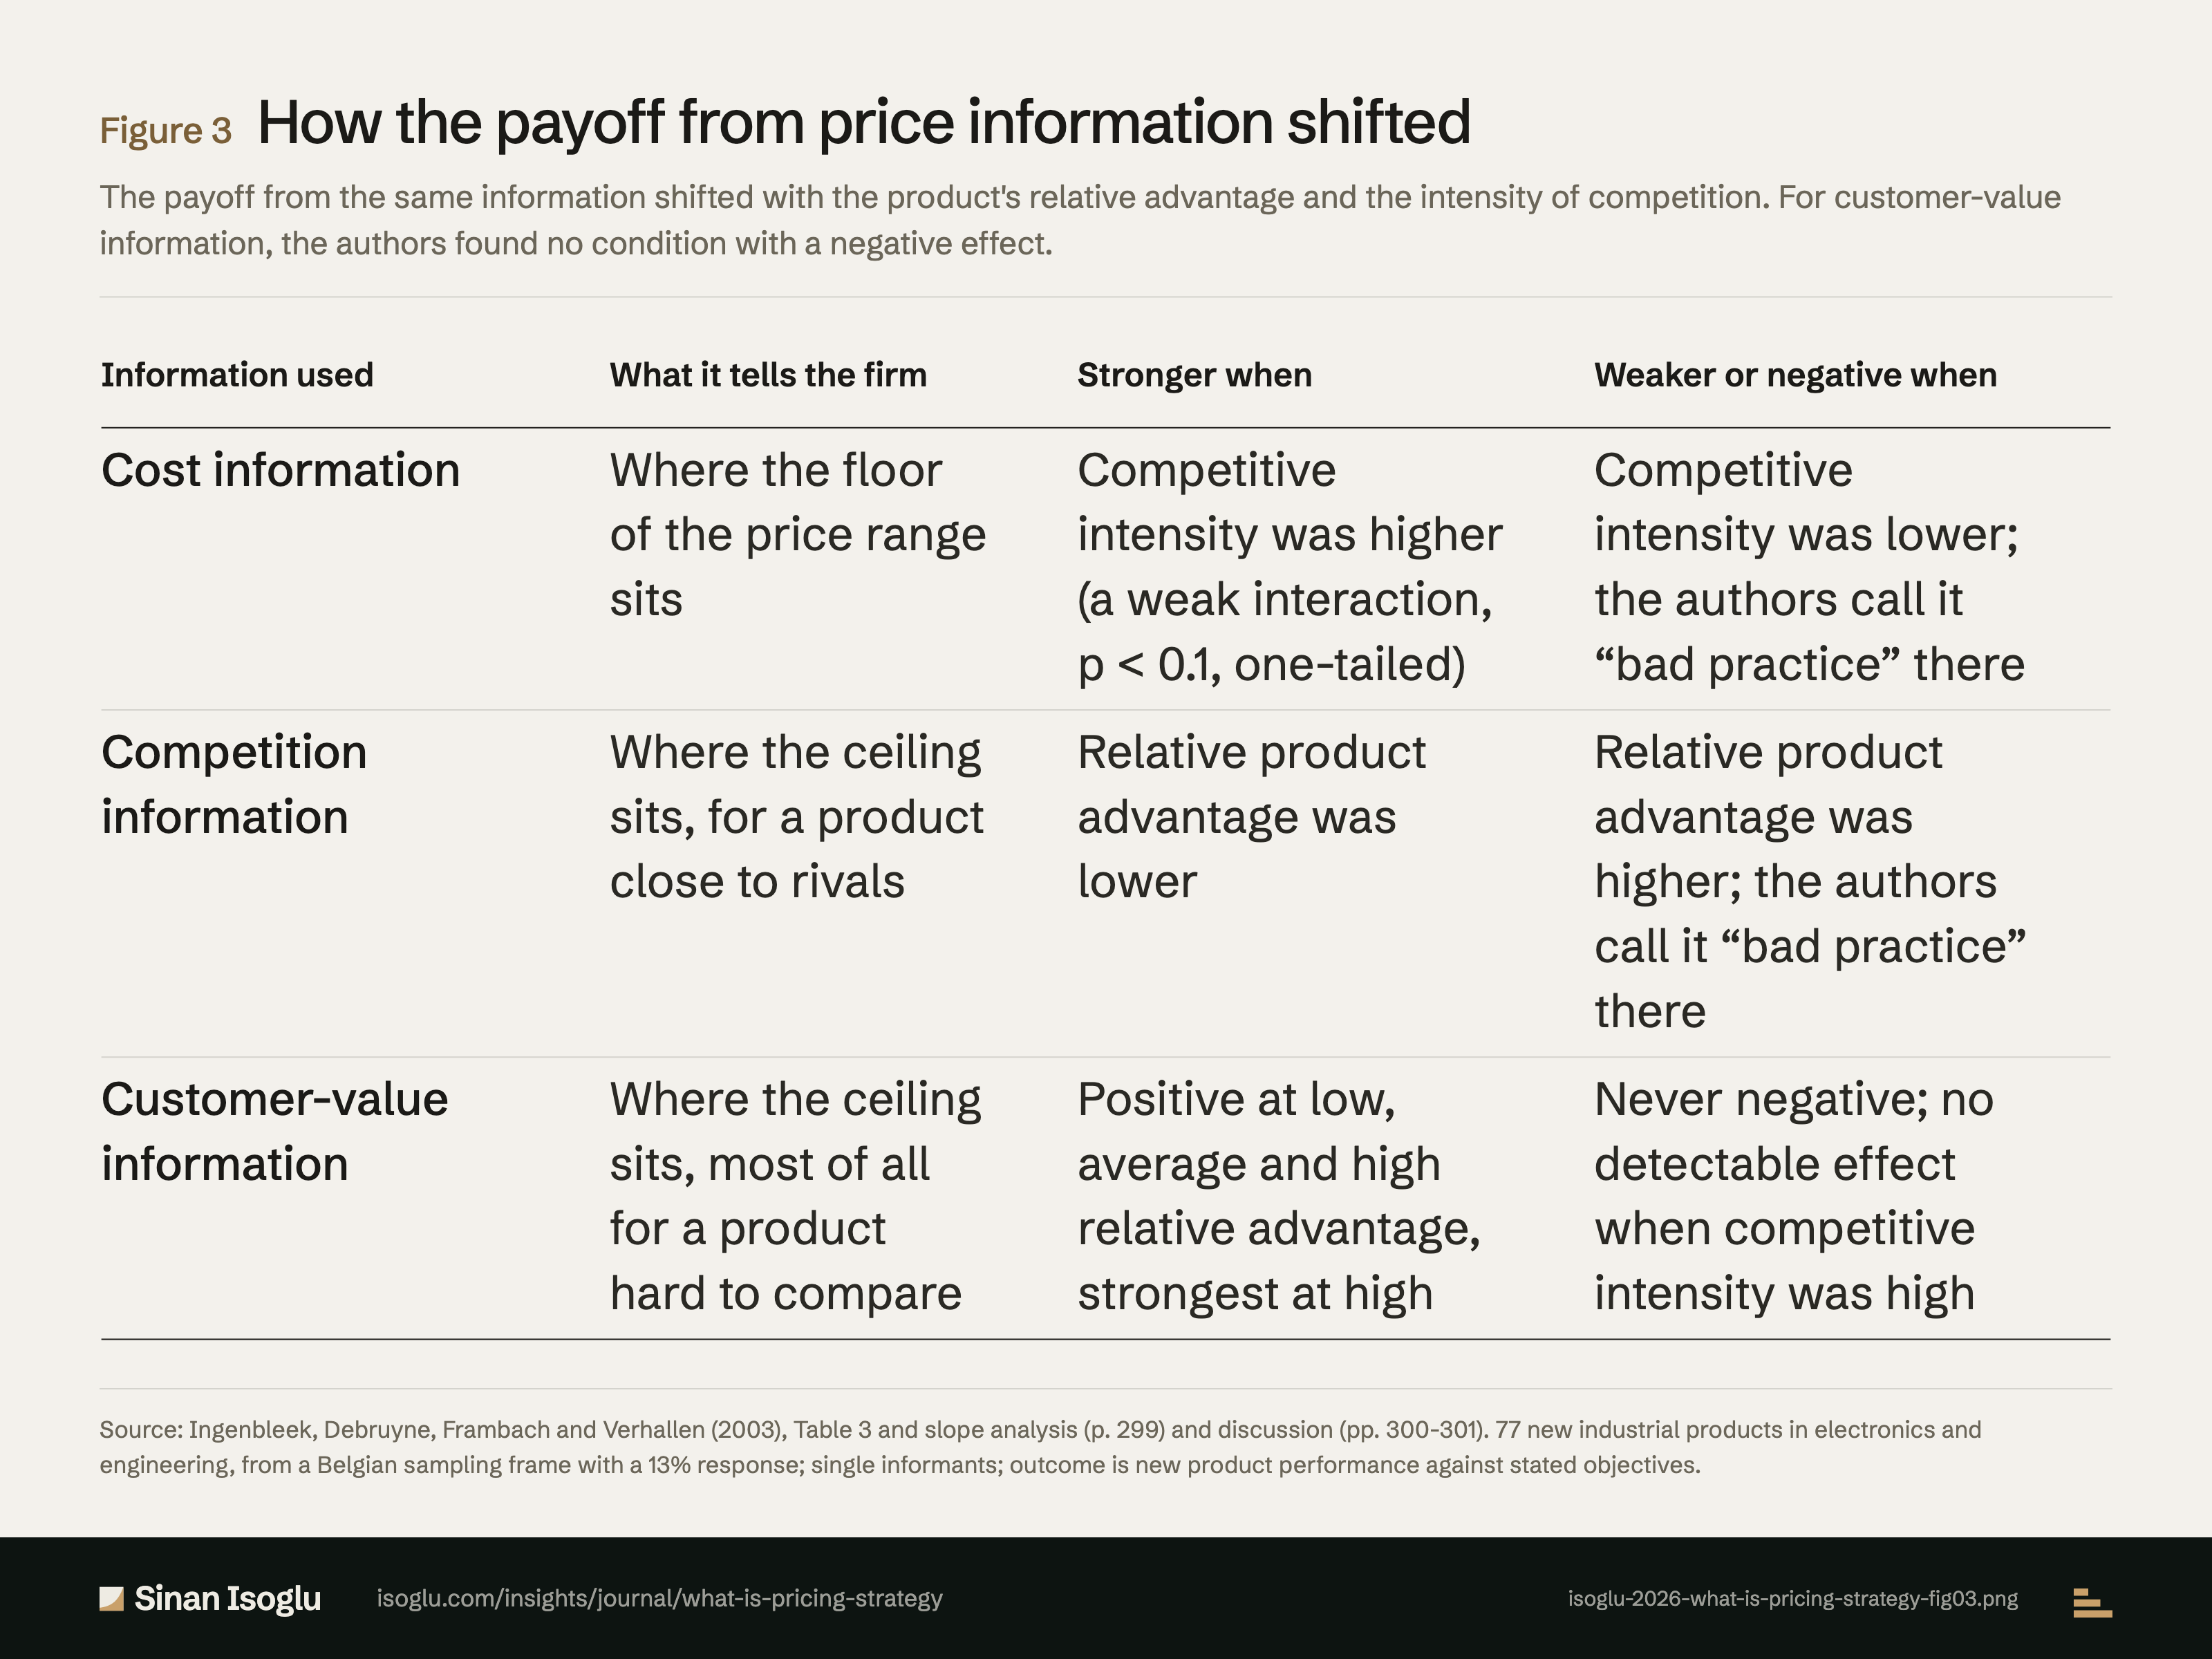
How the payoff from price information shifted
The payoff from the same information shifted with the product's relative advantage and the intensity of competition. For customer-value information, the authors found no condition with a negative effect.
Figure 3How the payoff from price information shifted
| Information used | What it tells the firm | Stronger when | Weaker or negative when |
|---|---|---|---|
| Cost information | Where the floor of the price range sits | Competitive intensity was higher (a weak interaction, p < 0.1, one-tailed) | Competitive intensity was lower; the authors call it "bad practice" there |
| Competition information | Where the ceiling sits, for a product close to rivals | Relative product advantage was lower | Relative product advantage was higher; the authors call it "bad practice" there |
| Customer-value information | Where the ceiling sits, most of all for a product hard to compare | Positive at low, average and high relative advantage, strongest at high | Never negative; no detectable effect when competitive intensity was high |
Swipe or scroll horizontally if the table is wider than your screen.
Source: Ingenbleek, Debruyne, Frambach and Verhallen (2003), Table 3 and slope analysis (p. 299) and discussion (pp. 300-301). 77 new industrial products in electronics and engineering, from a Belgian sampling frame with a 13% response; single informants; outcome is new product performance against stated objectives.
From the essay
Pricing & revenue architecture
What is pricing strategy?
A pricing strategy is how a firm means to reach its pricing objective. Which one fits depends on the situation, costs and rivals included, not on habit.
Read the essayThis exhibit belongs to an essay: the numbers live here, the argument lives there.
Cite or embed
Related exhibits
Contact
Bring the question you're working on.
Research, a guest lecture, or a commercial question.