Table 3From “What is price-volume-mix analysis? Separate price from what was sold”
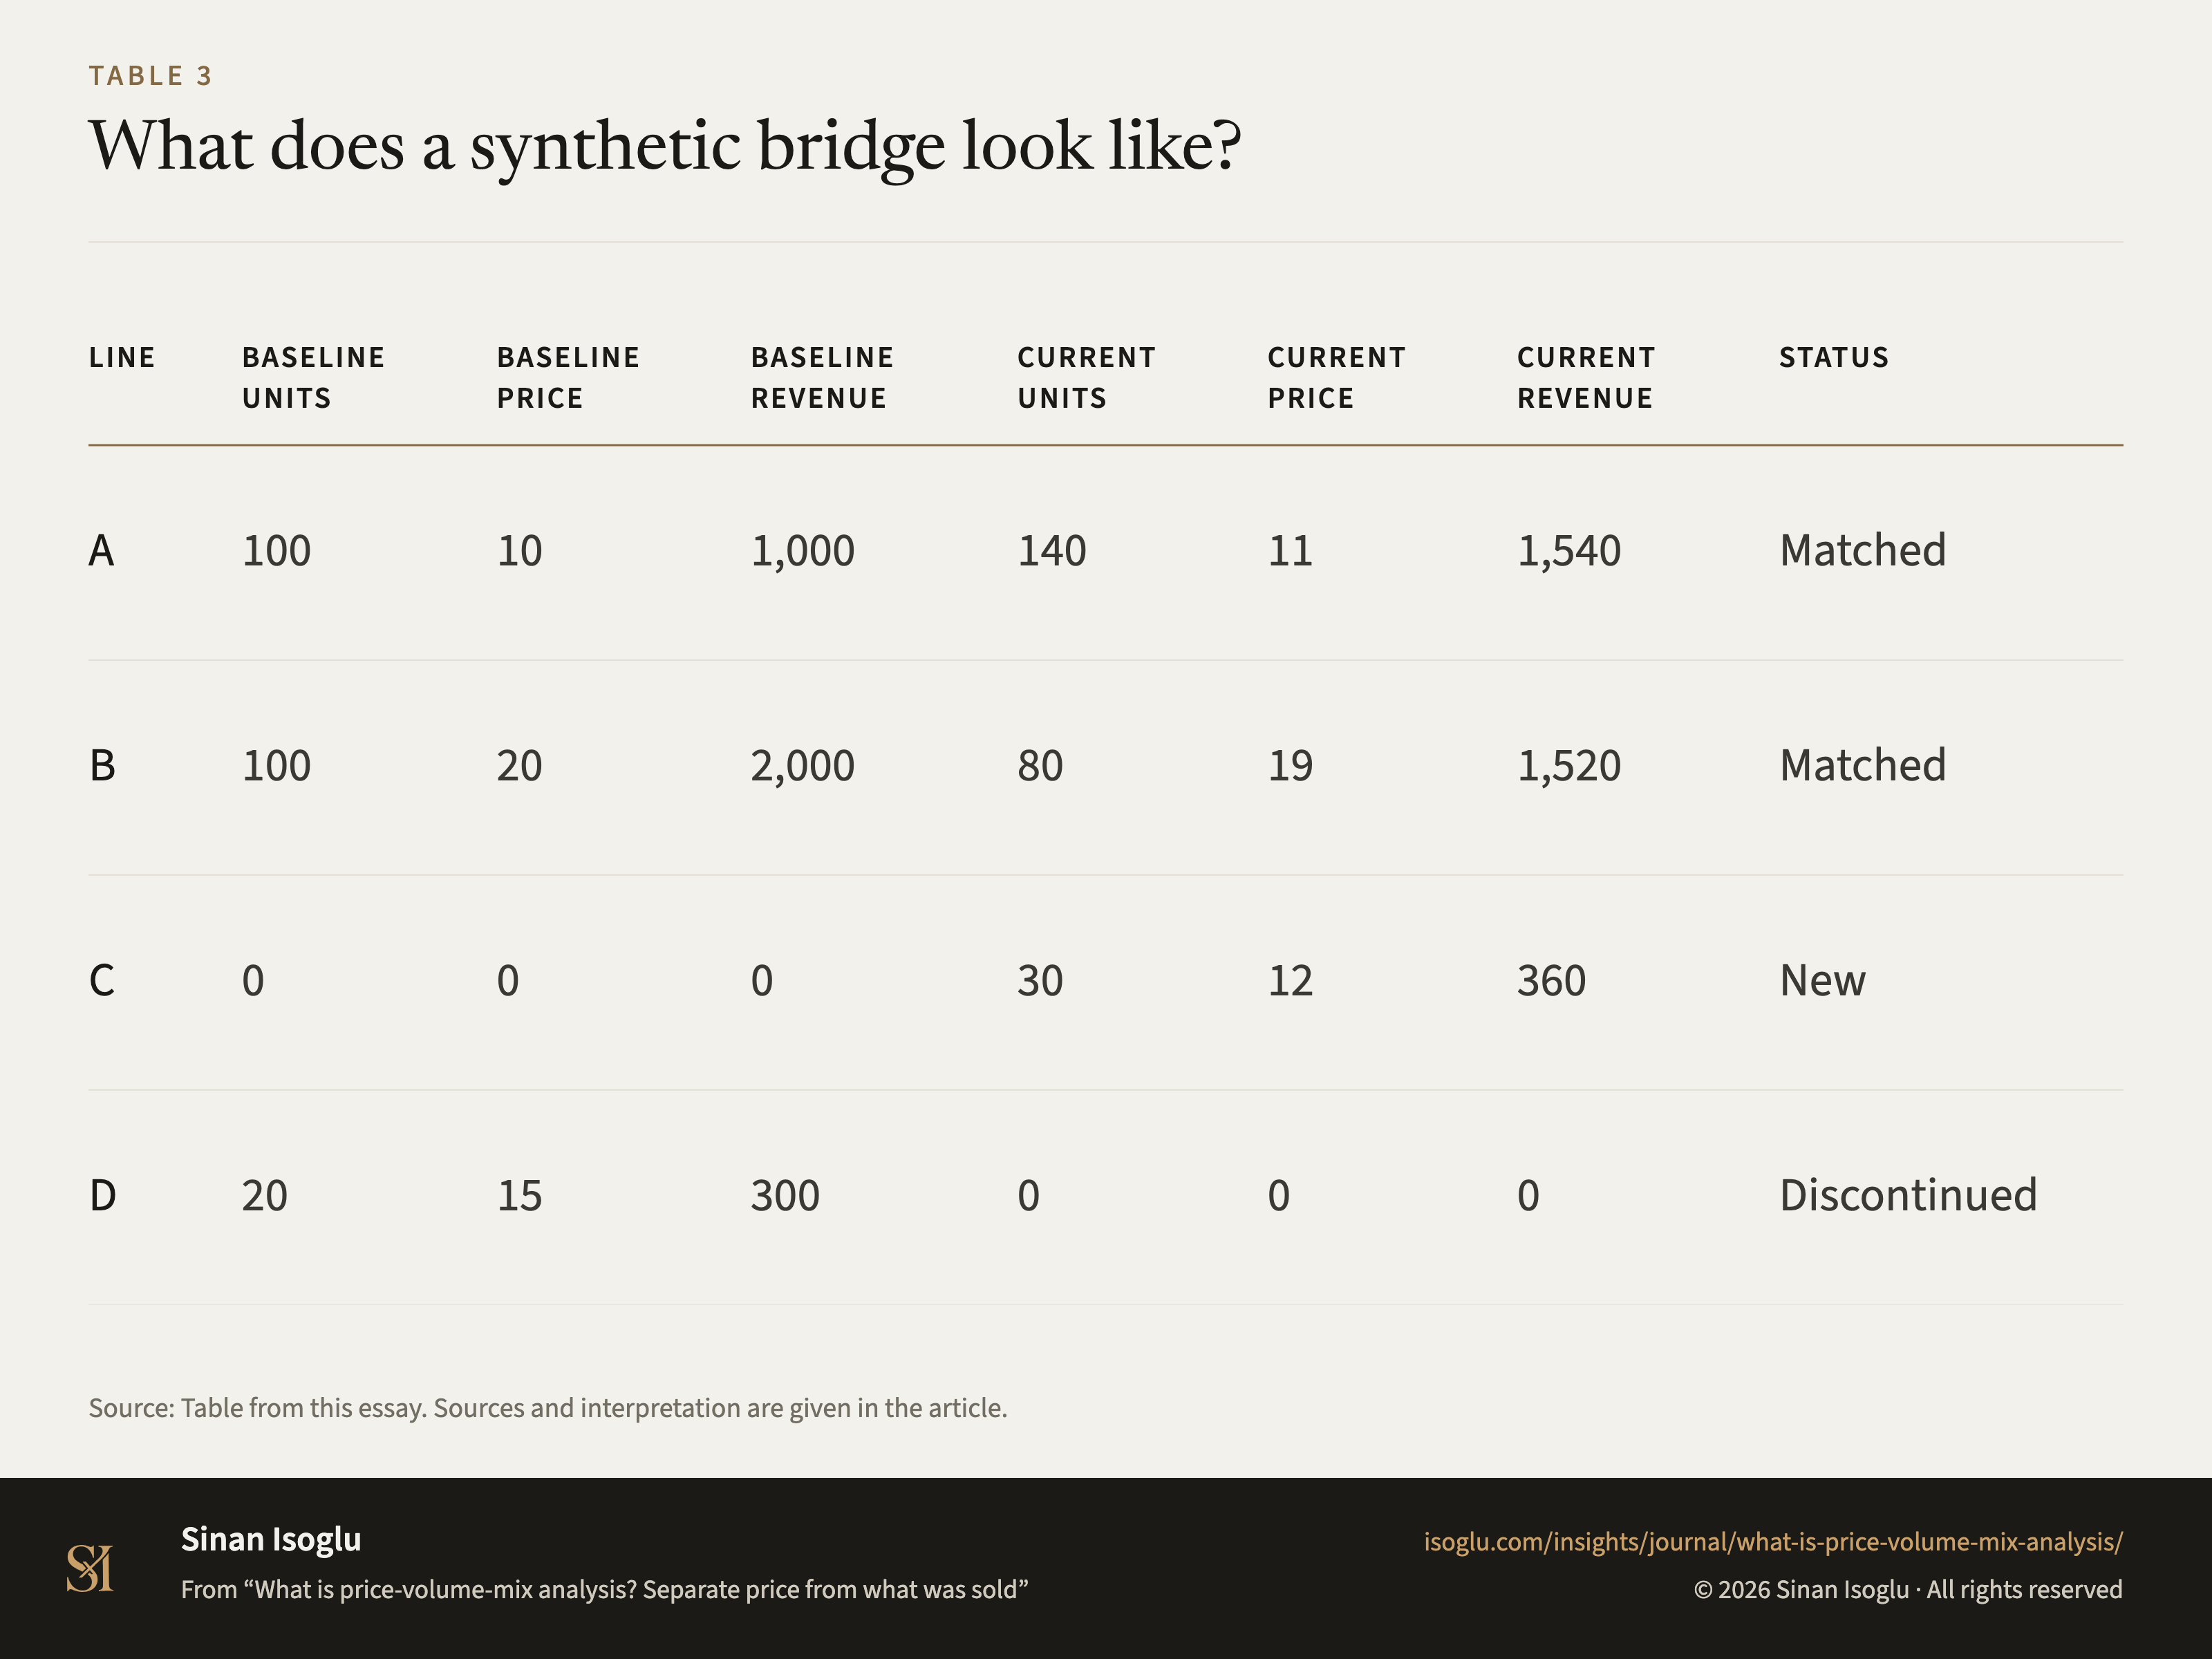
What does a synthetic bridge look like?
Table 3What does a synthetic bridge look like?
| Line | Baseline units | Baseline price | Baseline revenue | Current units | Current price | Current revenue | Status |
|---|---|---|---|---|---|---|---|
| A | 100 | 10 | 1,000 | 140 | 11 | 1,540 | Matched |
| B | 100 | 20 | 2,000 | 80 | 19 | 1,520 | Matched |
| C | 0 | 0 | 0 | 30 | 12 | 360 | New |
| D | 20 | 15 | 300 | 0 | 0 | 0 | Discontinued |
Swipe or scroll horizontally if the table is wider than your screen.
Source: Table from this essay. Sources and interpretation are given in the article.
From the essay
Pricing & revenue architecture
What is price-volume-mix analysis? Separate price from what was sold
Price-volume-mix analysis reconciles a period change into price, volume, mix, new, and discontinued lines before a team assigns an explanation.
Read the essayThis exhibit belongs to an essay: the numbers live here, the argument lives there.
Cite or embed
Related exhibits
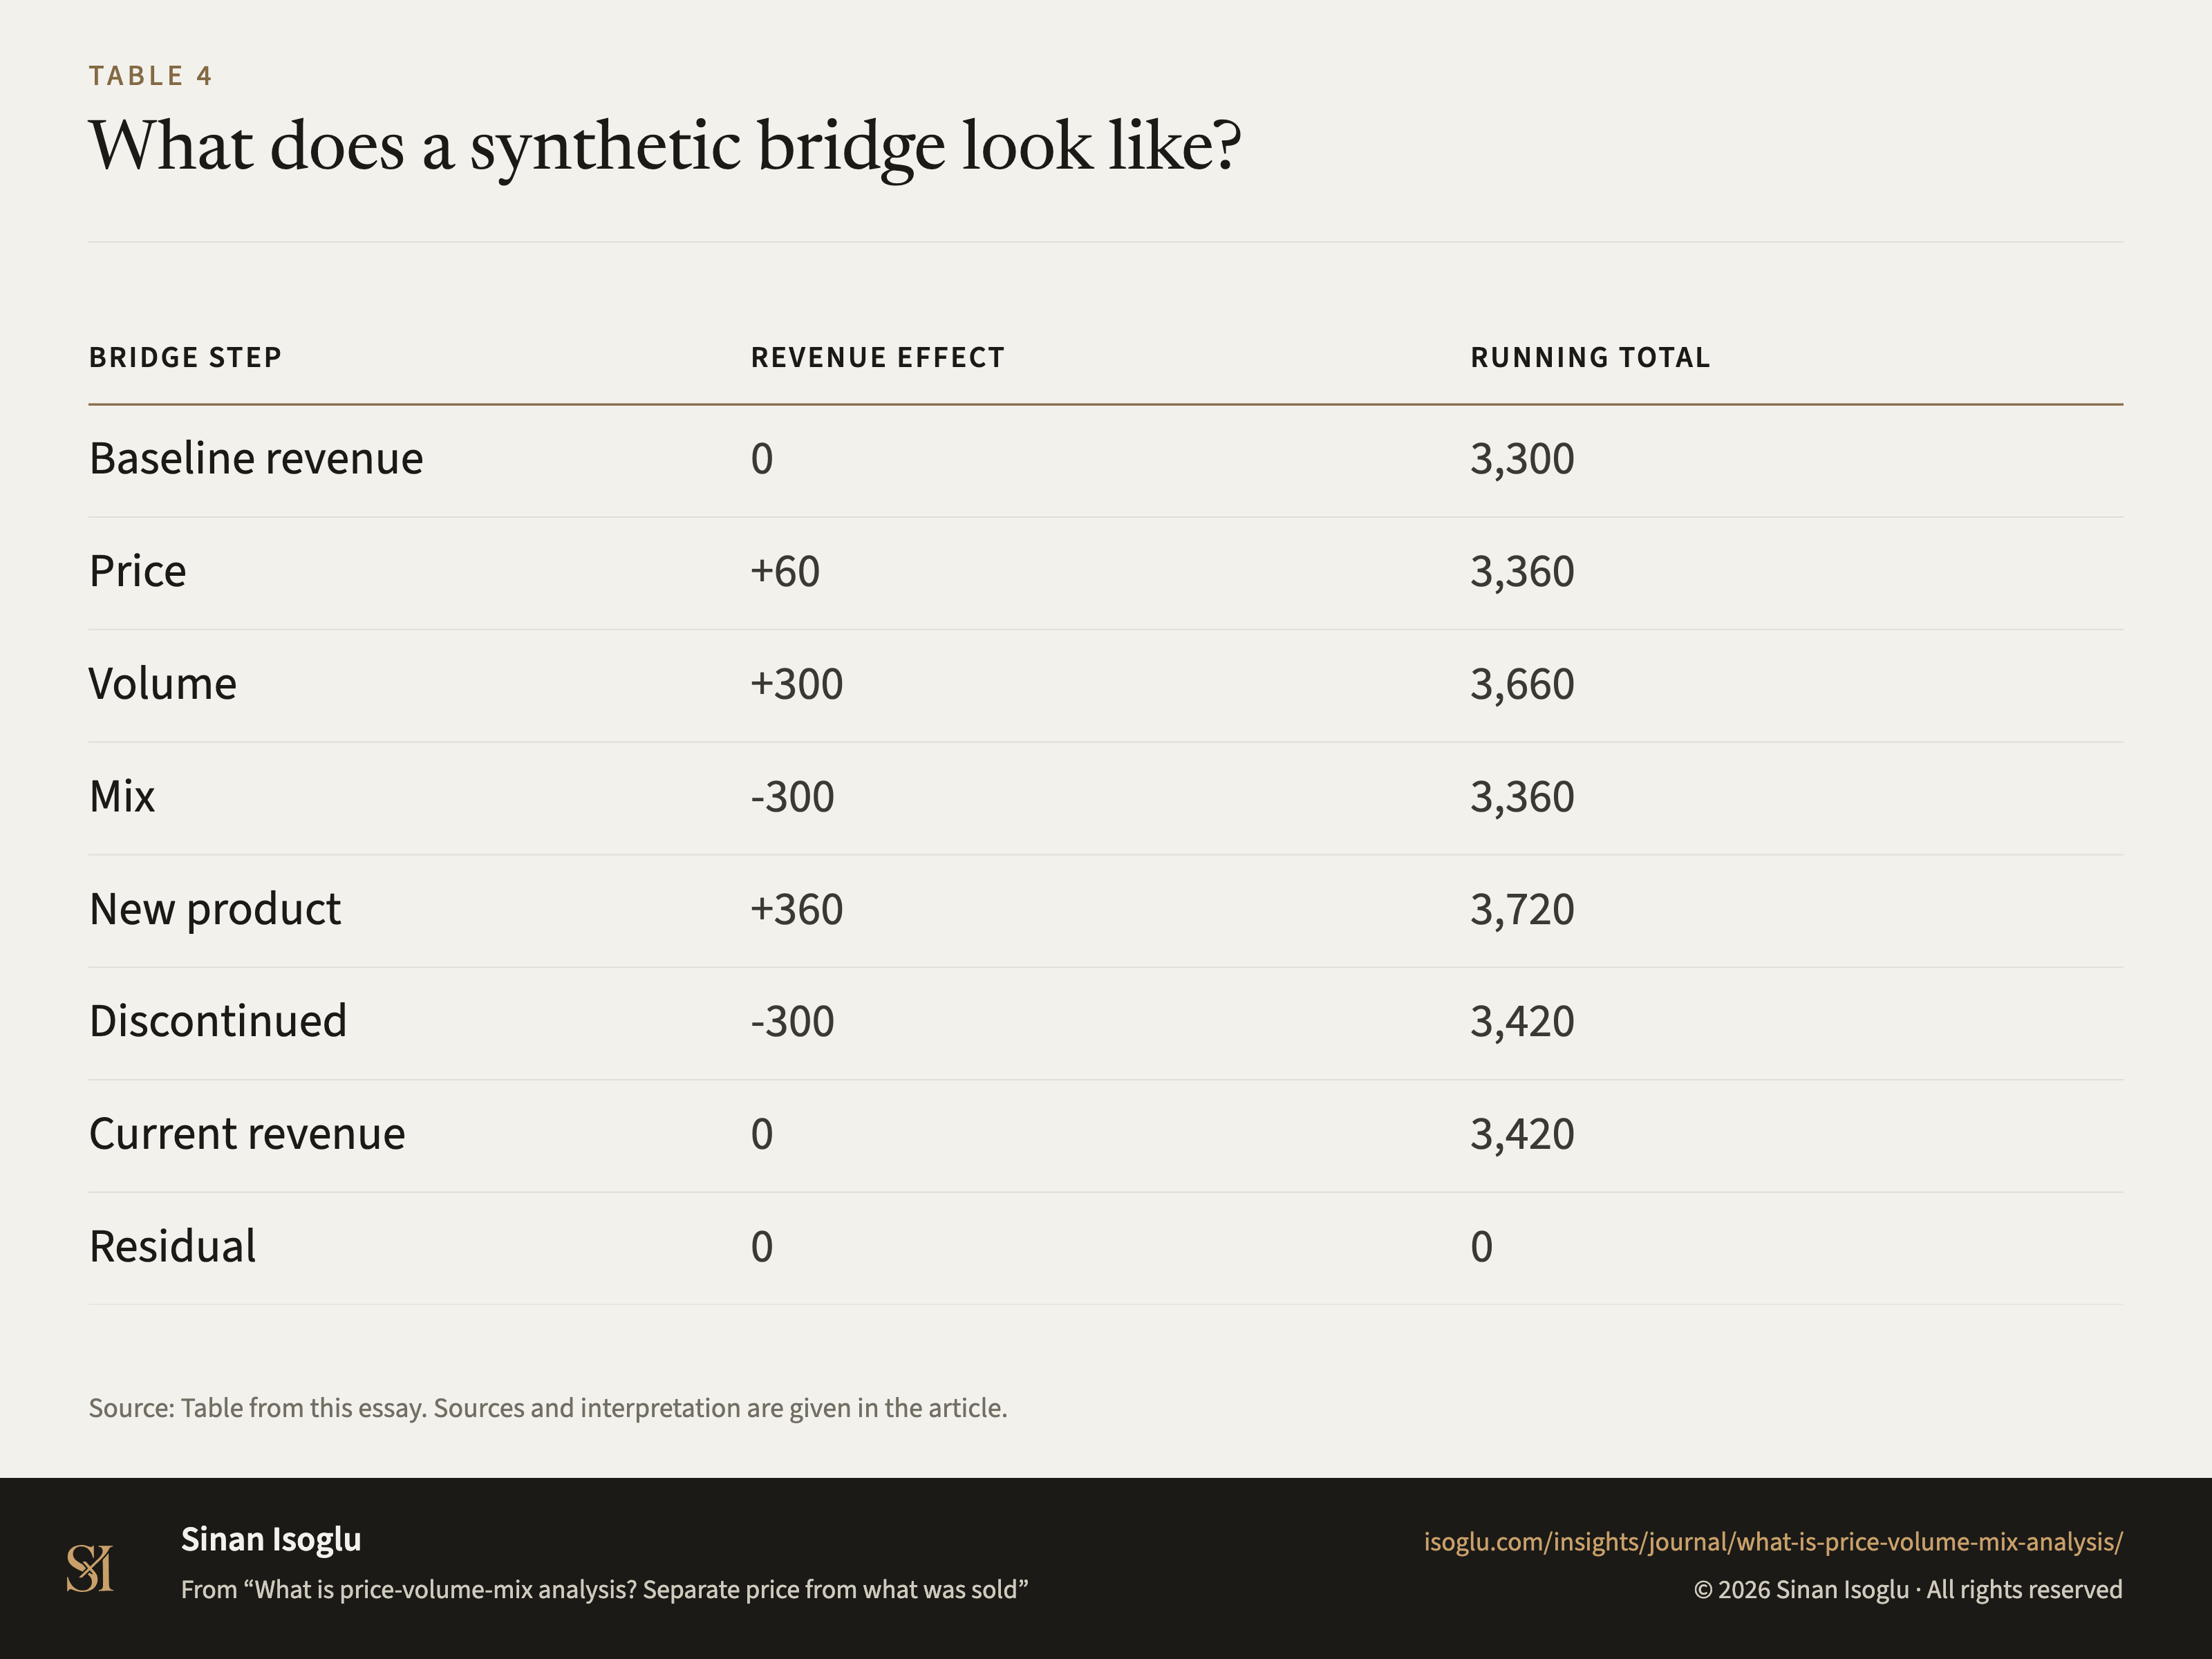
Table 4Table
What does a synthetic bridge look like?
What is price-volume-mix analysis? Separate price from what was sold
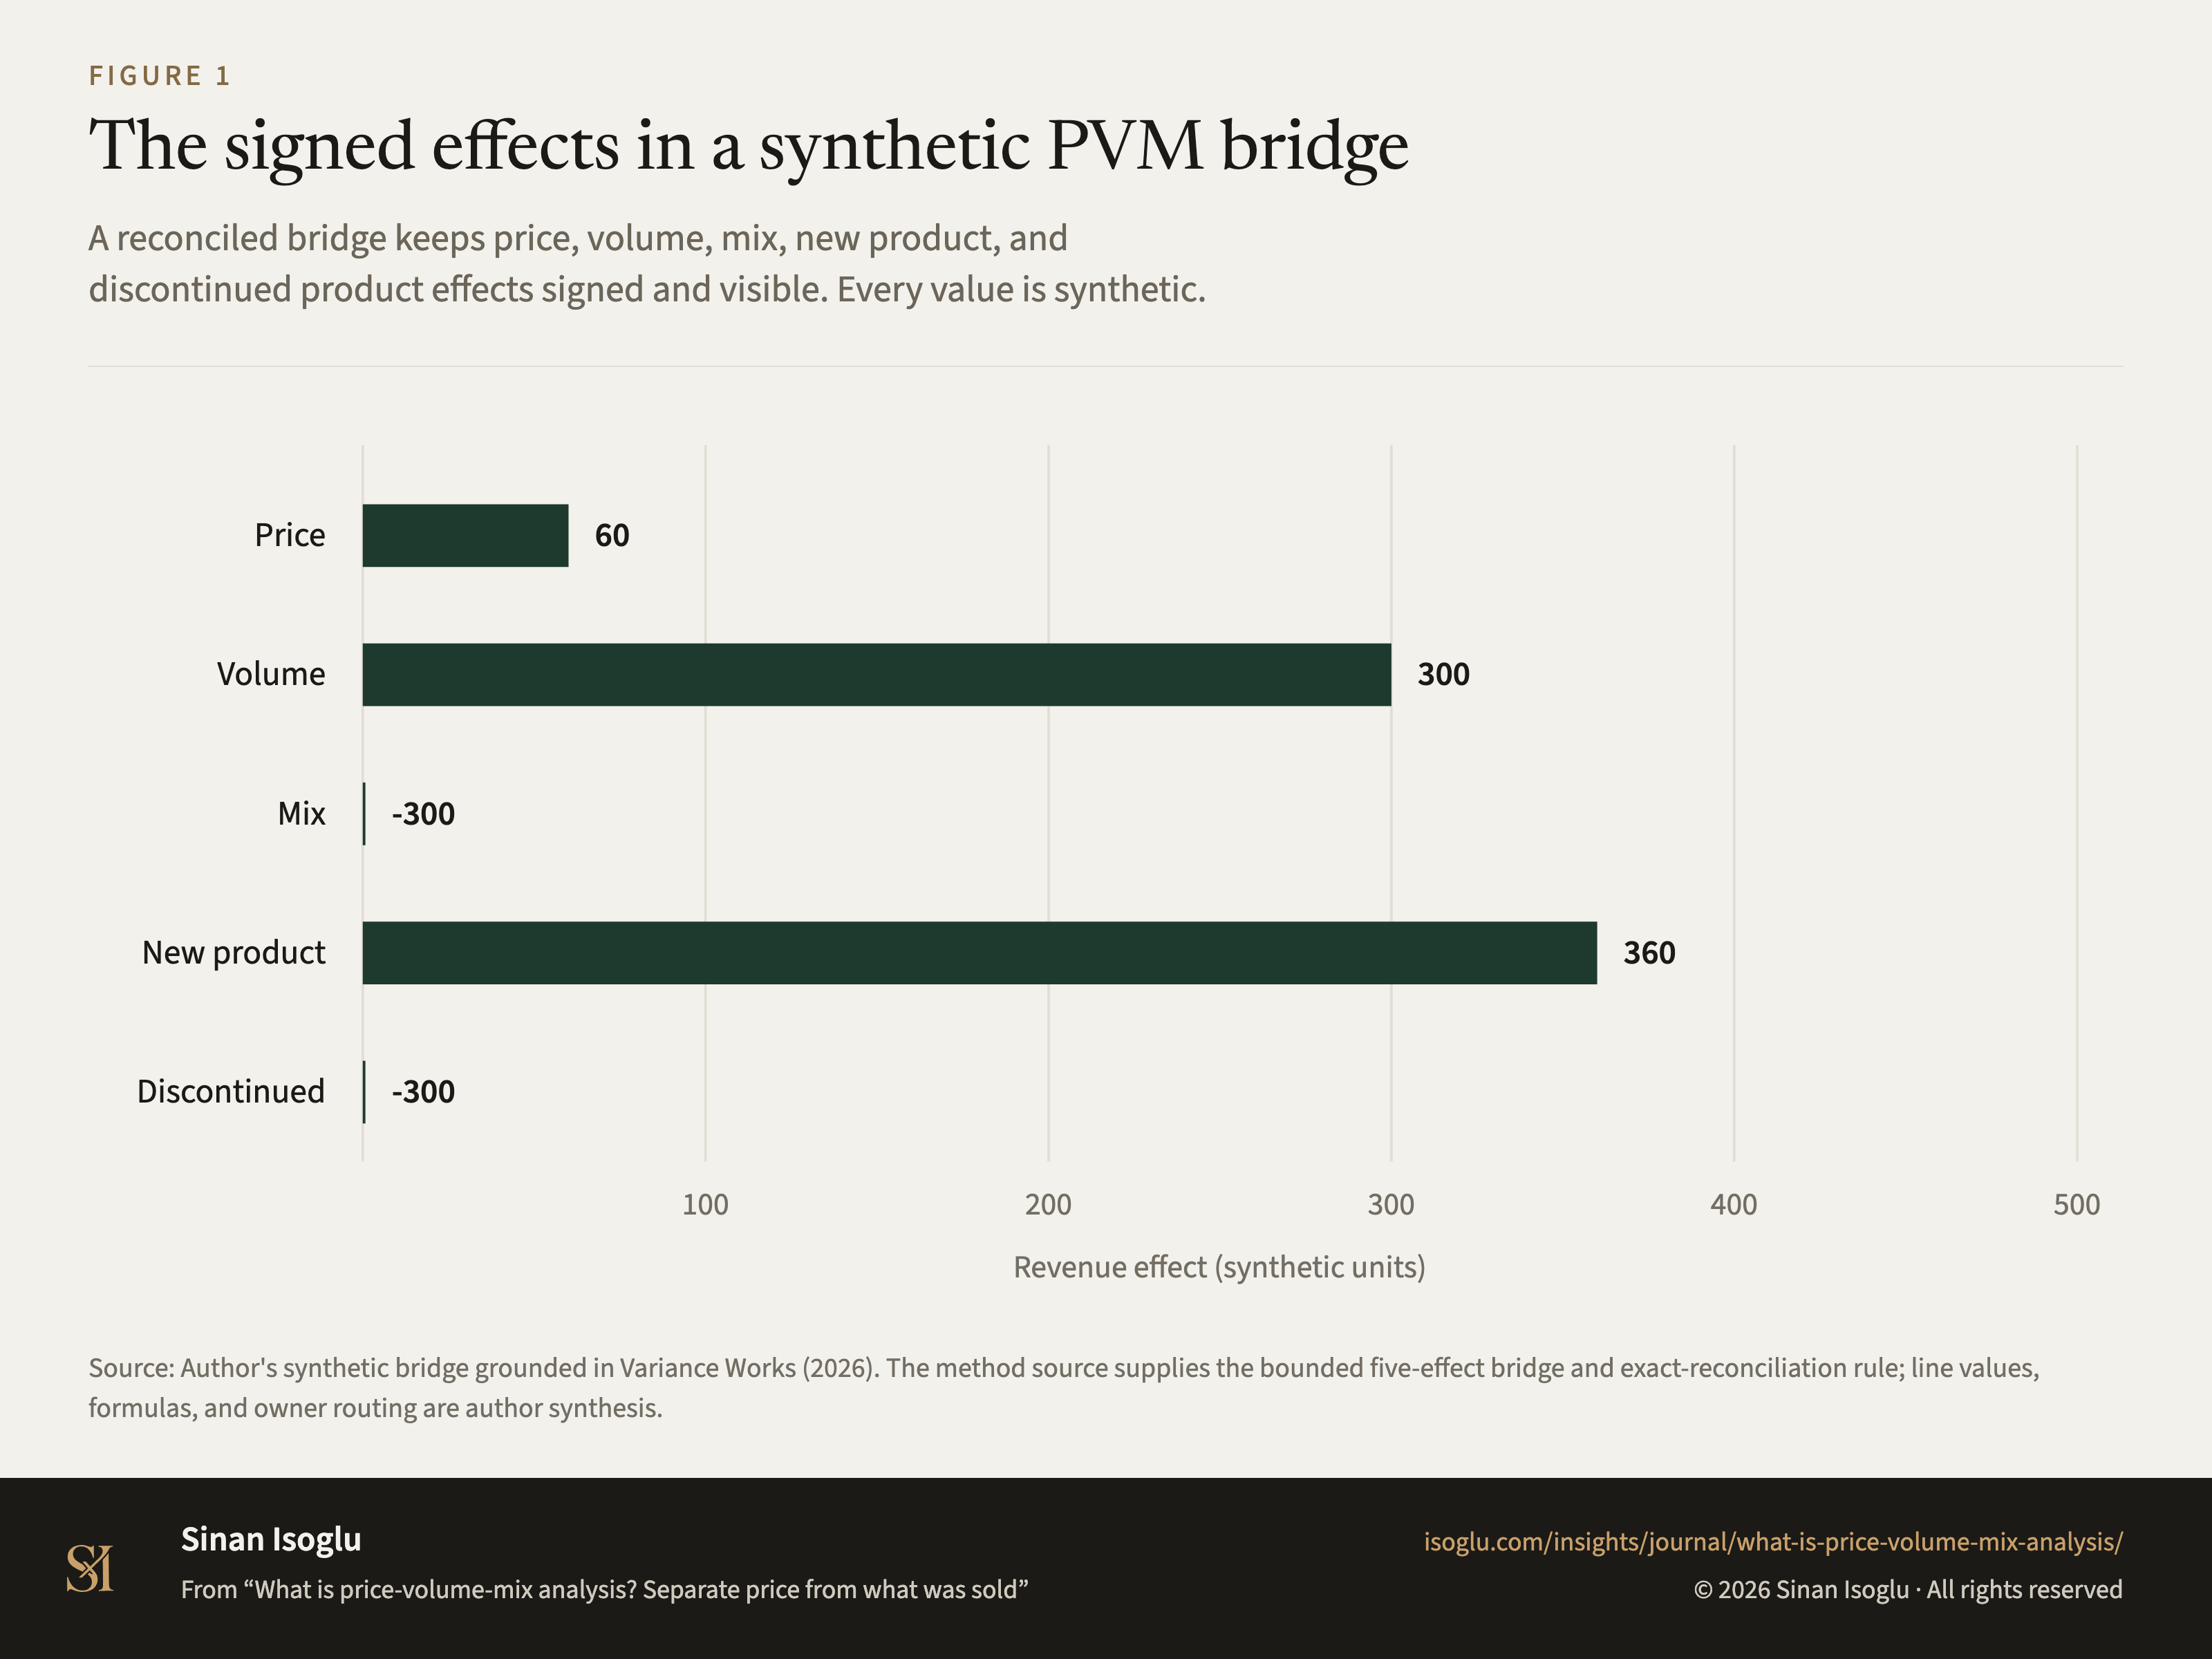
Figure 1Figure
The signed effects in a synthetic PVM bridge
What is price-volume-mix analysis? Separate price from what was sold
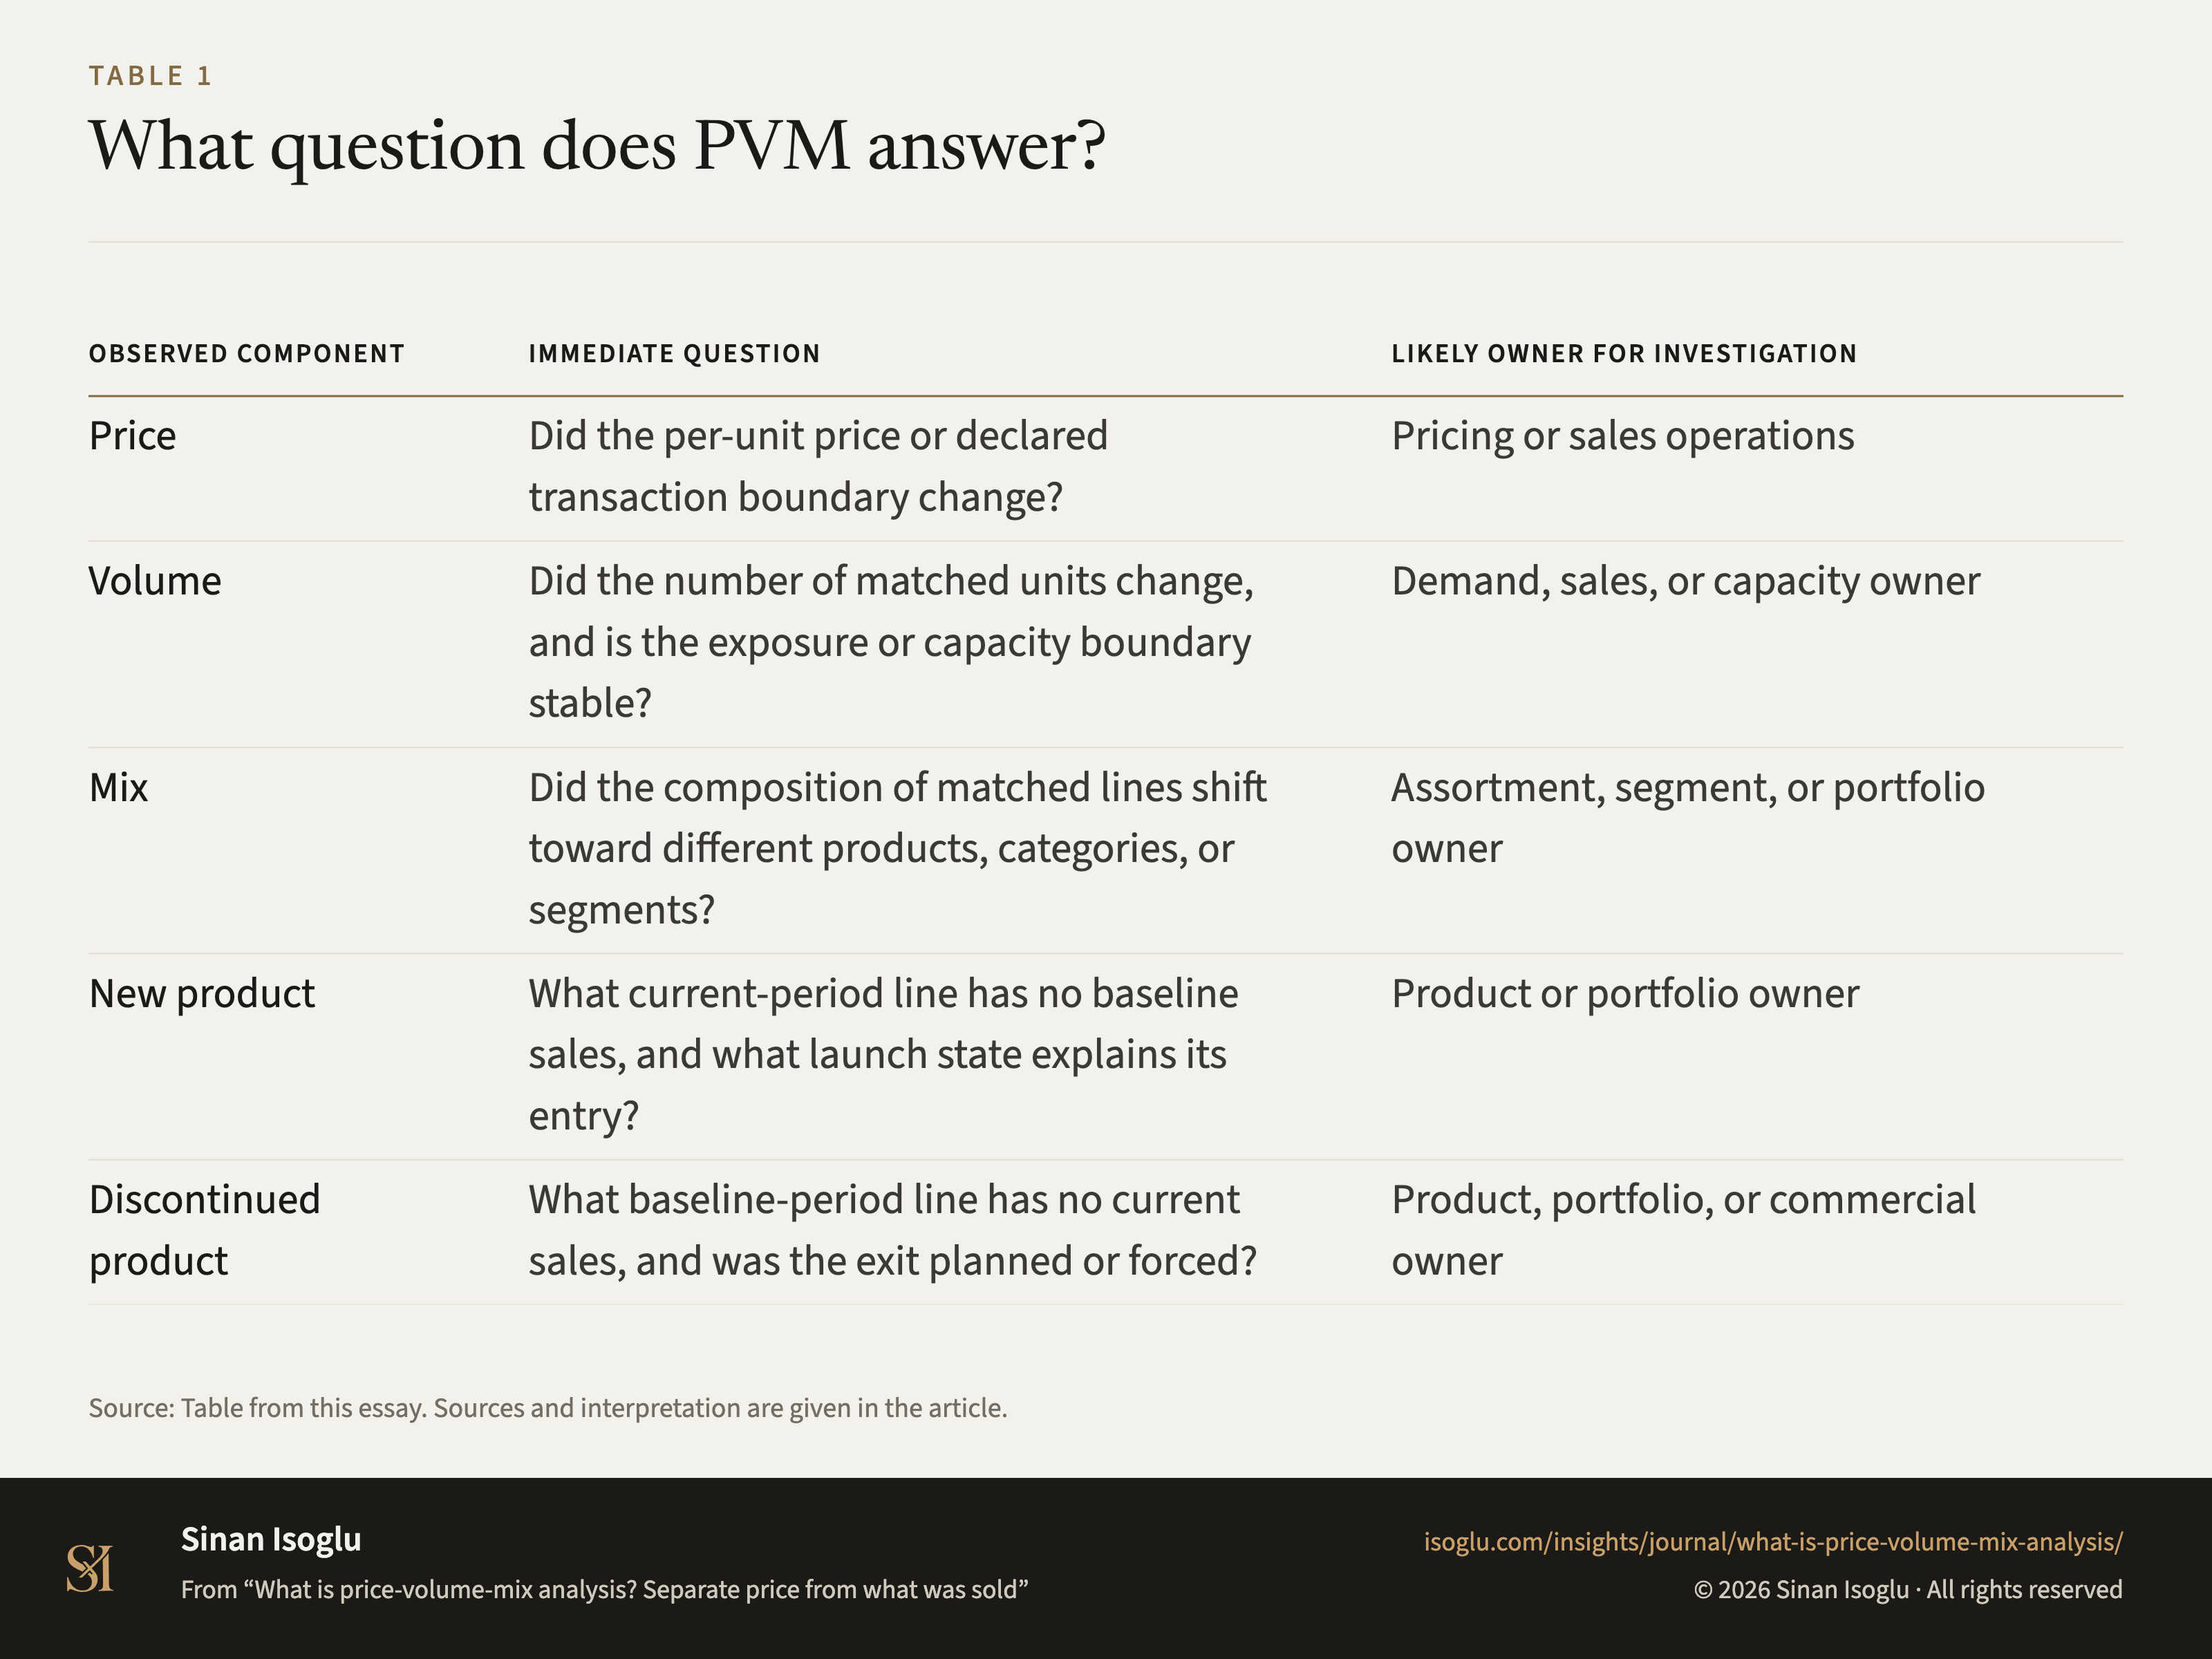
Table 1Table
What question does PVM answer?
What is price-volume-mix analysis? Separate price from what was sold
Contact
Bring the question you're working on.
Research, a guest lecture, or a commercial question.