Figure 1From “What is lead scoring?”
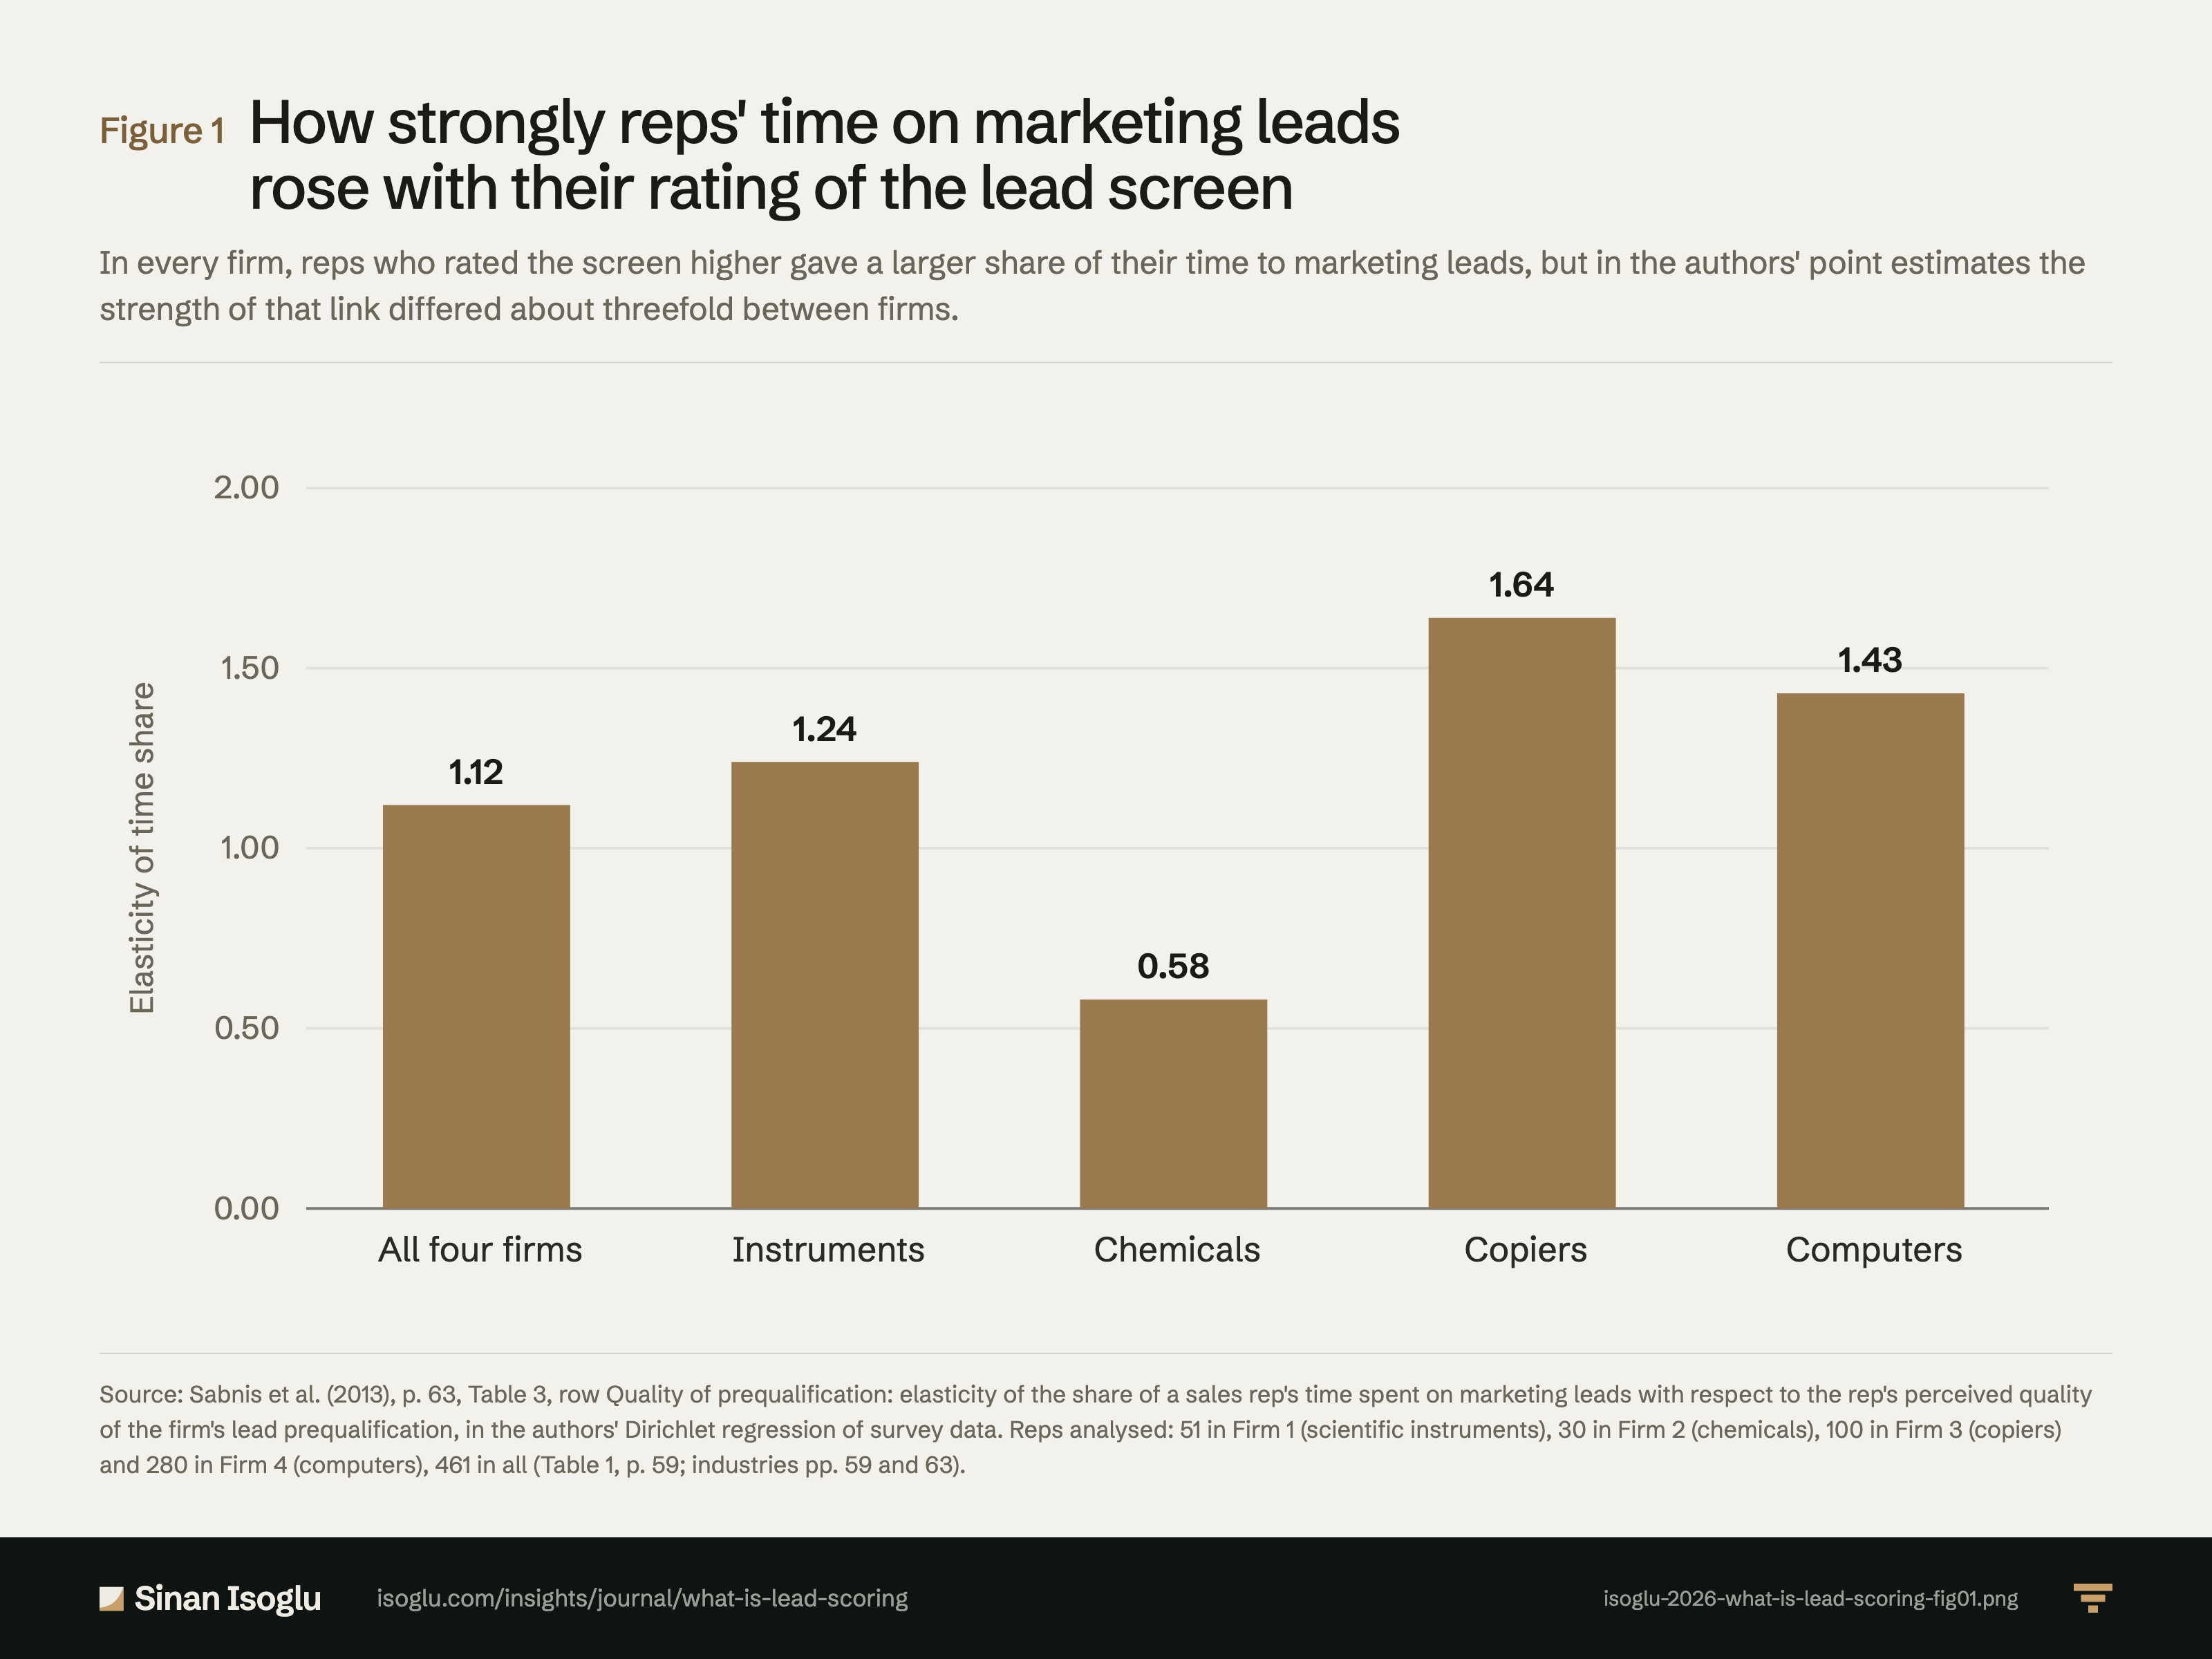
How strongly reps' time on marketing leads rose with their rating of the lead screen
In every firm, reps who rated the screen higher gave a larger share of their time to marketing leads, but in the authors' point estimates the strength of that link differed about threefold between firms.
Figure 1How strongly reps' time on marketing leads rose with their rating of the lead screen
Source: Sabnis et al. (2013), p. 63, Table 3, row Quality of prequalification: elasticity of the share of a sales rep's time spent on marketing leads with respect to the rep's perceived quality of the firm's lead prequalification, in the authors' Dirichlet regression of survey data. Reps analysed: 51 in Firm 1 (scientific instruments), 30 in Firm 2 (chemicals), 100 in Firm 3 (copiers) and 280 in Firm 4 (computers), 461 in all (Table 1, p. 59; industries pp. 59 and 63).
Source and evidence
Each line names a claim related to this exhibit, its source, and how it was checked.
- A LSC-SAB-C3 Results: H1a supported (b = .64, p < .05); elasticity of the marketing-lead time share to perceived prequalification quality 1.12 for the sample, positive in all four firms, .58 to 1.64, which the authors call a 3:1 ratio; Table 3, row Quality of prequalification (p. 63, page image): aggregate 1.12, Firm 1 1.24, Firm 2 .58, Firm 3 1.64, Firm 4 1.43; the same table gives managerial tracking −.14 and marketing lead volume −.07 for the aggregate; Firms 1 to 4 are scientific instruments, chemicals, copiers and computers (pp. 59 and 63), with 51, 30, 100 and 280 reps (Table 1, p. 59); H4a supported (b = .71): the prequalification effect is stronger with more experience. The authors write produces; the data are one cross-sectional survey, so the page reads an association. Table 3 prints point estimates only, with no interval or test, and in the hierarchical specification the firm-level effects shrink toward the aggregate (p. 62); the aggregate value is the model's own estimate, not an average of the firm values, and Firm 2 rests on 30 reps; the page says so in the Figure 1 caption and calls the elasticity a slope, not a closeness of fit (G5 F6). The instrument prints the scale as 1 = agree and 7 = disagree (p. 58) while the text reads higher scores as higher perceived quality (pp. 59, 63), so the page gives direction as the authors state it and uses no scale means (pp. 59, 61 to 63): "which suggests that as the perceived quality of prequalification increases, the proportion of time spent on marketing leads increases"; "a 1% increase in perceived prequalification quality produces a 1.12% increase in marketing lead follow-up time allocation"; "The elasticity is positive across all four firms but varies considerably (from .58 to 1.64)."; "we find a 3:1 ratio for the elasticity of the perceived prequalification quality for the least and most responsive firms"; "Elasticity of Marketing Lead Time Proportion"; "It is negative for Firms 1 (scientific instruments) and 2 (chemicals) but positive for Firms 3 (copiers"; "in which we argued that experience enhances the positive effect of the perceived quality of prequalification on the proportion of time spent following up marketing leads"; "In the model specification, the firm-level effects shrink to the aggregate effects."; "from 55 (Firm 2, chemicals) to 2500 (Firm 4, computers)"Sabnis et al. (2013) · Sabnis et al. (2013)
Grades: A, verified against the printed page of the primary source · B, primary source, text layer only · C, authoritative secondary · D, reported.
From the essay
Revenue operations & AI
What is lead scoring?
Lead scoring ranks leads by how likely they are to reach a named outcome. Without that outcome, a time window and a population, a score says little.
Read the essayThis exhibit belongs to an essay: the numbers live here, the argument lives there.
Cite or embed
Related exhibits
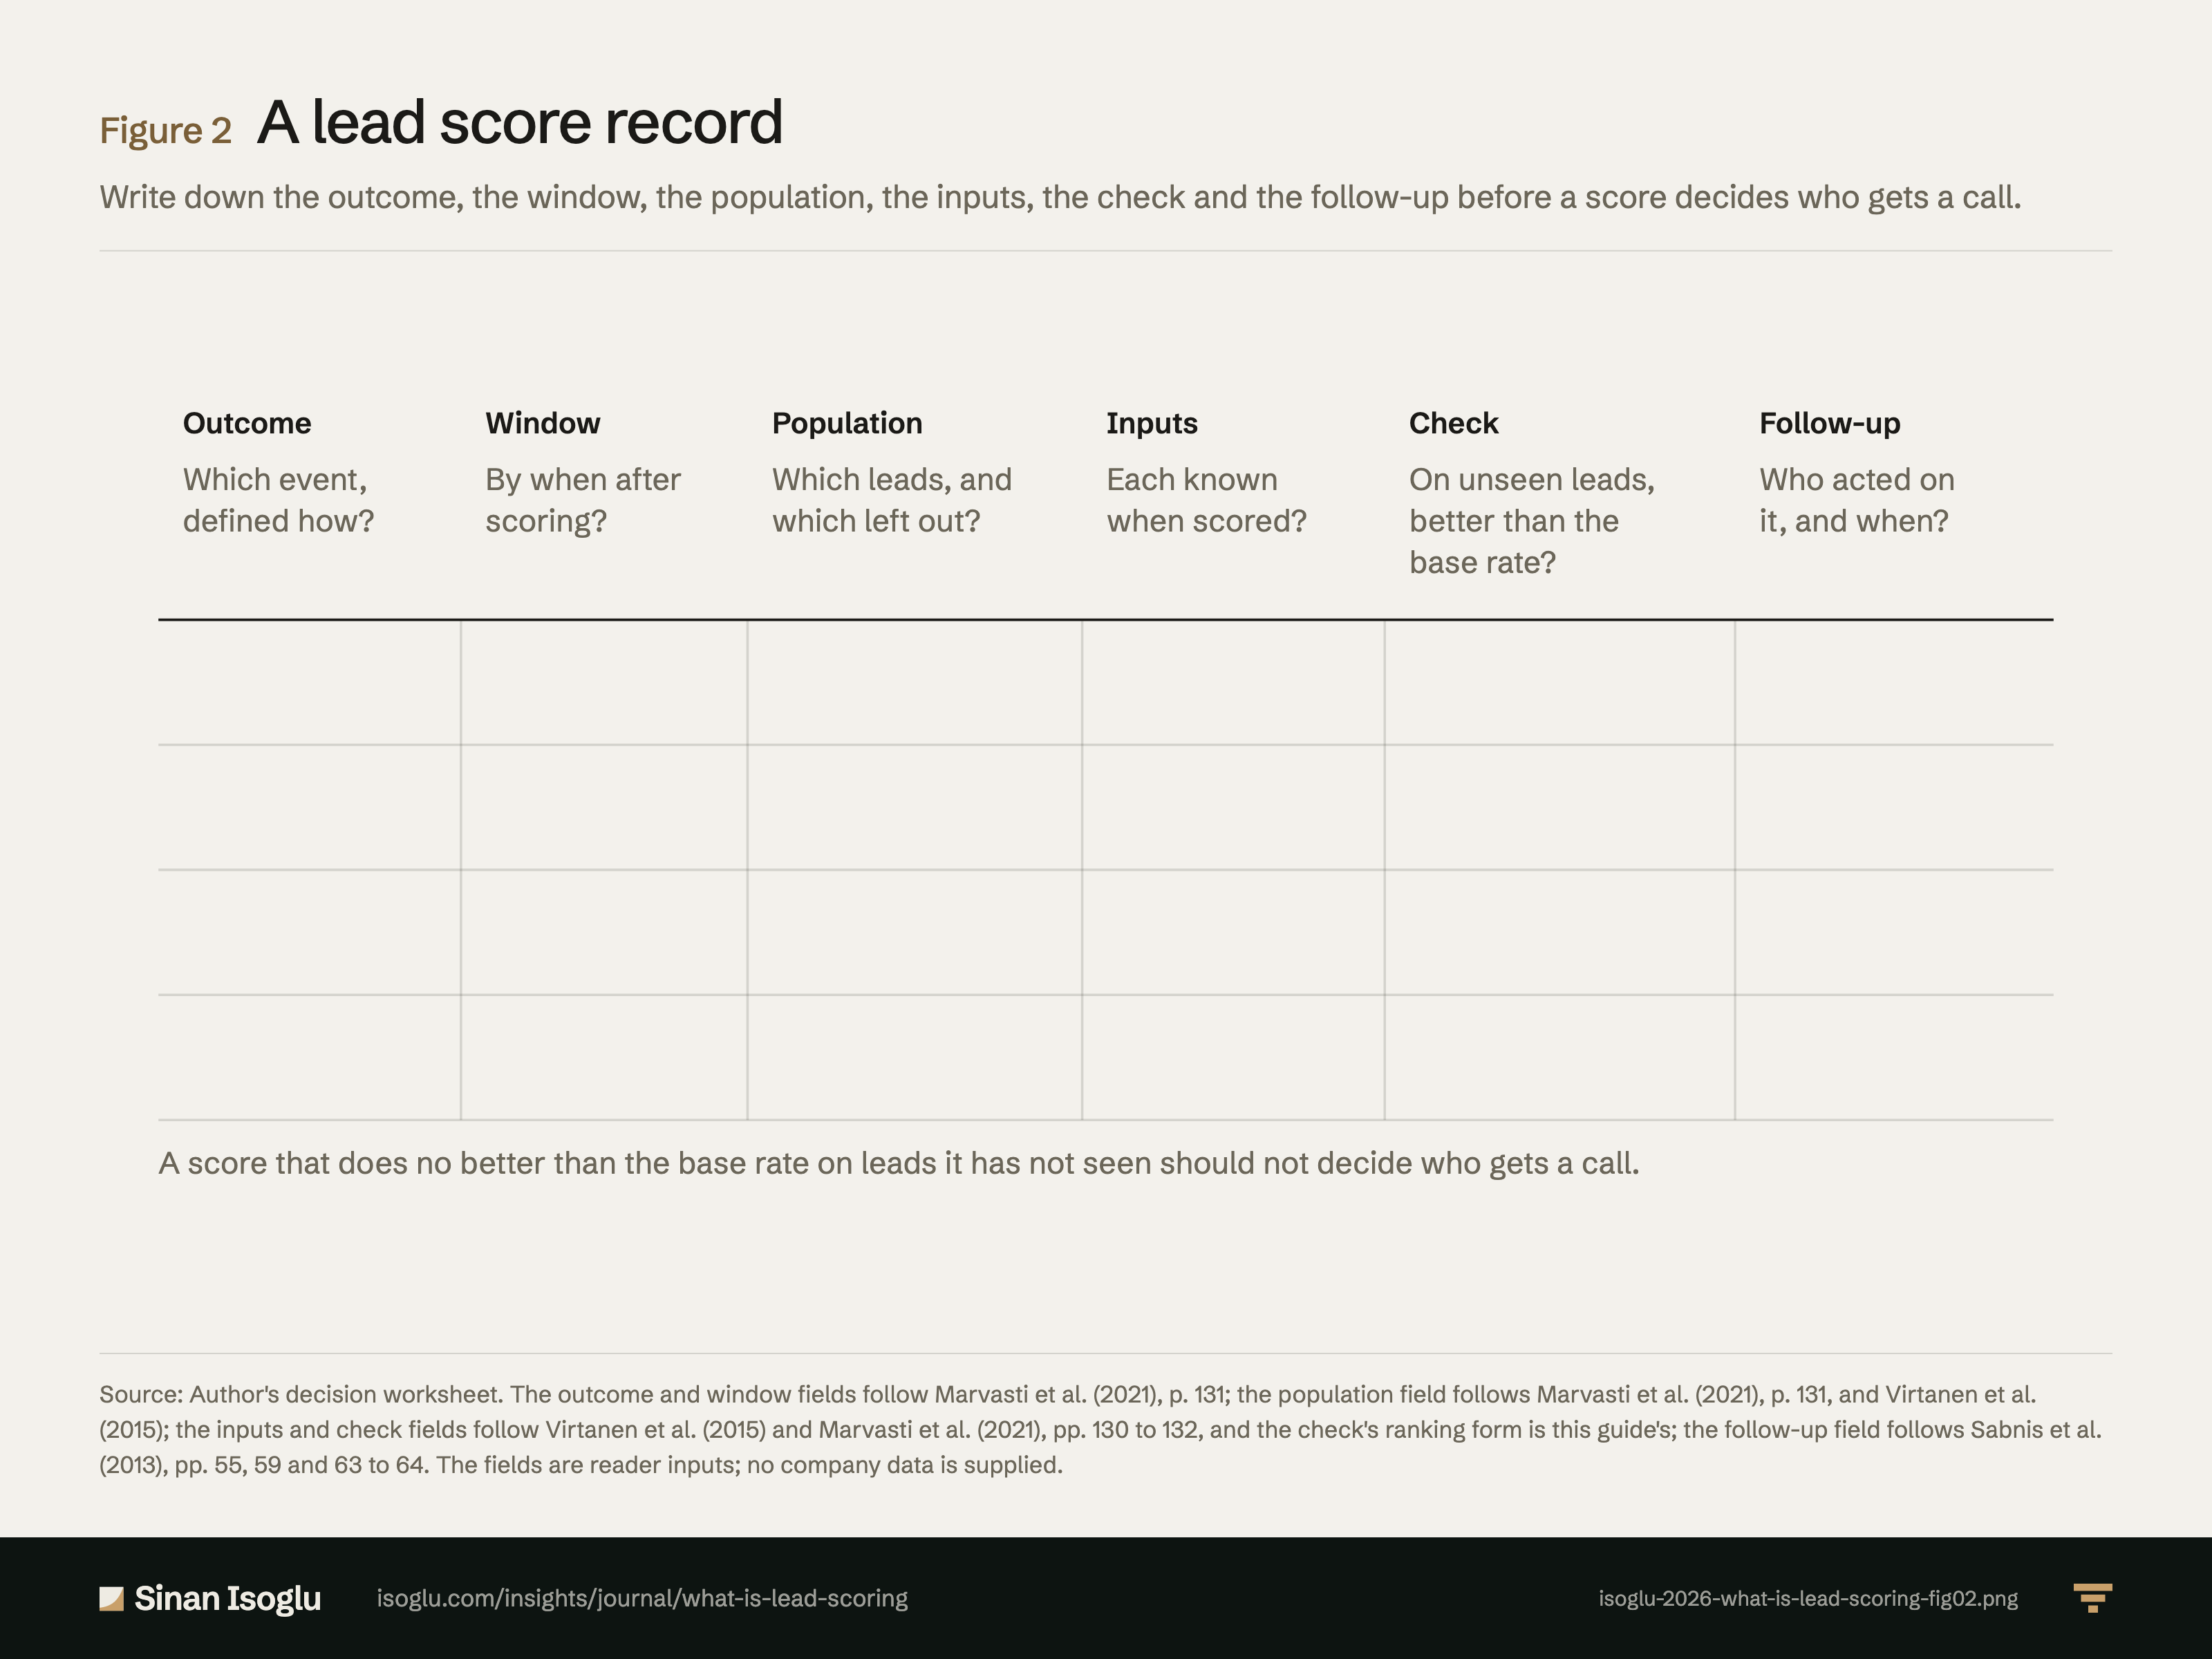
Figure 2Figure
A lead score record
What is lead scoring?
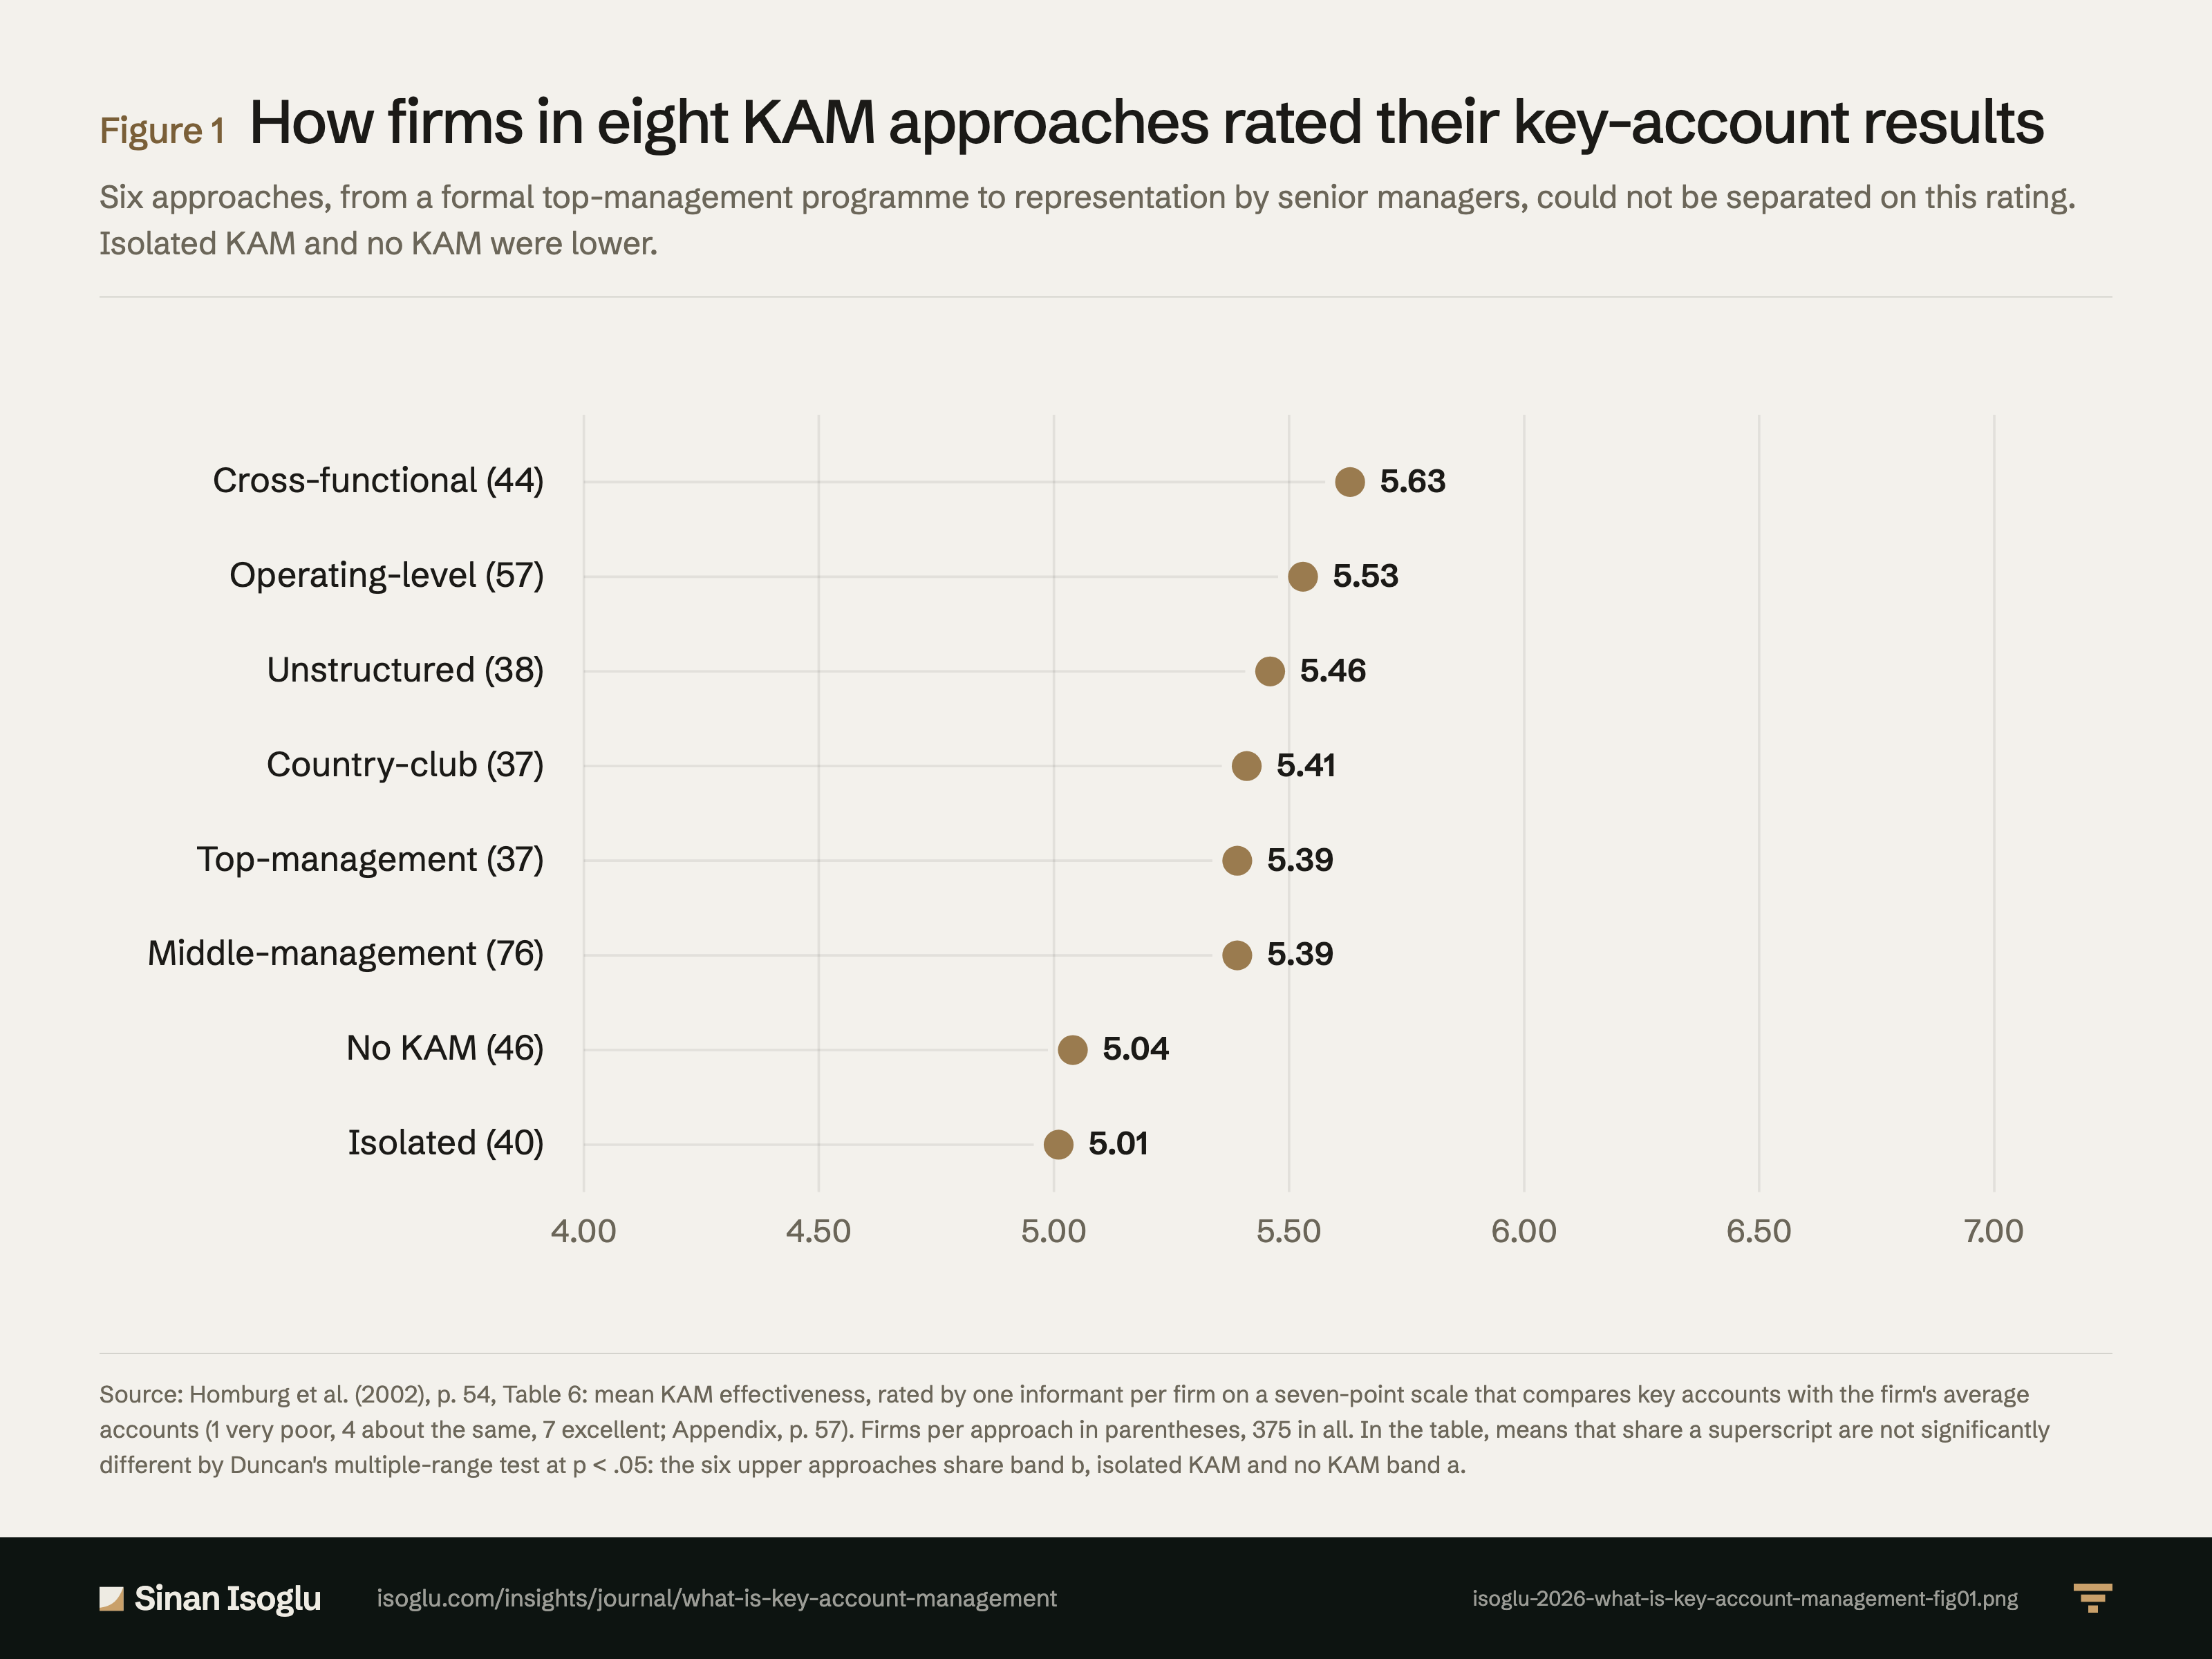
Figure 1Figure
How firms in eight KAM approaches rated their key-account results
What is key account management?
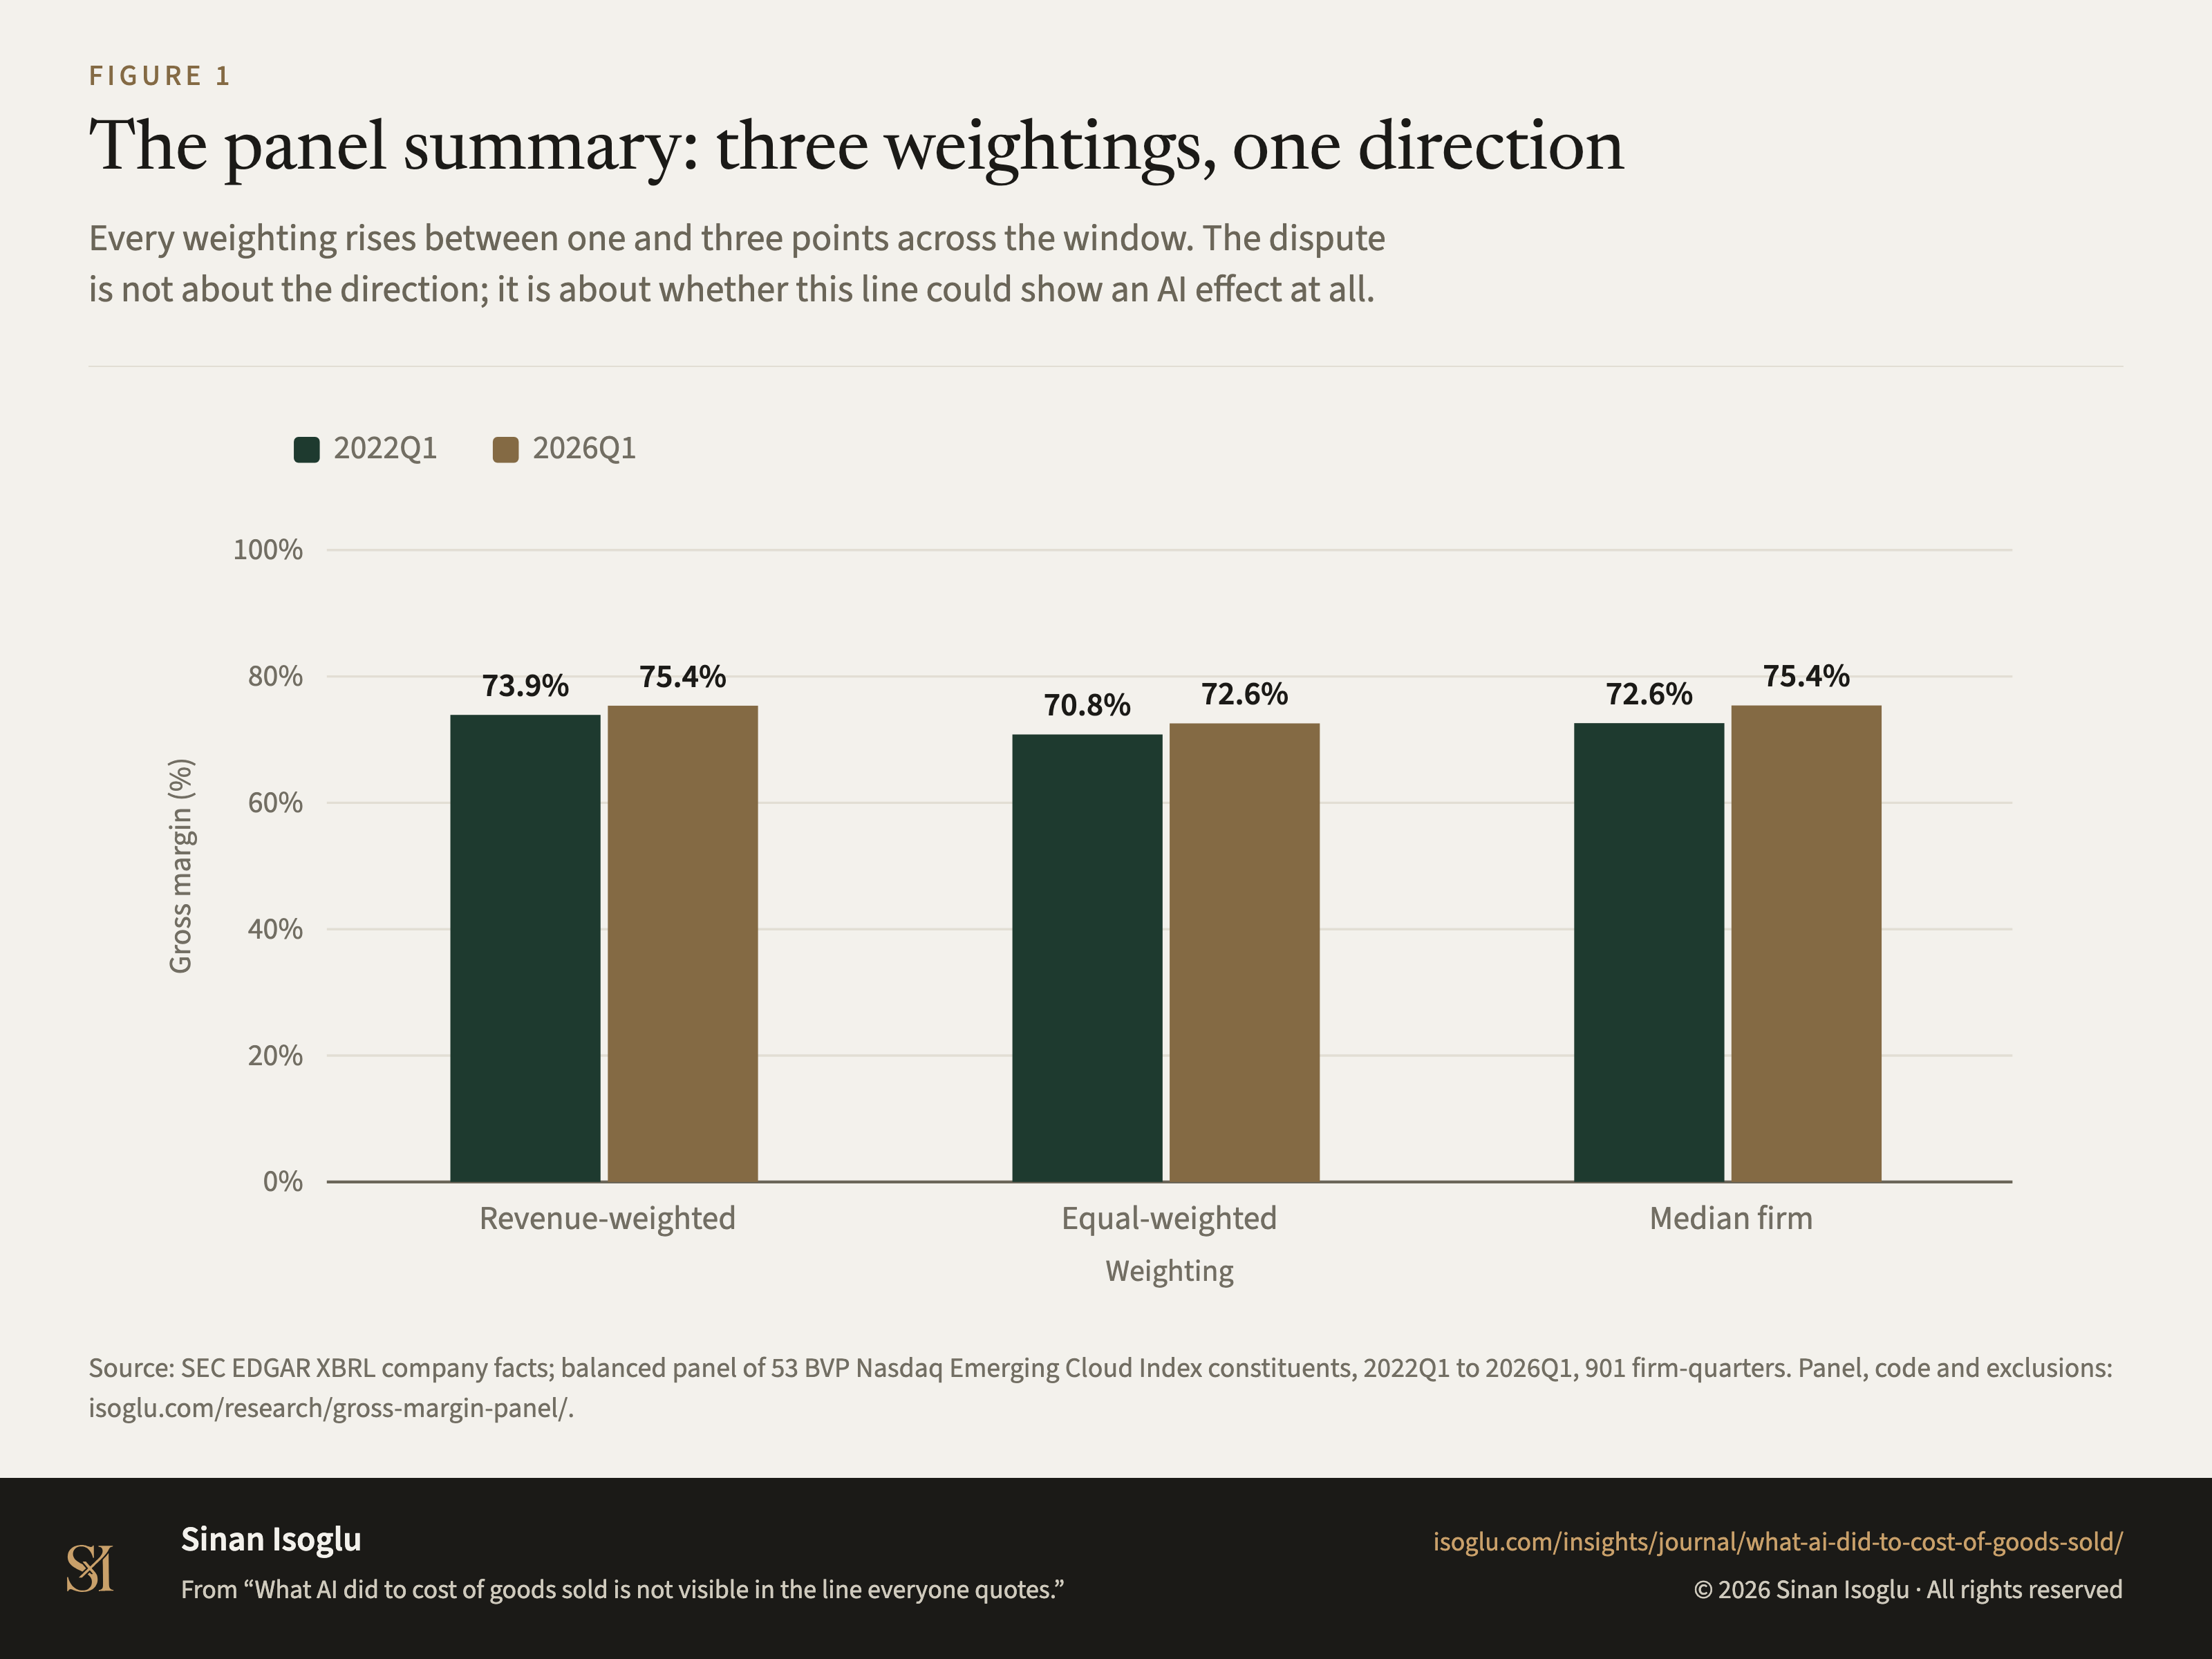
Figure 1Figure
The panel summary: three weightings, one direction
What AI did to cost of goods sold is not visible in the line everyone quotes.
Contact
Bring the question you're working on.
Research, a guest lecture, or a commercial question.