Abbildung 1Aus „Was ist Lead-Scoring?“
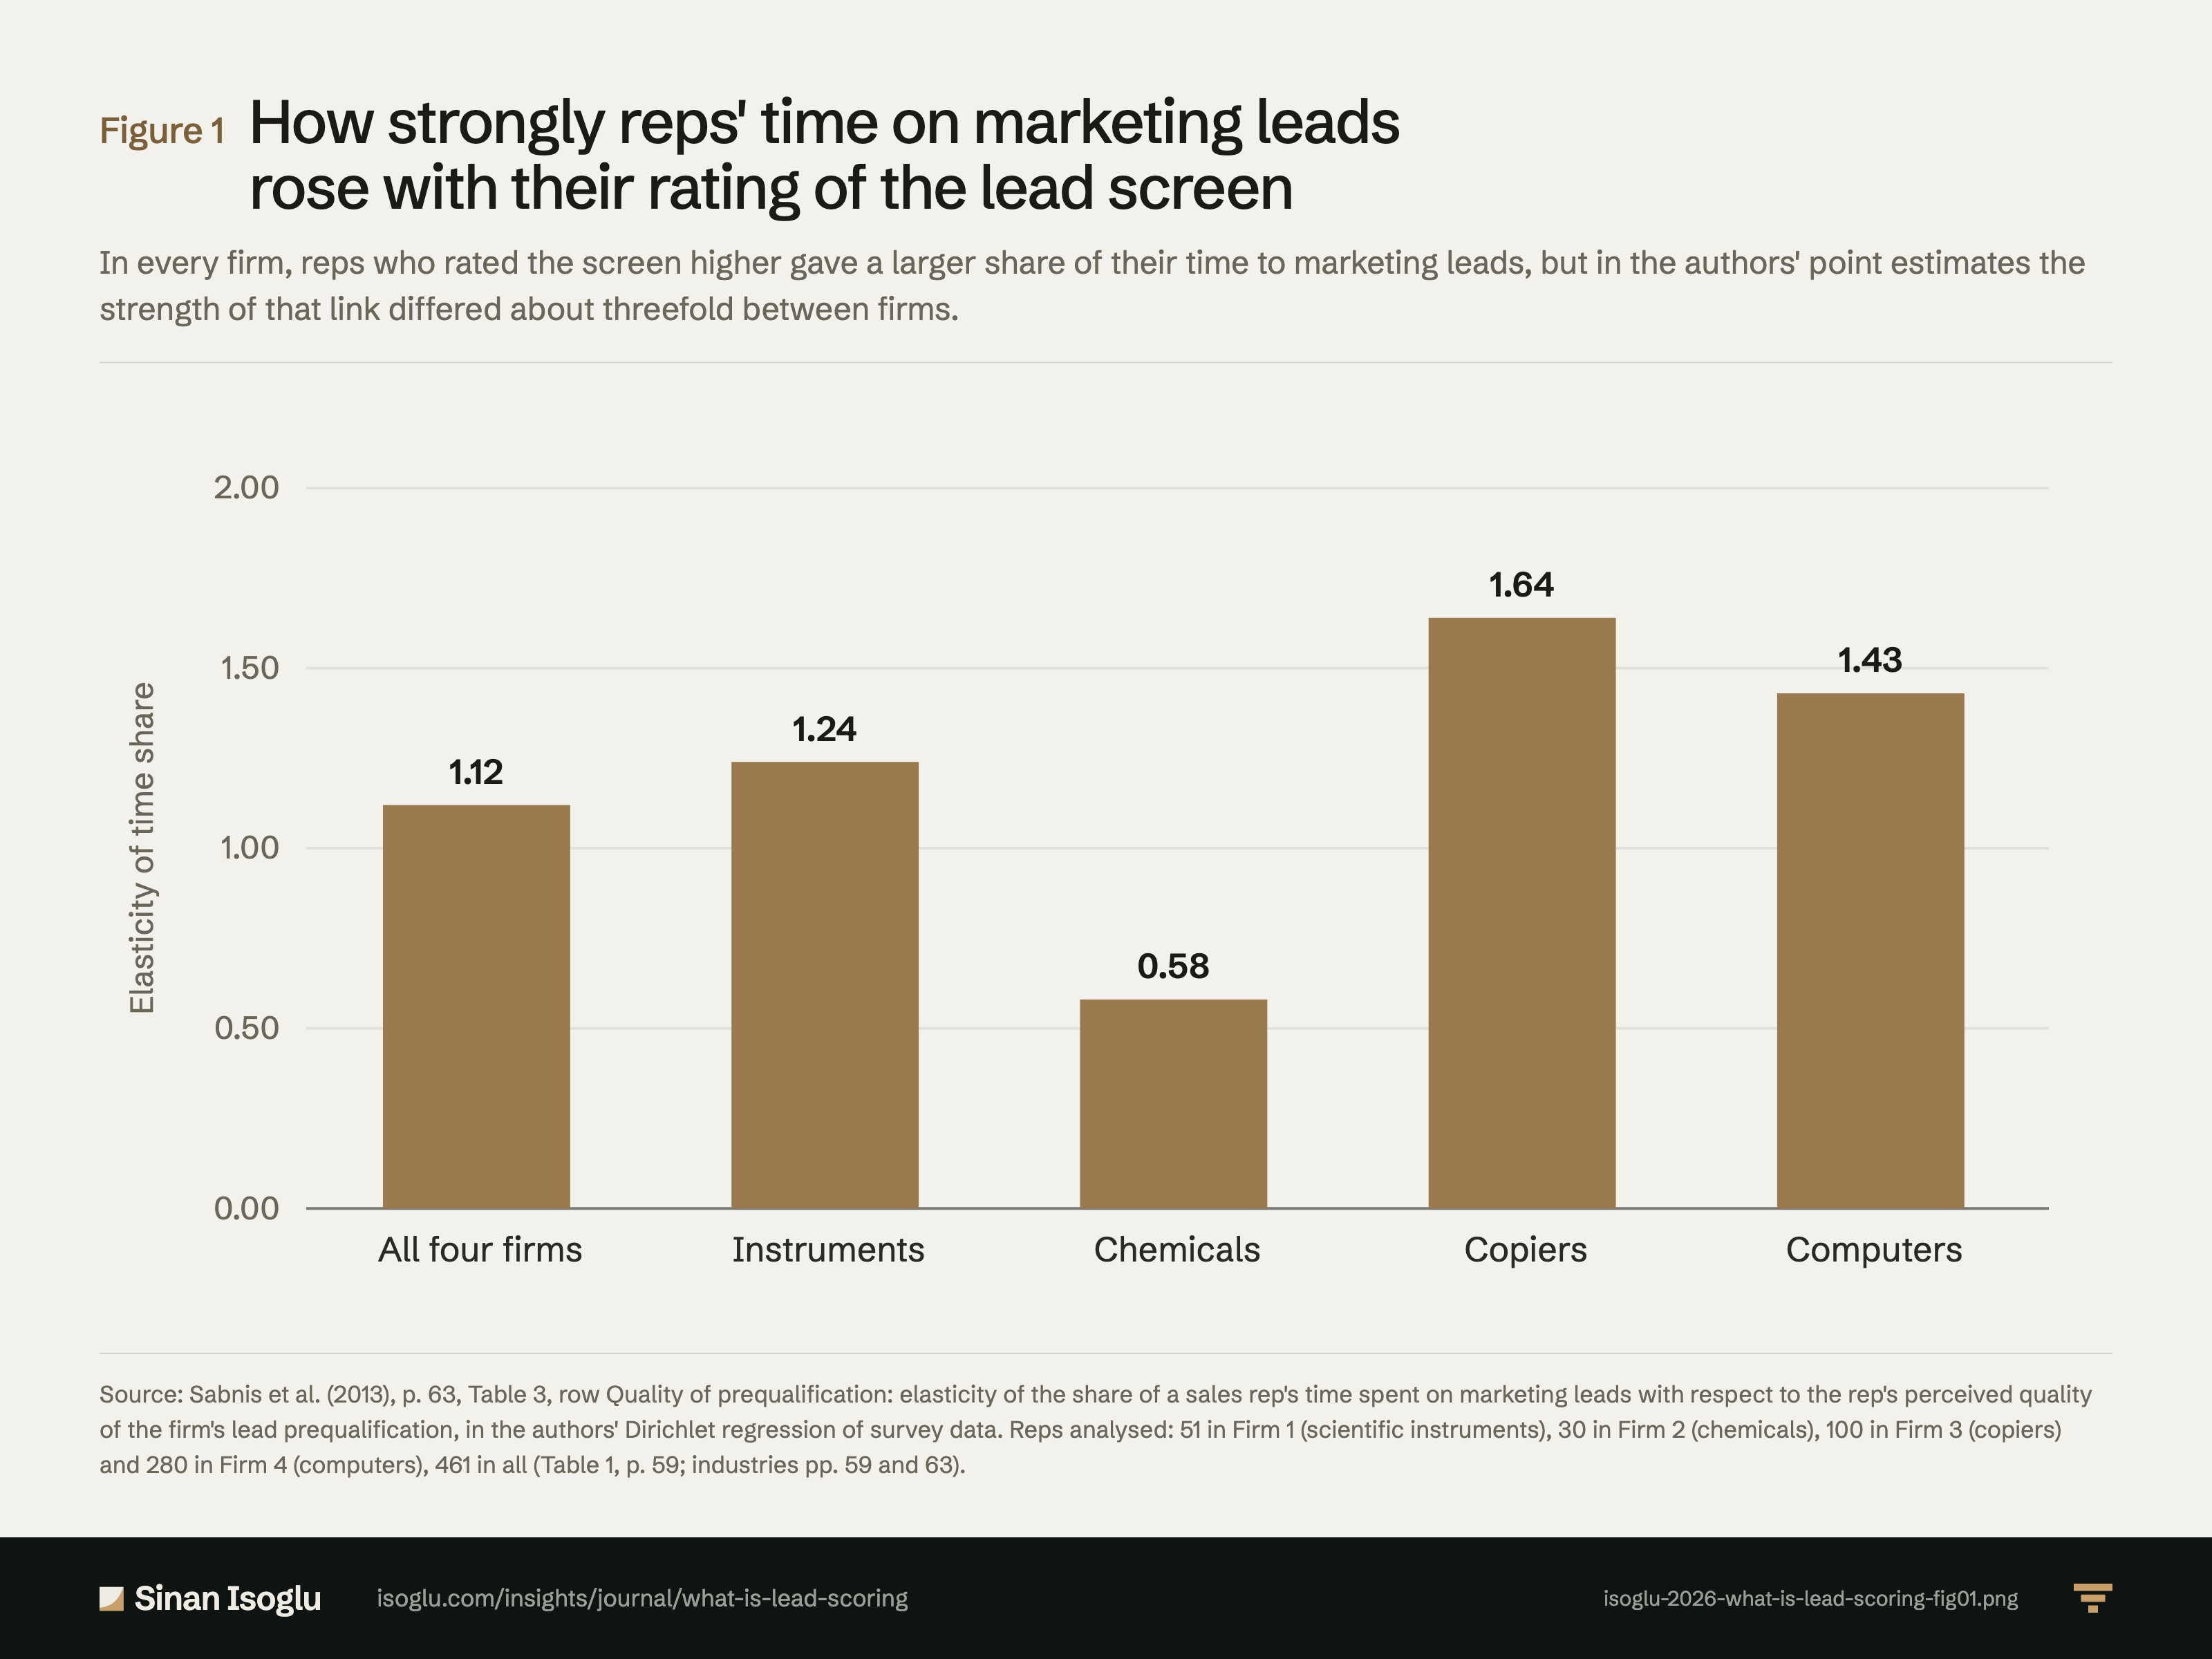
Wie stark der Zeitanteil für Marketing-Leads mit der Bewertung der Vorauswahl stieg
In jedem Unternehmen widmeten Vertriebsmitarbeitende, die die Vorauswahl besser bewerteten, Marketing-Leads einen größeren Teil ihrer Zeit, doch nach den Punktschätzungen der Autoren unterschied sich die Stärke dieses Zusammenhangs zwischen den Unternehmen etwa um das Dreifache.
Abbildung 1Wie stark der Zeitanteil für Marketing-Leads mit der Bewertung der Vorauswahl stieg
Quelle: Sabnis et al. (2013), S. 63, Tabelle 3, Zeile Quality of prequalification: Elastizität des Anteils der Arbeitszeit für Marketing-Leads in Bezug auf die wahrgenommene Qualität der Lead-Vorqualifizierung des eigenen Unternehmens, im Dirichlet-Regressionsmodell der Autoren auf Grundlage von Befragungsdaten. Ausgewertet: 51 Vertriebsmitarbeitende in Unternehmen 1 (wissenschaftliche Instrumente), 30 in Unternehmen 2 (Chemie), 100 in Unternehmen 3 (Kopierer) und 280 in Unternehmen 4 (Computer), insgesamt 461 (Tabelle 1, S. 59; Branchen S. 59 und 63).
Quelle und Evidenz
Jede Zeile nennt eine Aussage zu dieser Abbildung, ihre Quelle und die Art ihrer Prüfung.
- A LSC-SAB-C3 Results: H1a supported (b = .64, p < .05); elasticity of the marketing-lead time share to perceived prequalification quality 1.12 for the sample, positive in all four firms, .58 to 1.64, which the authors call a 3:1 ratio; Table 3, row Quality of prequalification (p. 63, page image): aggregate 1.12, Firm 1 1.24, Firm 2 .58, Firm 3 1.64, Firm 4 1.43; the same table gives managerial tracking −.14 and marketing lead volume −.07 for the aggregate; Firms 1 to 4 are scientific instruments, chemicals, copiers and computers (pp. 59 and 63), with 51, 30, 100 and 280 reps (Table 1, p. 59); H4a supported (b = .71): the prequalification effect is stronger with more experience. The authors write produces; the data are one cross-sectional survey, so the page reads an association. Table 3 prints point estimates only, with no interval or test, and in the hierarchical specification the firm-level effects shrink toward the aggregate (p. 62); the aggregate value is the model's own estimate, not an average of the firm values, and Firm 2 rests on 30 reps; the page says so in the Figure 1 caption and calls the elasticity a slope, not a closeness of fit (G5 F6). The instrument prints the scale as 1 = agree and 7 = disagree (p. 58) while the text reads higher scores as higher perceived quality (pp. 59, 63), so the page gives direction as the authors state it and uses no scale means (pp. 59, 61 to 63): "which suggests that as the perceived quality of prequalification increases, the proportion of time spent on marketing leads increases"; "a 1% increase in perceived prequalification quality produces a 1.12% increase in marketing lead follow-up time allocation"; "The elasticity is positive across all four firms but varies considerably (from .58 to 1.64)."; "we find a 3:1 ratio for the elasticity of the perceived prequalification quality for the least and most responsive firms"; "Elasticity of Marketing Lead Time Proportion"; "It is negative for Firms 1 (scientific instruments) and 2 (chemicals) but positive for Firms 3 (copiers"; "in which we argued that experience enhances the positive effect of the perceived quality of prequalification on the proportion of time spent following up marketing leads"; "In the model specification, the firm-level effects shrink to the aggregate effects."; "from 55 (Firm 2, chemicals) to 2500 (Firm 4, computers)"Sabnis et al. (2013) · Sabnis et al. (2013)
Prüfgrade: A, gegen die gedruckte Seite der Primärquelle geprüft · B, Primärquelle, nur Textebene · C, belastbare Sekundärquelle · D, berichtet.
Aus dem Beitrag
Revenue Operations & KI
Was ist Lead-Scoring?
Lead-Scoring ordnet Leads nach der Chance auf ein benanntes Ergebnis. Ohne dieses Ergebnis, ein Zeitfenster und eine Grundgesamtheit sagt ein Score wenig.
Den Beitrag lesenDiese Abbildung gehört zu einem Essay: Die Zahlen stehen hier, das Argument dort.
Zitieren oder einbetten
Verwandte Abbildungen
Kontakt
Schicken Sie die Frage, an der Sie arbeiten.
Forschung, ein Gastvortrag oder eine Frage aus der Praxis.