Figure 1From “What is key account management?”
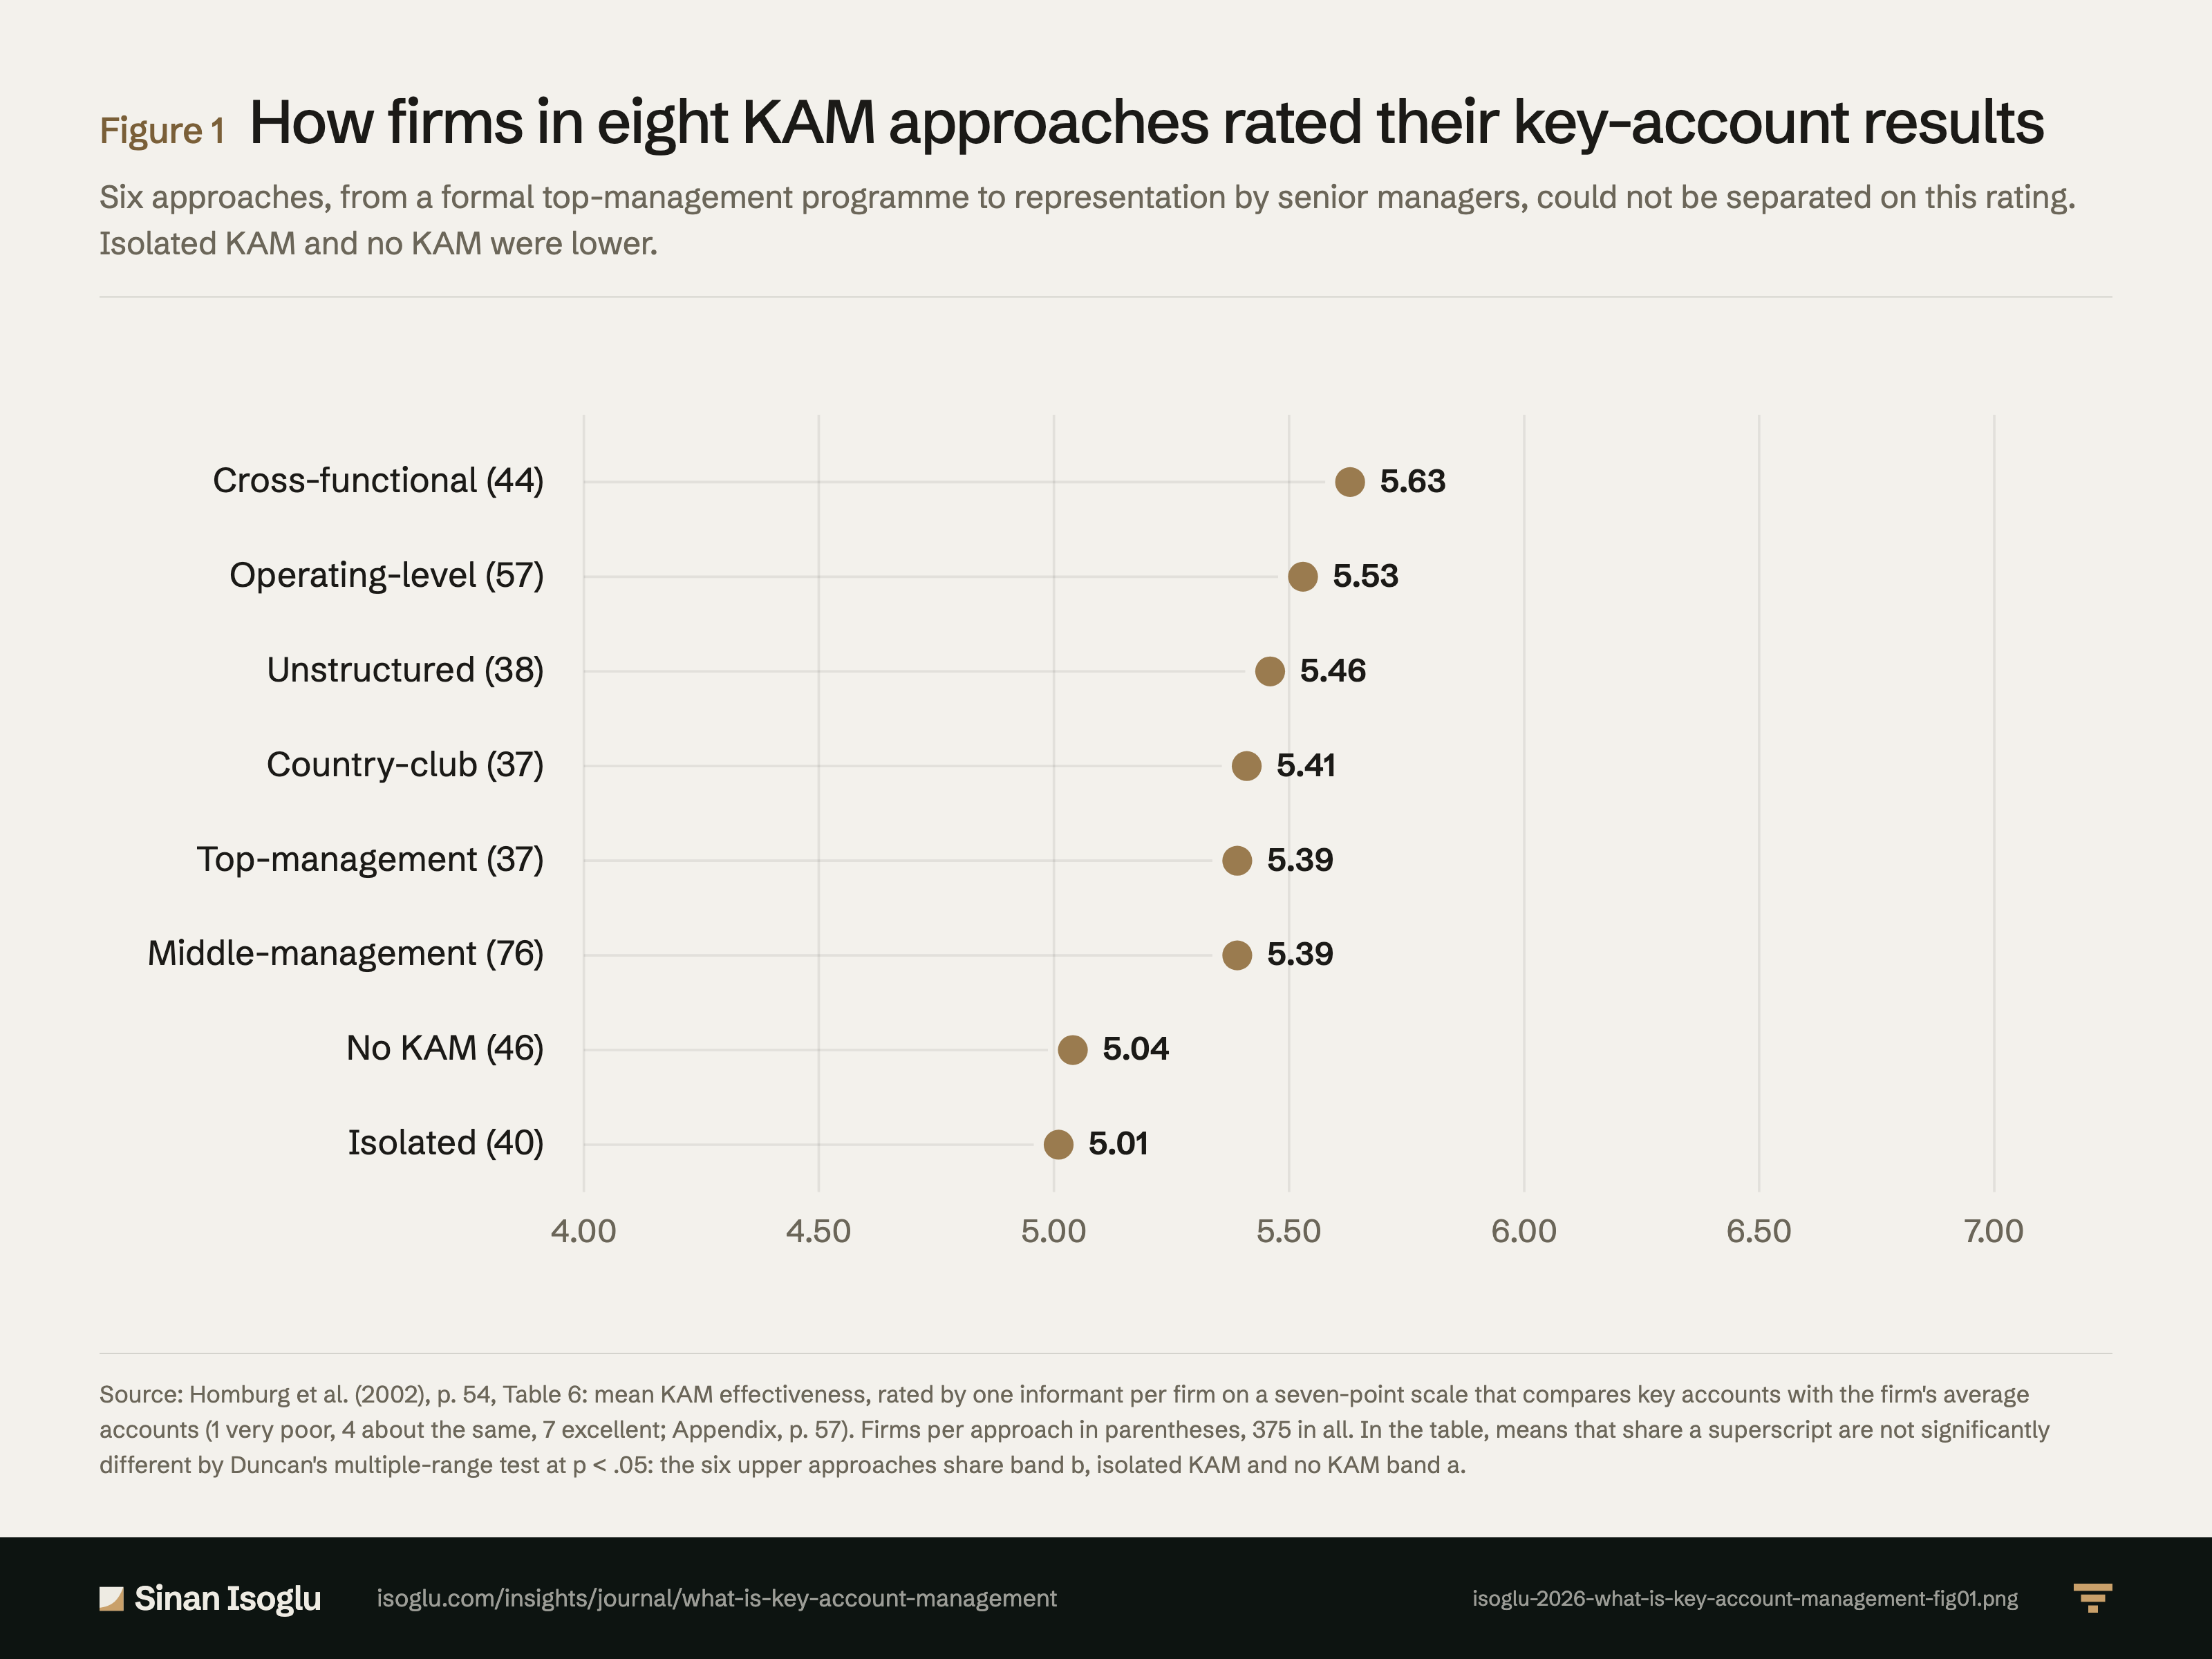
How firms in eight KAM approaches rated their key-account results
Six approaches, from a formal top-management programme to representation by senior managers, could not be separated on this rating. Isolated KAM and no KAM were lower.
Figure 1How firms in eight KAM approaches rated their key-account results
Source: Homburg et al. (2002), p. 54, Table 6: mean KAM effectiveness, rated by one informant per firm on a seven-point scale that compares key accounts with the firm's average accounts (1 very poor, 4 about the same, 7 excellent; Appendix, p. 57). Firms per approach in parentheses, 375 in all. In the table, means that share a superscript are not significantly different by Duncan's multiple-range test at p < .05: the six upper approaches share band b, isolated KAM and no KAM band a.
Source and evidence
Each line names a claim related to this exhibit, its source, and how it was checked.
- A HWJ02-C5 Table 6 (p. 54, read from the page image), mean KAM effectiveness: cross-functional 5.63, operating-level 5.53, unstructured 5.46, country-club 5.41, top-management 5.39, middle-management 5.39 (band b), no KAM 5.04, isolated 5.01 (band a); profitability highest for top-management KAM (6.38, band b), the only approach significantly above no KAM (4.80, band a), with middle-management and operating-level (4.98) and country-club KAM (4.82) in band a alone and cross-functional (5.64), unstructured (5.84) and isolated KAM (5.23) in bands a and b; cross-functional KAM has the highest mean on performance in the market (5.51, band d, which middle-management, unstructured and country-club KAM share) and on adaptiveness (5.43, band d alone); the authors write that no-KAM and isolated KAM perform worst on both levels, which Table 6 bears out on KAM effectiveness, performance in the market (4.54 and 4.72) and adaptiveness (4.23 and 4.25), the two lowest means each time, but not on profitability, where isolated KAM sits above four approaches; the authors treat profitability as the objective measure that a key-informant bias should not affect (p. 53); the same performance through different approaches; cluster effects remain significant under ANCOVA with market dynamism and competitive intensity; most effective not the most profitable, possibly from higher costs; the no-KAM result called the most comprehensive demonstration that suppliers benefit; failure to achieve access to and commitment of cross-functional resources seems to play a critical role (pp. 53 to 55; revised at G5 2026-10-17, F3, N3): "the same level of performance can be accomplished"; "Profitability 6.38b 4.98a 4.98a 5.64ab 5.84ab 5.23ab 4.82a 4.80a"; "Performance in 5.03bc 5.23cd 5.04bc 5.51d 5.19cd 4.72ab 5.16cd 4.54a"; "Adaptiveness 4.75bc 4.87b 4.46ab 5.43d 4.85bc 4.25a 4.50abc 4.23a"; "cluster means that have the same superscript are not significantly"; "not the objective performance measure (i.e., profitability)"; "no-KAM and the isolated KAM approaches perform the"; "the effects of cluster membership on all"; "that the most effective approaches are not the most"; "ones may be explained by some approaches involving"; "higher costs in addition to generating higher revenues"; "the most comprehensive empirical demonstration so"; "far that suppliers benefit from managing their key accounts"; "seems to play a critical"Homburg, Workman & Jensen (2002) · Homburg, Workman & Jensen. (2002)
Grades: A, verified against the printed page of the primary source · B, primary source, text layer only · C, authoritative secondary · D, reported.
From the essay
Revenue operations & AI
What is key account management?
Key account management is what a supplier does differently for its most important customers, and who does it. A formal programme is one form of it.
Read the essayThis exhibit belongs to an essay: the numbers live here, the argument lives there.
Cite or embed
Related exhibits
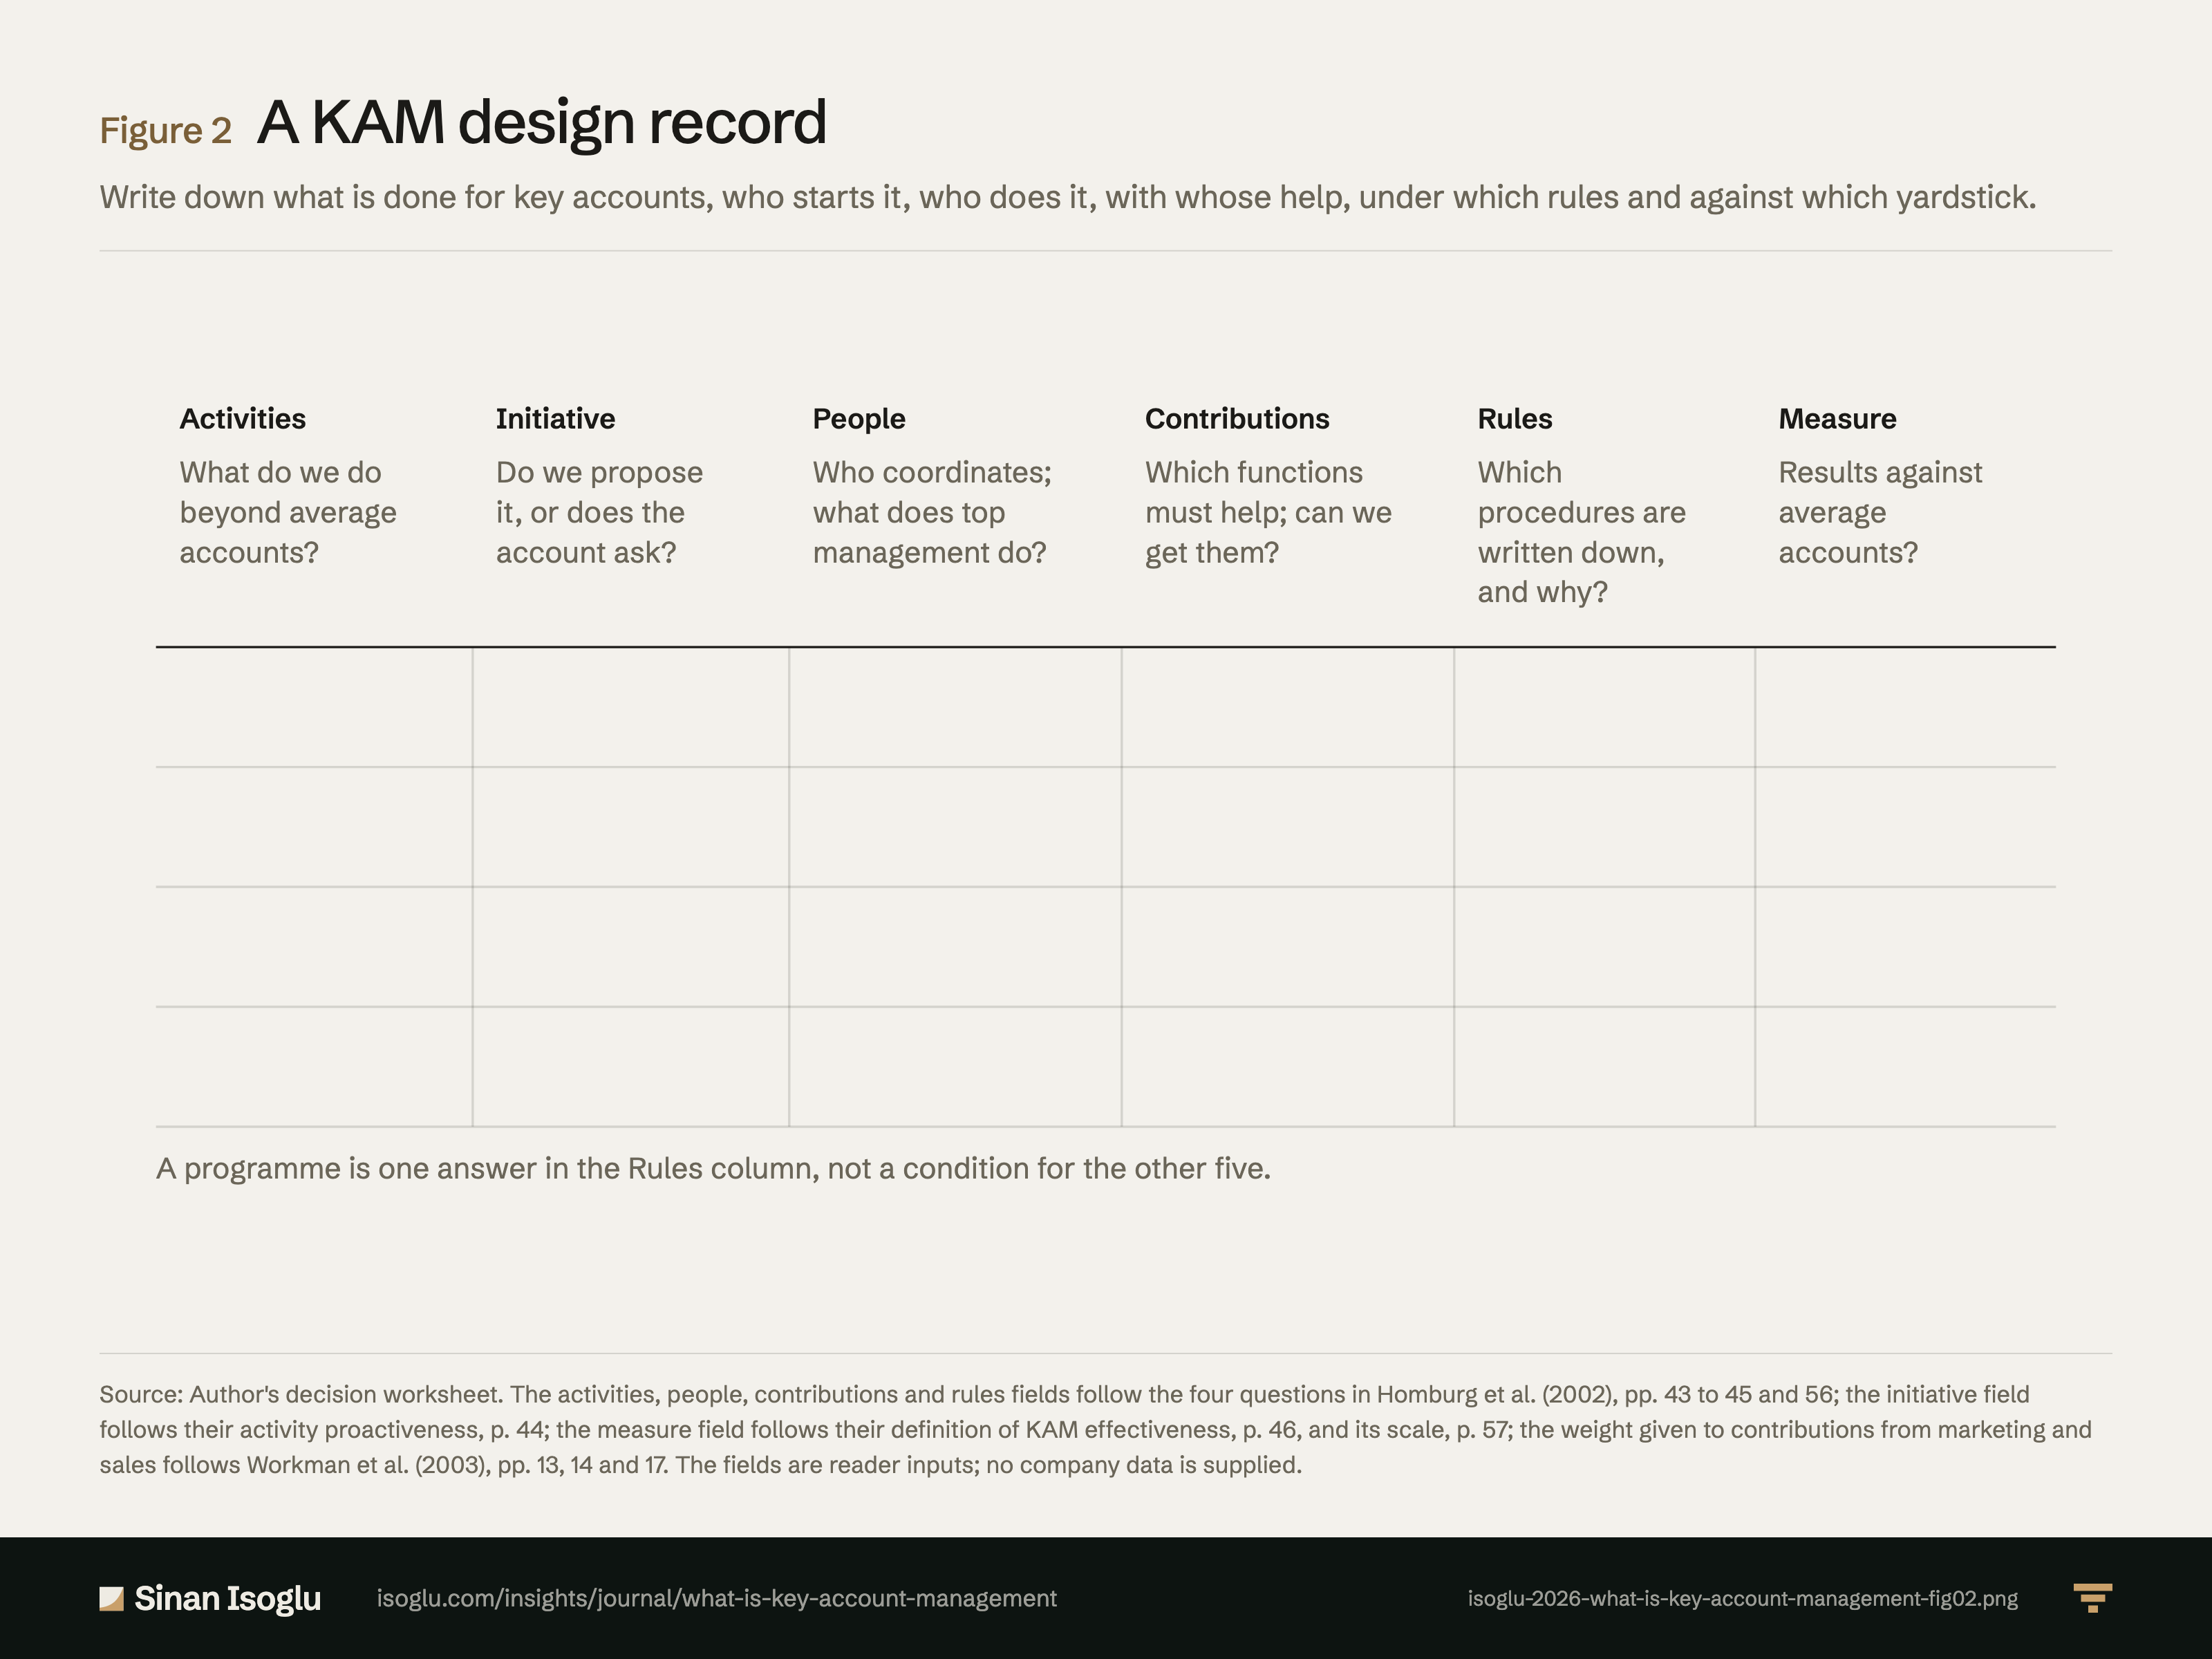
Figure 2Figure
A KAM design record
What is key account management?
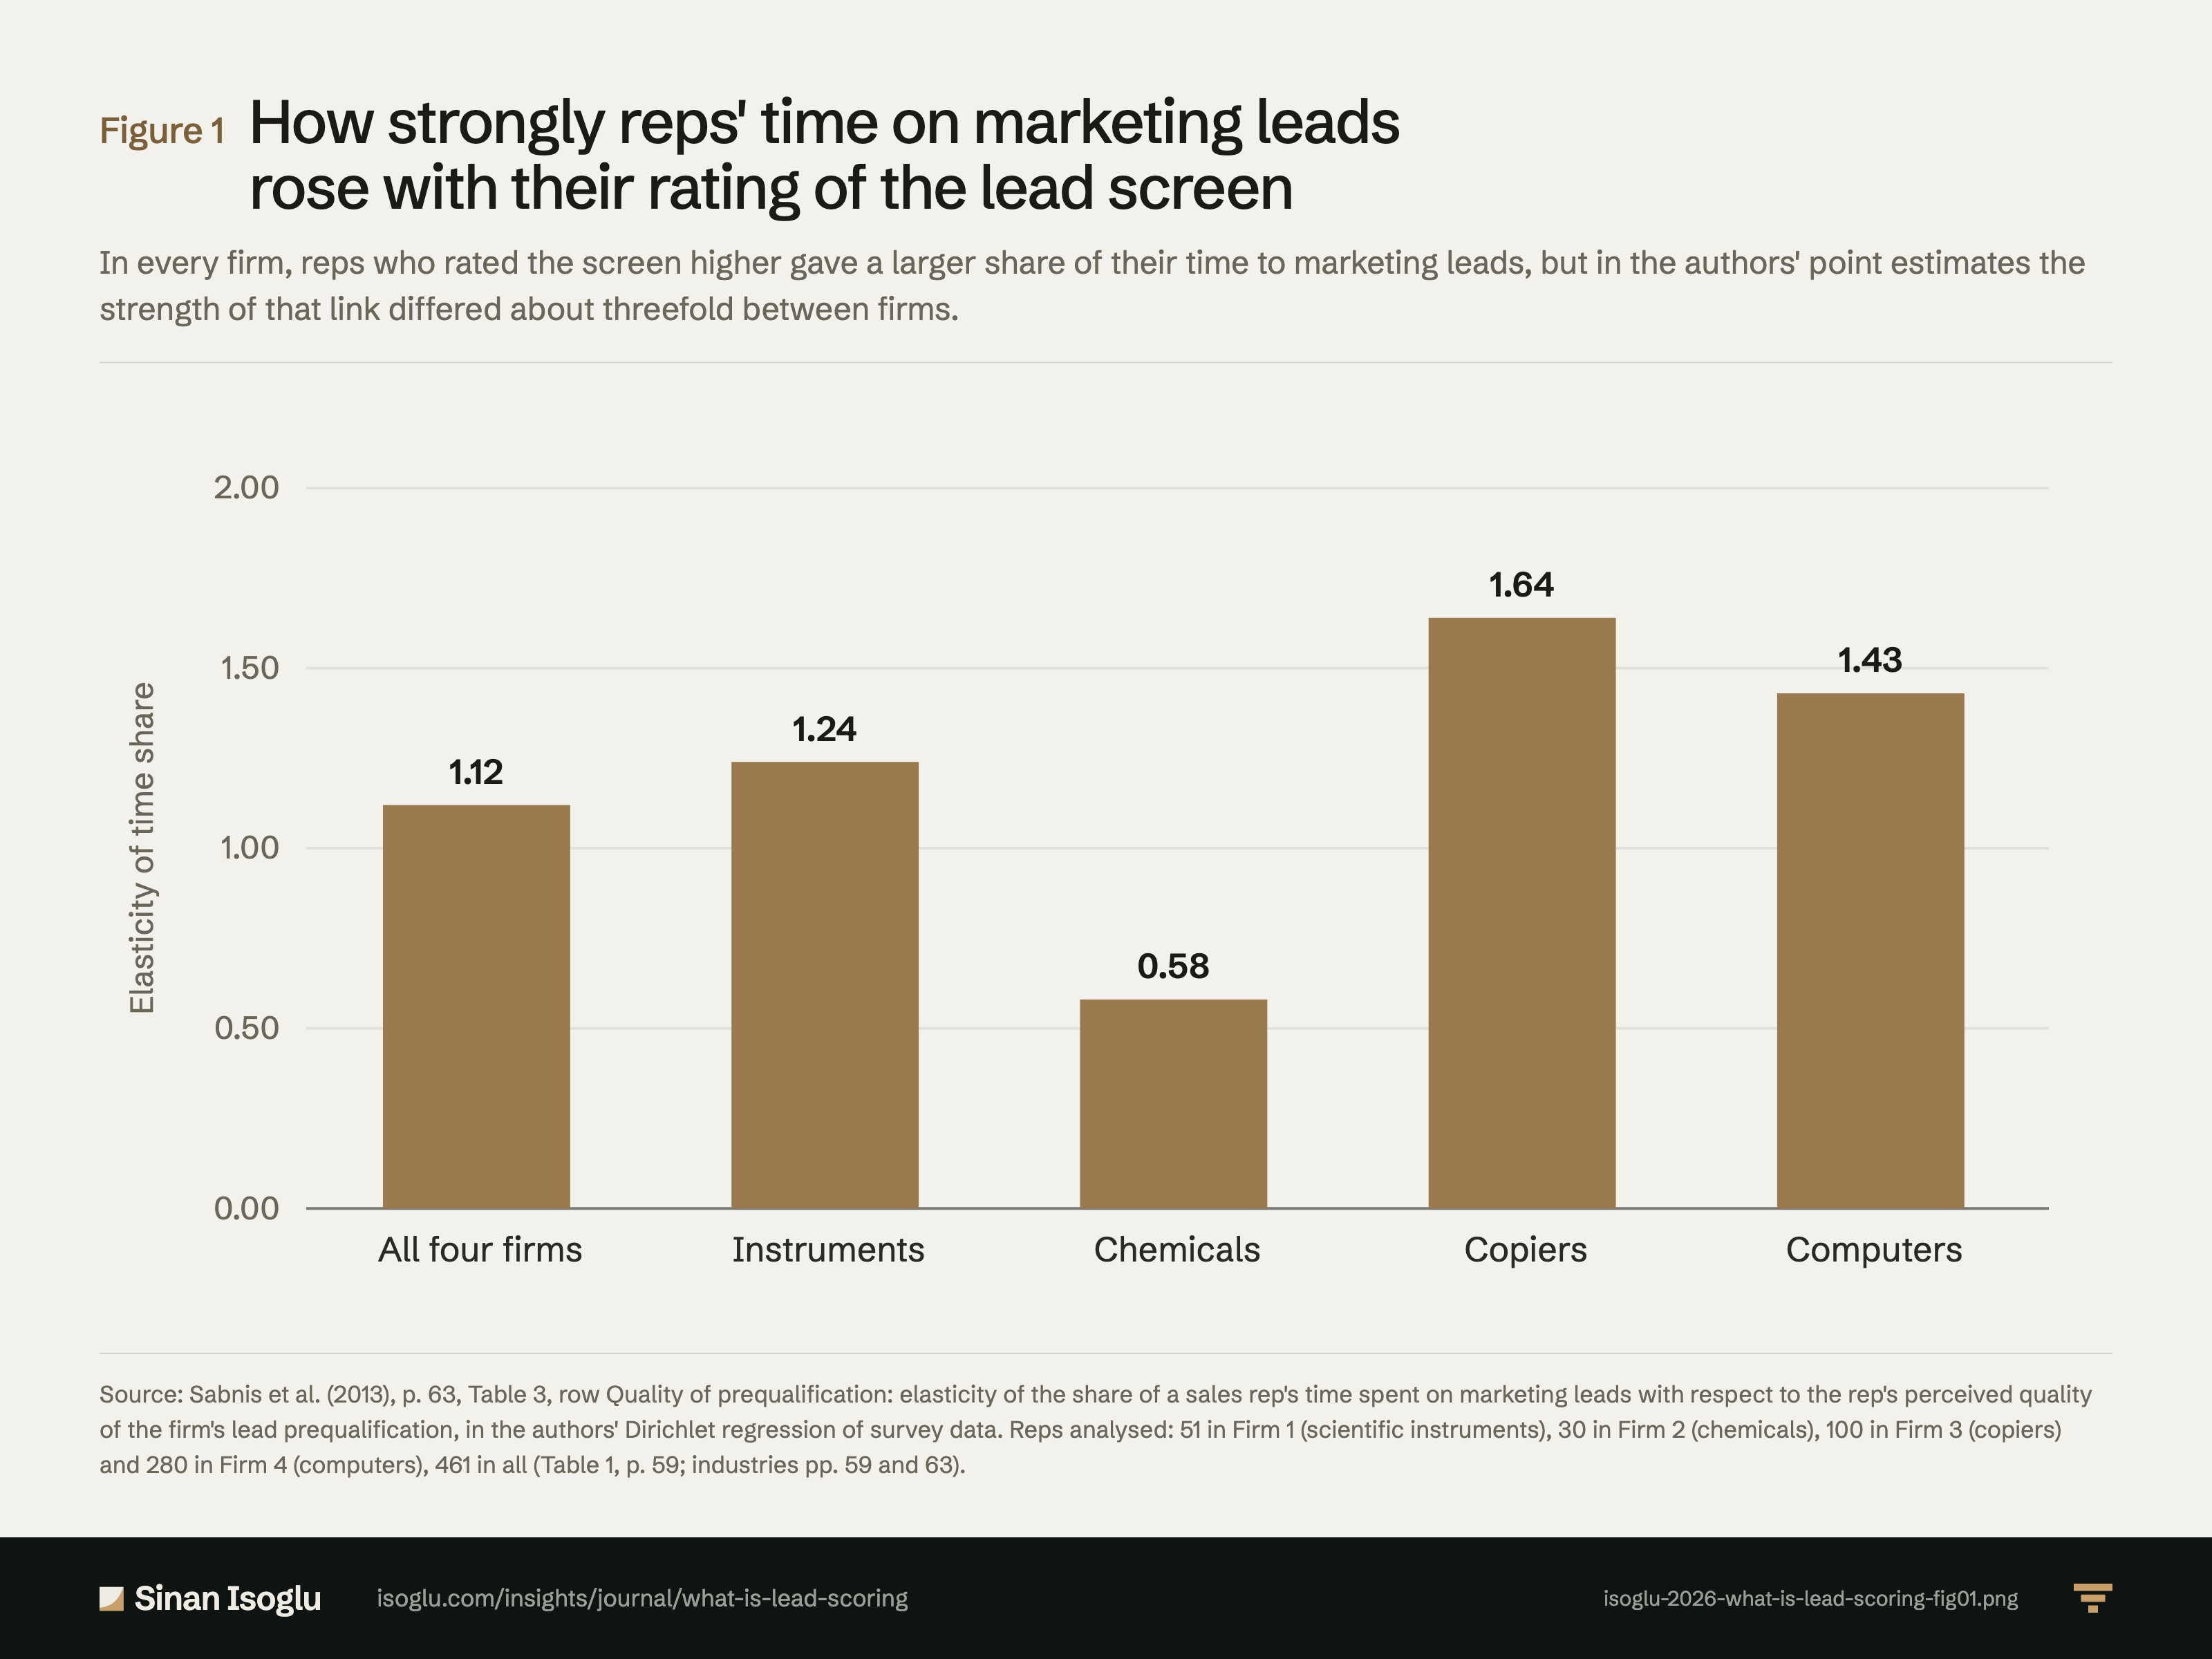
Figure 1Figure
How strongly reps' time on marketing leads rose with their rating of the lead screen
What is lead scoring?
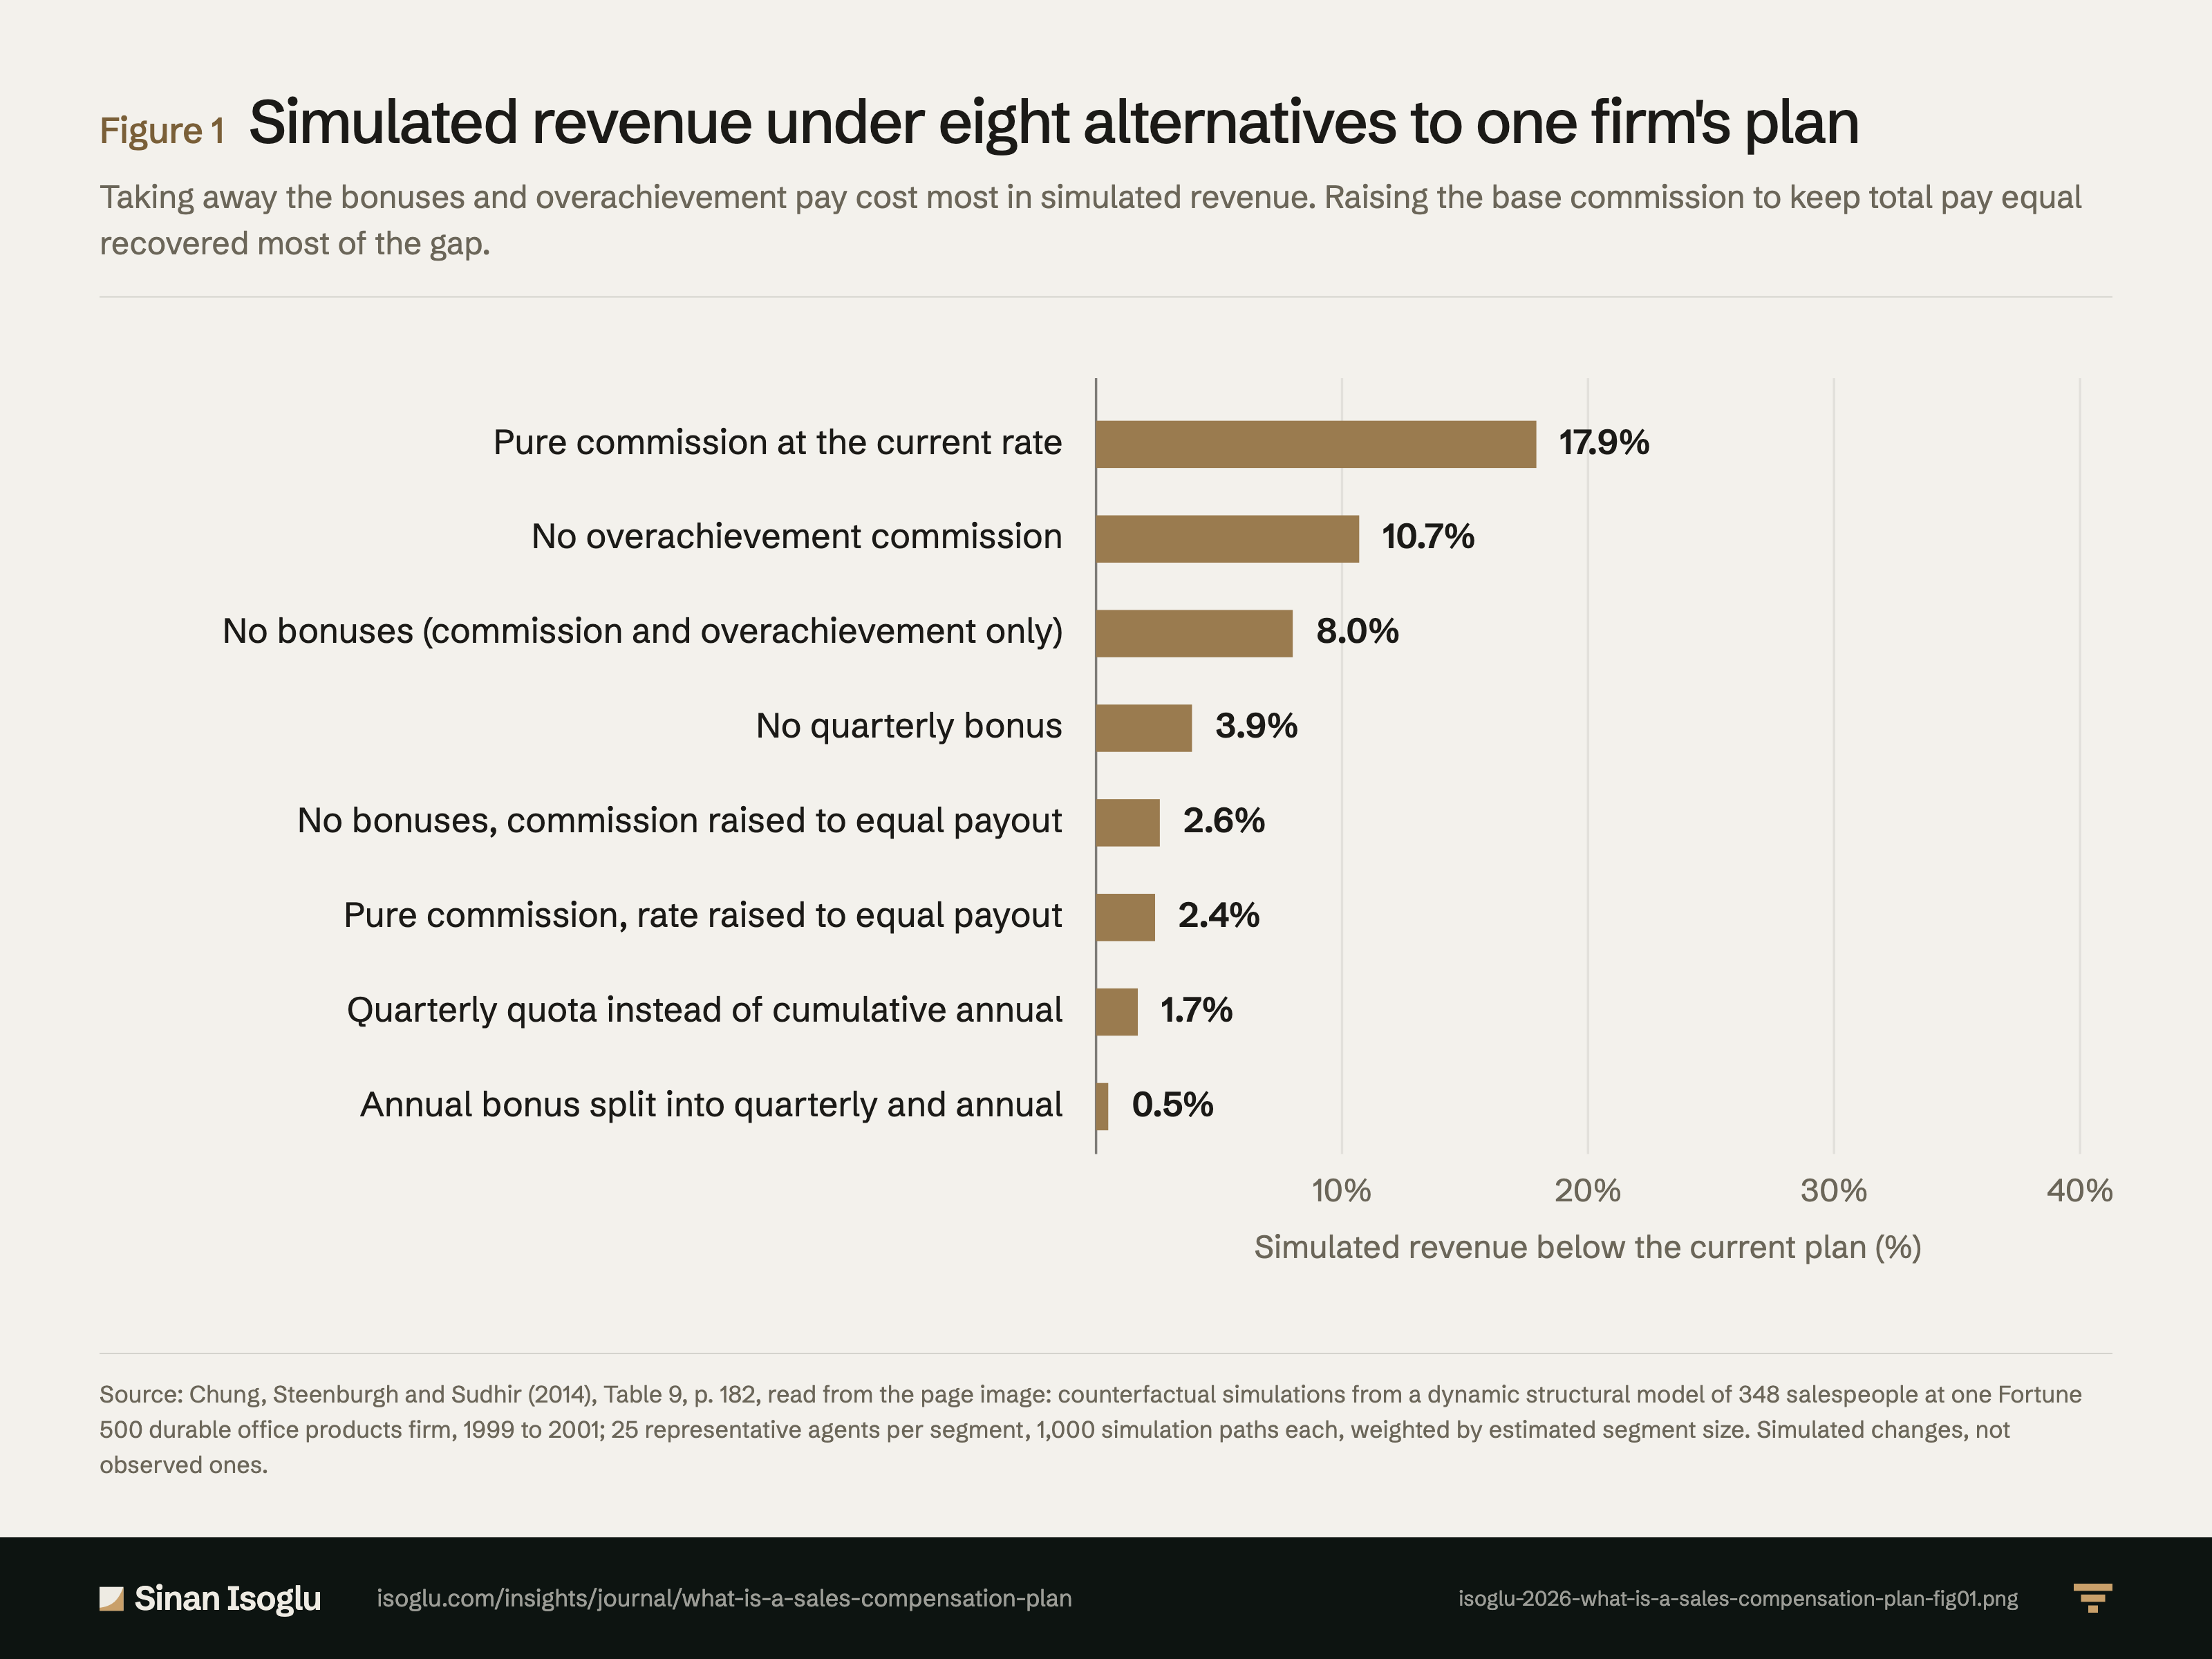
Figure 1Figure
Simulated revenue under eight alternatives to one firm's plan
What is a sales compensation plan?
Contact
Bring the question you're working on.
Research, a guest lecture, or a commercial question.