← Every exhibit

Figure 1From “What is a sales compensation plan?”

Simulated revenue under eight alternatives to one firm's plan

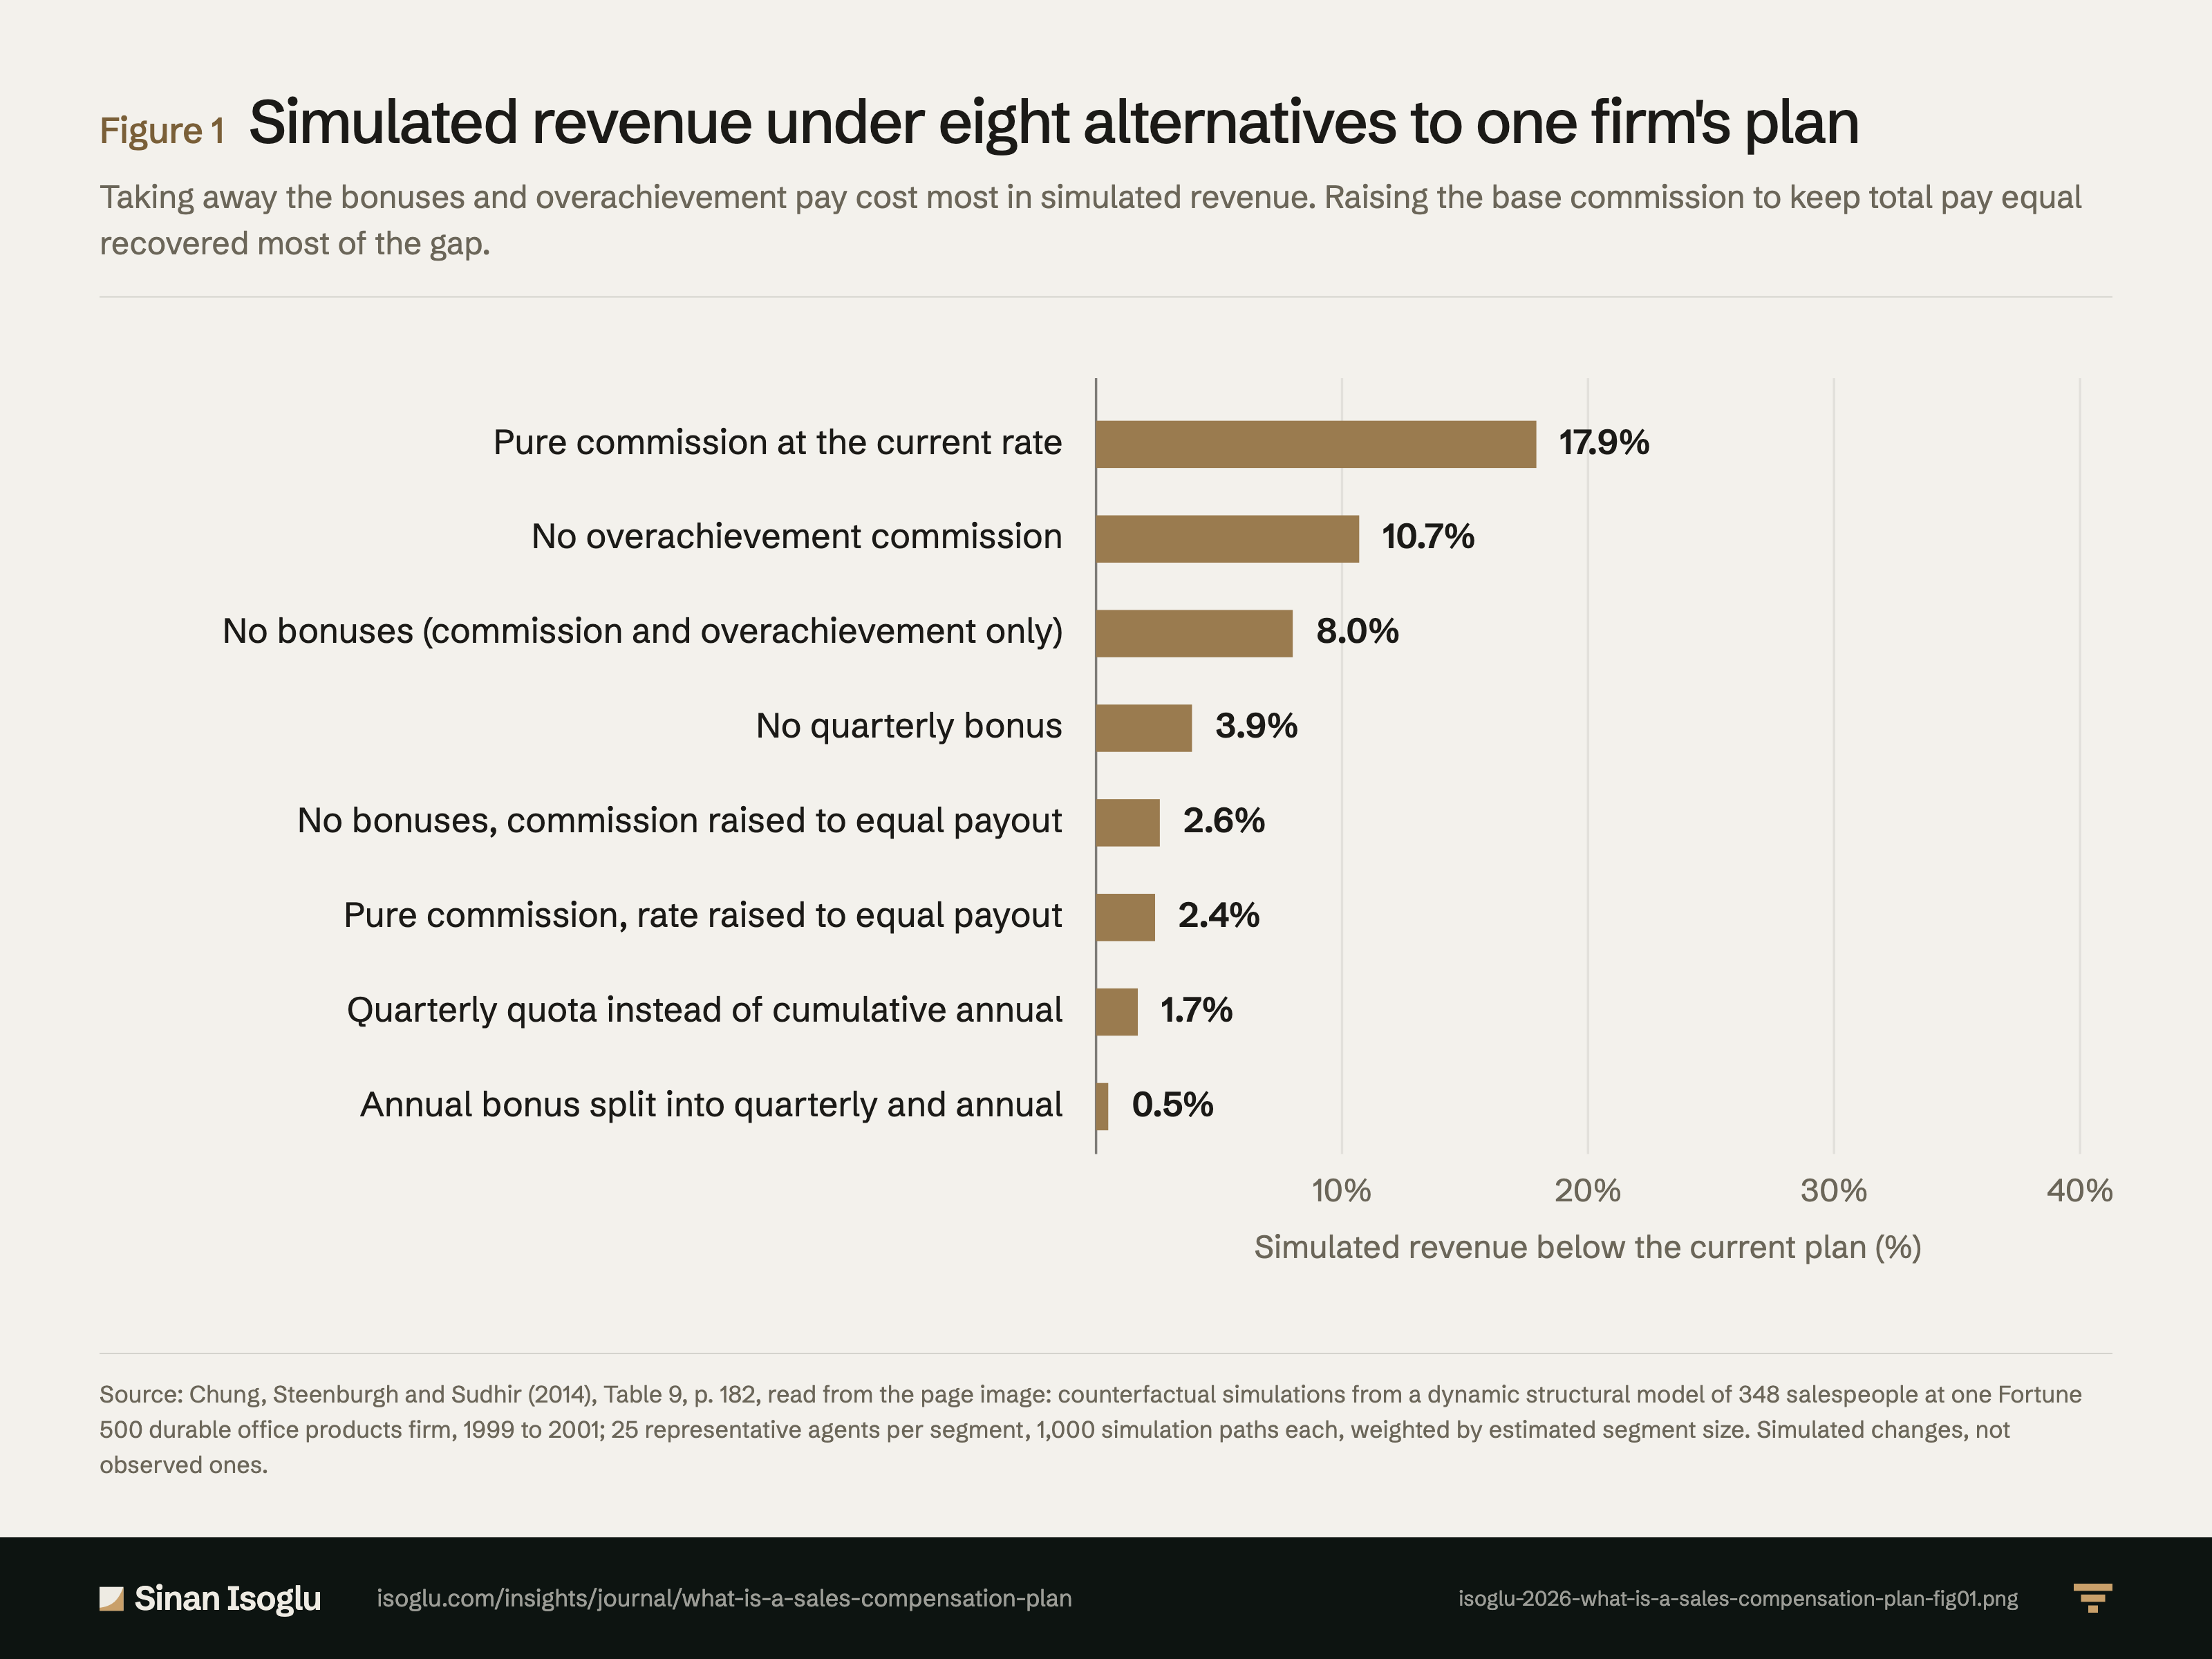
Taking away the bonuses and overachievement pay cost most in simulated revenue. Raising the base commission to keep total pay equal recovered most of the gap.

Cite Embed

Figure 1Simulated revenue under eight alternatives to one firm's plan

Horizontal bar chart of simulated revenue below the current plan at one office products firm, from Chung and colleagues 2014, Table 9. Pure commission at the current rate: 17.9 percent lower. No overachievement commission: 10.7. No bonuses, commission and overachievement only: 8.0. No quarterly bonus: 3.9. No bonuses with commission raised to equal payout: 2.6. Pure commission with the rate raised to equal payout: 2.4. Quarterly quota instead of cumulative annual: 1.7. Annual bonus split into quarterly and annual: 0.5.10%20%30%40%Pure commission at the current rate17.9%No overachievement commission10.7%No bonuses (commission and overachievement only)8.0%No quarterly bonus3.9%No bonuses, commission raised to equal payout2.6%Pure commission, rate raised to equal payout2.4%Quarterly quota instead of cumulative annual1.7%Annual bonus split into quarterly and annual0.5%Simulated revenue below the current plan (%)

Source: Chung, Steenburgh and Sudhir (2014), Table 9, p. 182, read from the page image: counterfactual simulations from a dynamic structural model of 348 salespeople at one Fortune 500 durable office products firm, 1999 to 2001; 25 representative agents per segment, 1,000 simulation paths each, weighted by estimated segment size. Simulated changes, not observed ones.
PNG4:3, 1600 × 1200, with the title, the source line and the attribution set in the image isoglu-2026-what-is-a-sales-compensation-plan-fig01.png

Cite or embed

APA 7

Isoglu, S. (2026). Simulated revenue under eight alternatives to one firm's plan [Figure]. isoglu.com. https://isoglu.com/insights/exhibits/isoglu-2026-what-is-a-sales-compensation-plan-fig01/

BibTeX
@misc{isoglu-2026-what-is-a-sales-compensation-plan-fig01,
  author = {Isoglu, Sinan},
  title = {{Simulated revenue under eight alternatives to one firm's plan}},
  year = {2026},
  howpublished = {Figure 1, isoglu.com},
  url = {https://isoglu.com/insights/exhibits/isoglu-2026-what-is-a-sales-compensation-plan-fig01/},
  note = {From the essay {What is a sales compensation plan?}}
}
Embed this exhibit

Copy this HTML to use the PNG exhibit on your site with its source line and a link back to the exhibit page.

<figure>
  <a href="https://isoglu.com/insights/exhibits/isoglu-2026-what-is-a-sales-compensation-plan-fig01/">
    <img src="https://isoglu.com/social/isoglu-2026-what-is-a-sales-compensation-plan-fig01.png" alt="Figure 1: Simulated revenue under eight alternatives to one firm&#39;s plan" width="3200" height="2400">
  </a>
  <figcaption>Figure 1: Simulated revenue under eight alternatives to one firm&#39;s plan. Source: Chung, Steenburgh and Sudhir (2014), Table 9, p. 182, read from the page image: counterfactual simulations from a dynamic structural model of 348 salespeople at one Fortune 500 durable office products firm, 1999 to 2001; 25 representative agents per segment, 1,000 simulation paths each, weighted by estimated segment size. Simulated changes, not observed ones. <a href="https://isoglu.com/insights/exhibits/isoglu-2026-what-is-a-sales-compensation-plan-fig01/">View exhibit</a>.</figcaption>
</figure>