Table 2From “What is go-to-market efficiency? The denominator across growth and capacity”
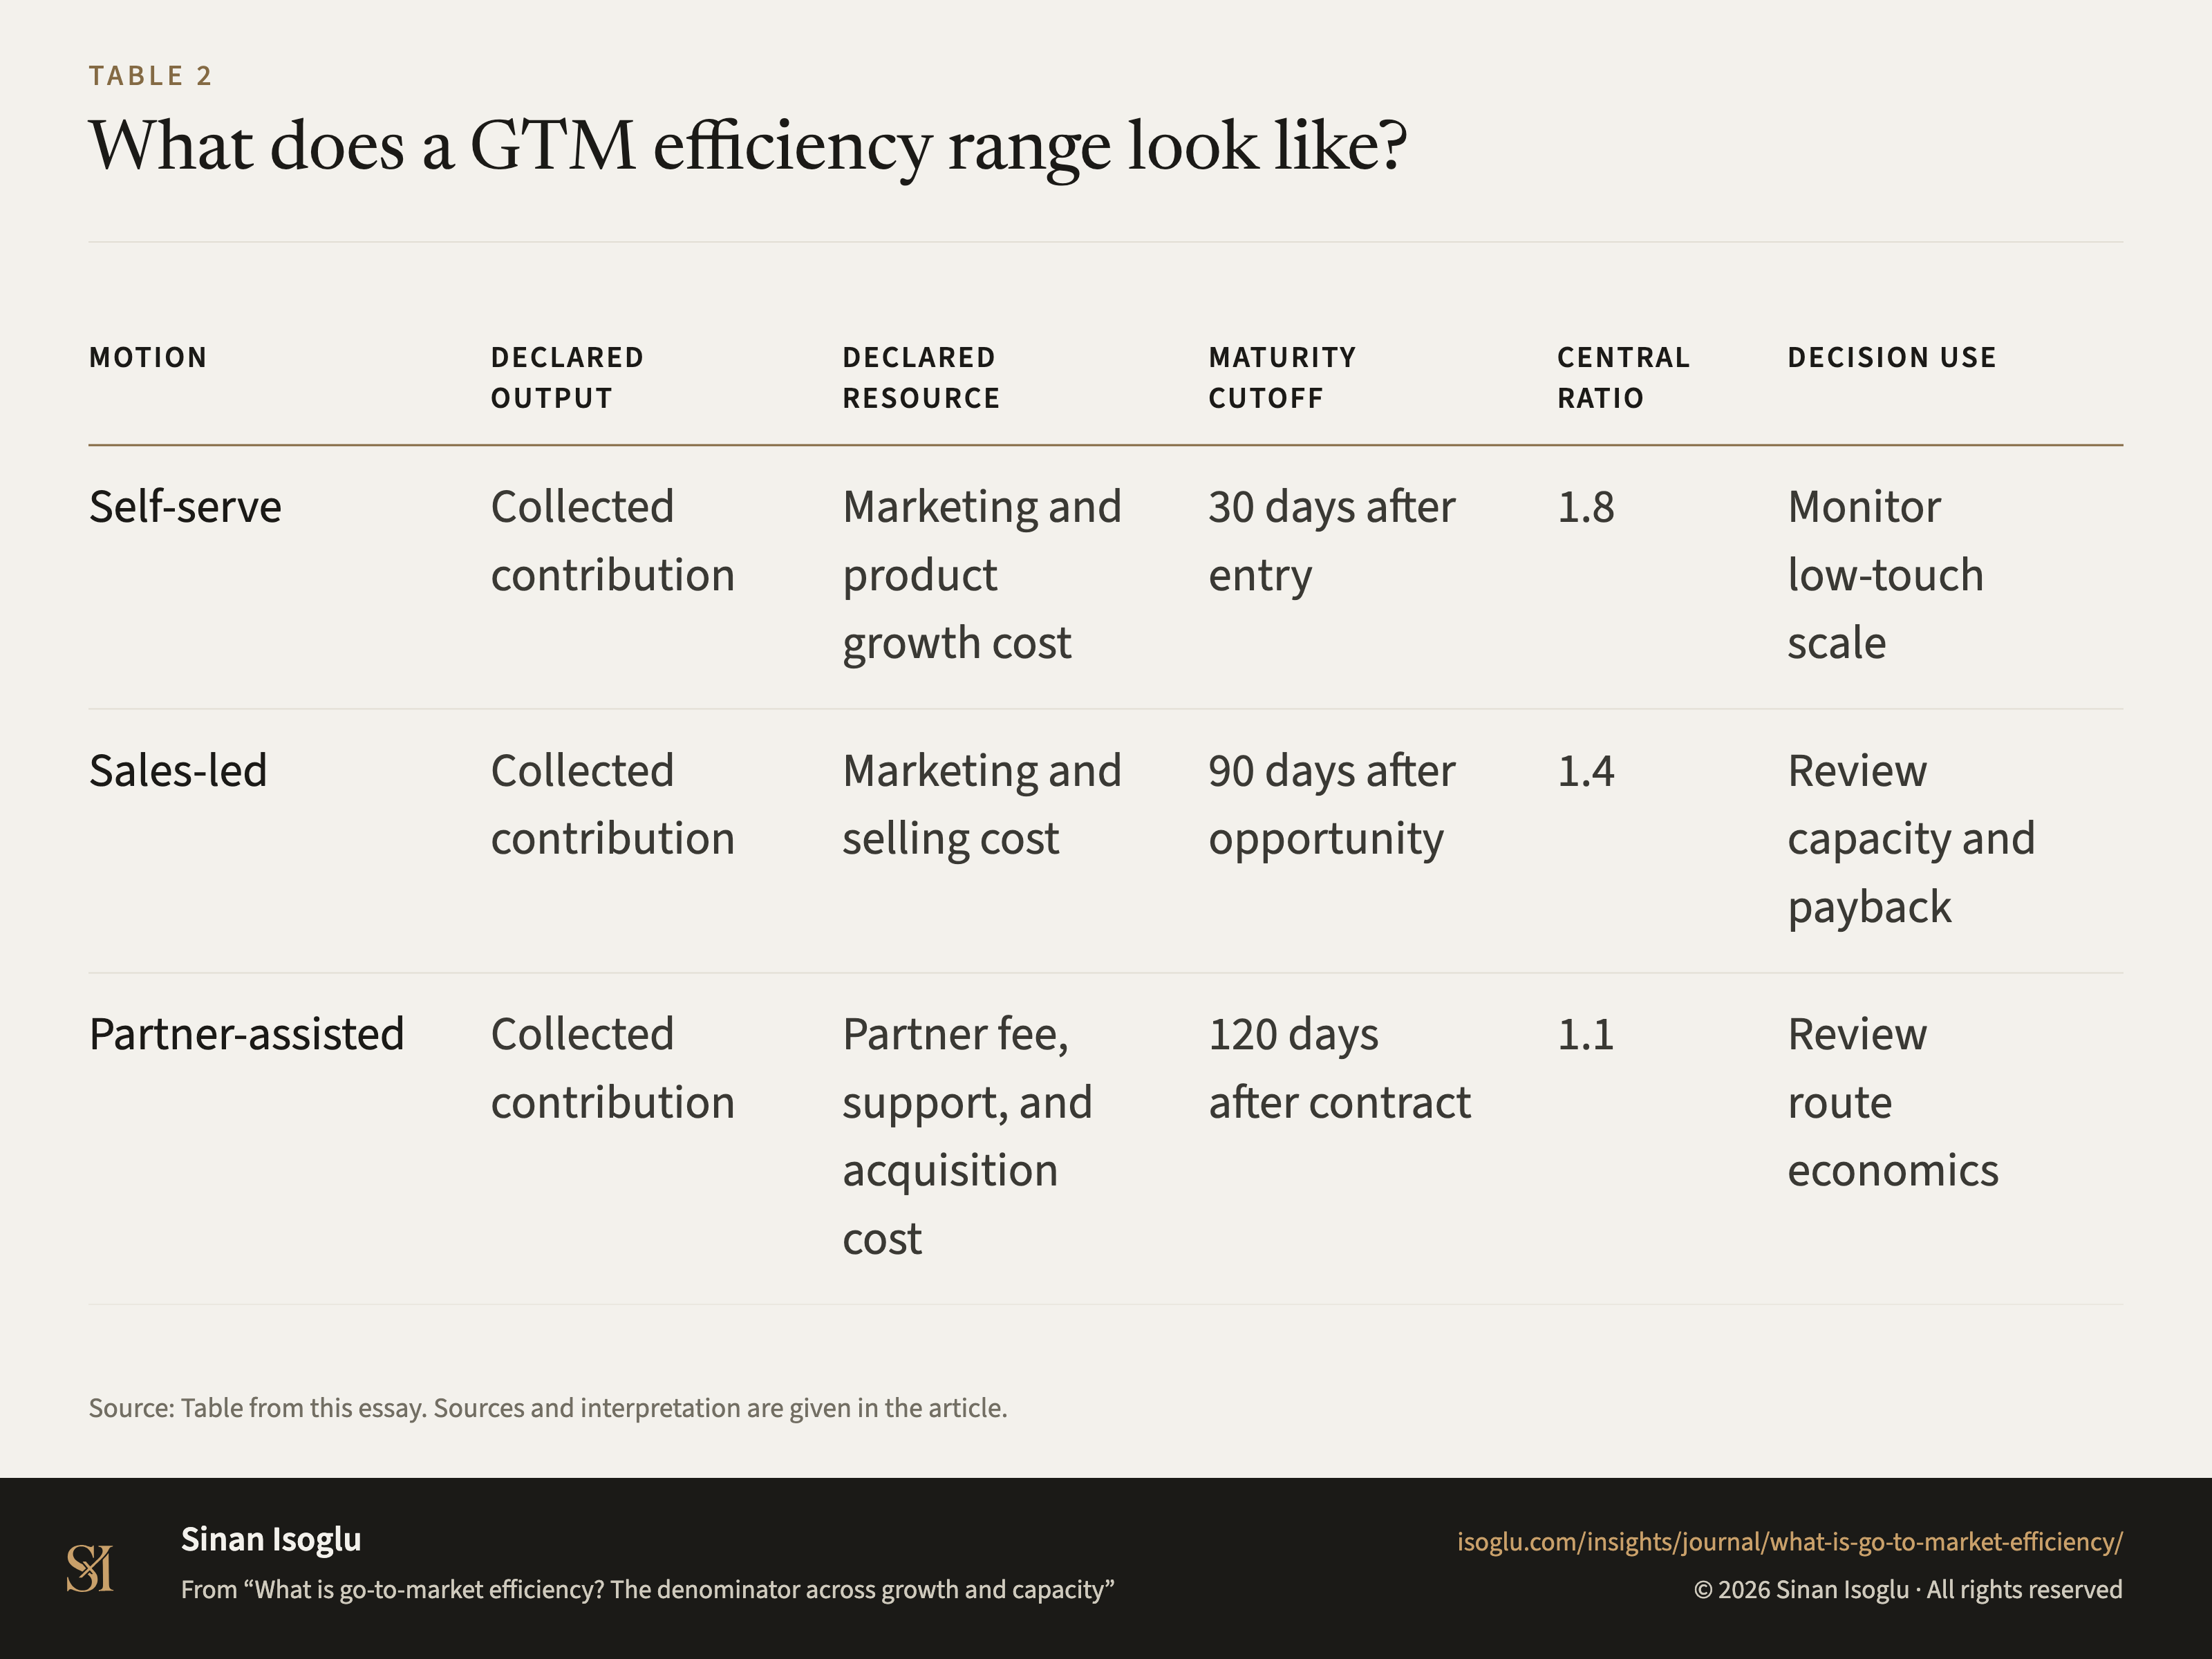
What does a GTM efficiency range look like?
Table 2What does a GTM efficiency range look like?
| Motion | Declared output | Declared resource | Maturity cutoff | Central ratio | Decision use |
|---|---|---|---|---|---|
| Self-serve | Collected contribution | Marketing and product growth cost | 30 days after entry | 1.8 | Monitor low-touch scale |
| Sales-led | Collected contribution | Marketing and selling cost | 90 days after opportunity | 1.4 | Review capacity and payback |
| Partner-assisted | Collected contribution | Partner fee, support, and acquisition cost | 120 days after contract | 1.1 | Review route economics |
Swipe or scroll horizontally if the table is wider than your screen.
Source: Table from this essay. Sources and interpretation are given in the article.
From the essay
Growth that compounds
What is go-to-market efficiency? The denominator across growth and capacity
Go-to-market efficiency is a declared output-to-resource ratio. Name output, denominator, maturity, and capacity before comparing motions.
Read the essayThis exhibit belongs to an essay: the numbers live here, the argument lives there.
Cite or embed
Related exhibits
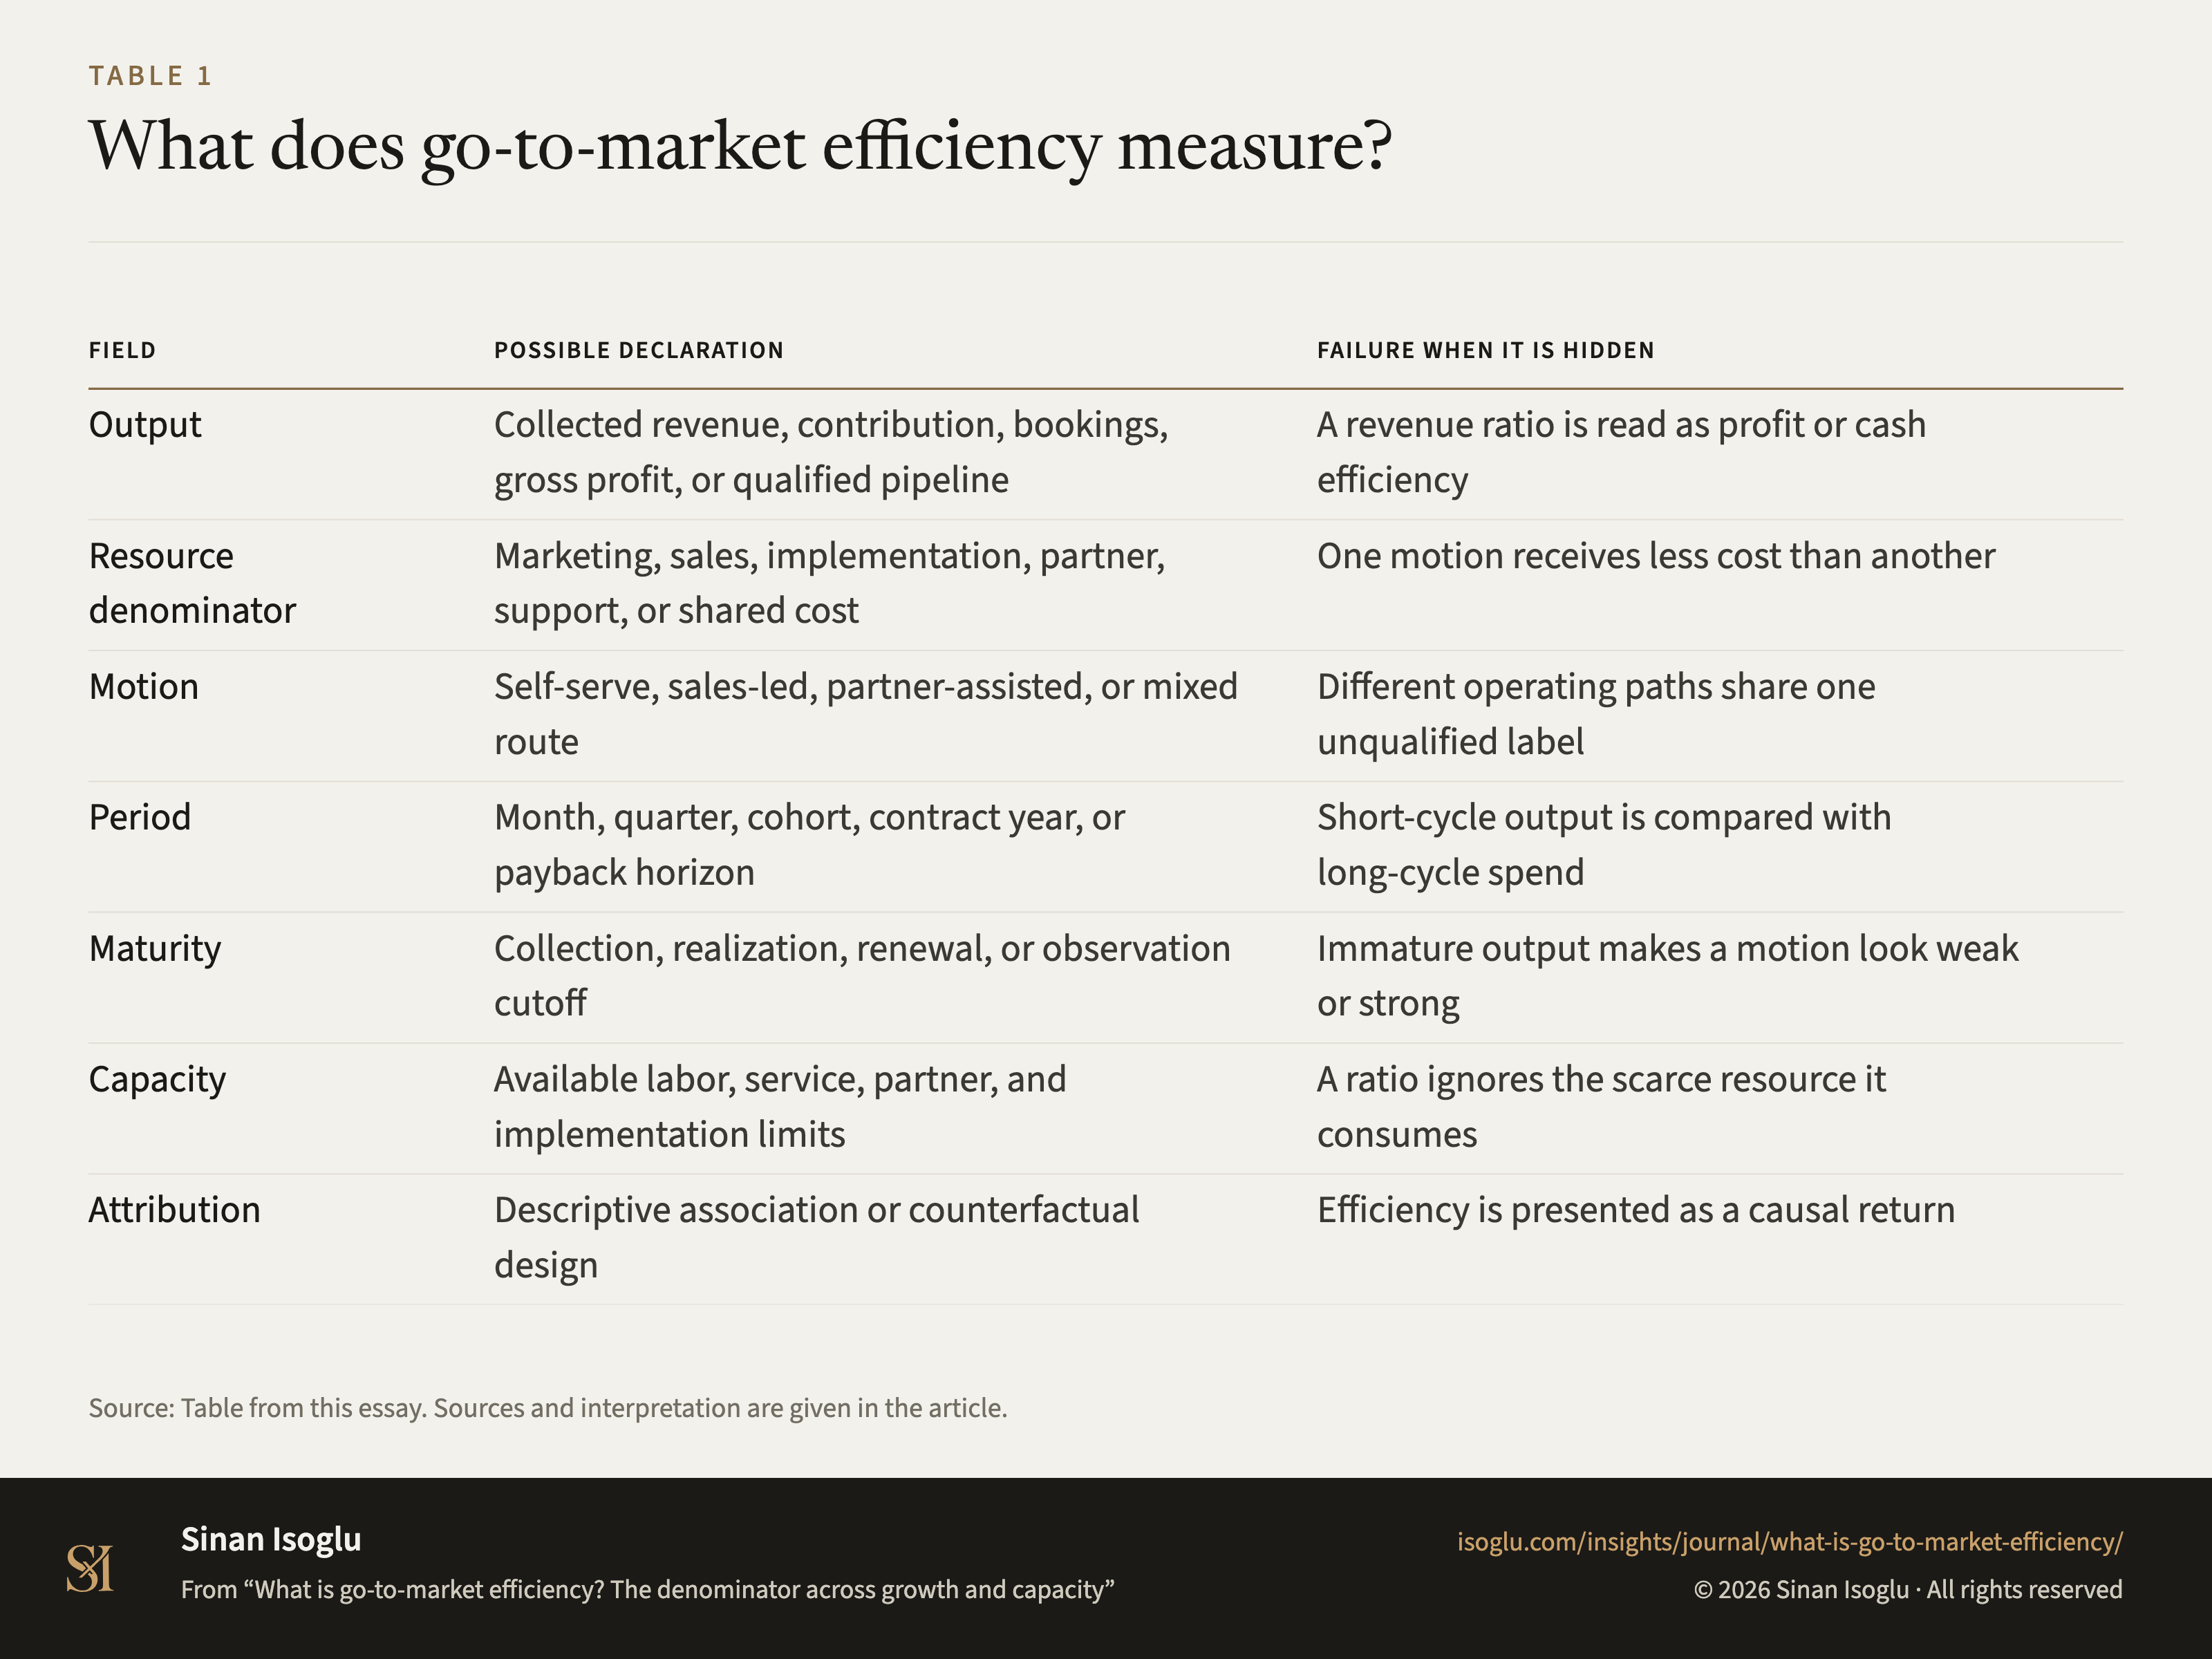
Table 1Table
What does go-to-market efficiency measure?
What is go-to-market efficiency? The denominator across growth and capacity
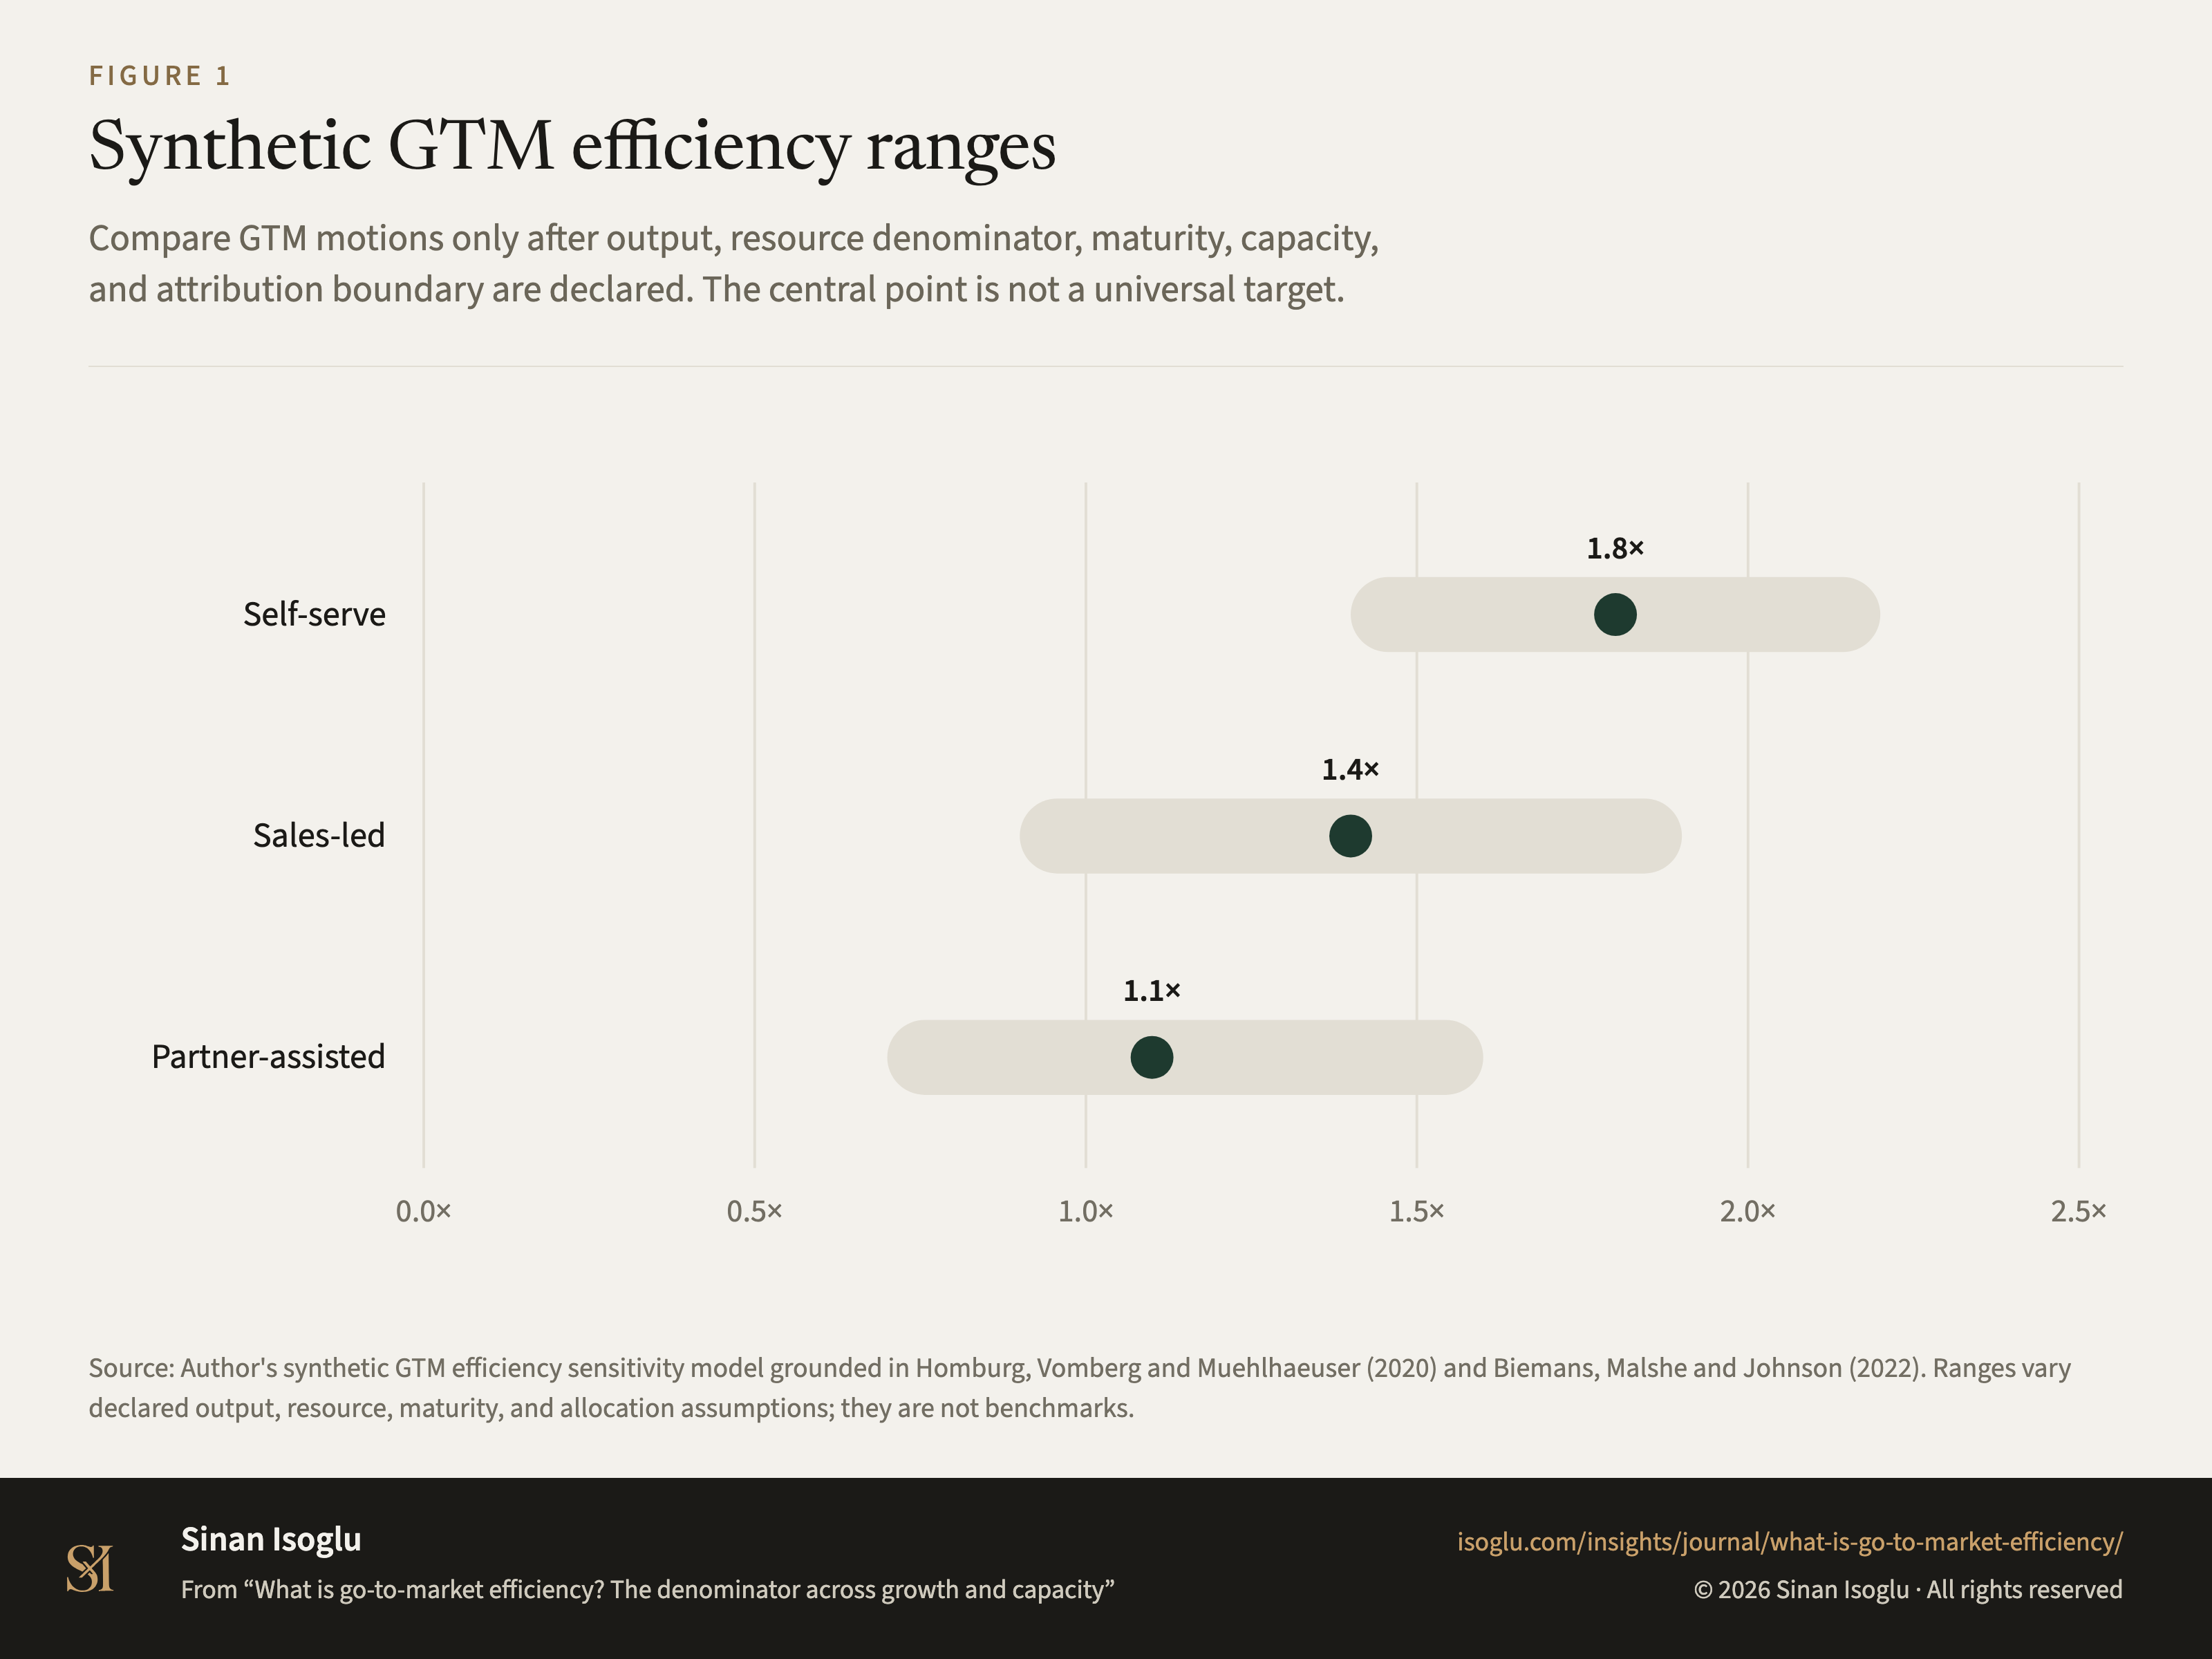
Figure 1Figure
Synthetic GTM efficiency ranges
What is go-to-market efficiency? The denominator across growth and capacity
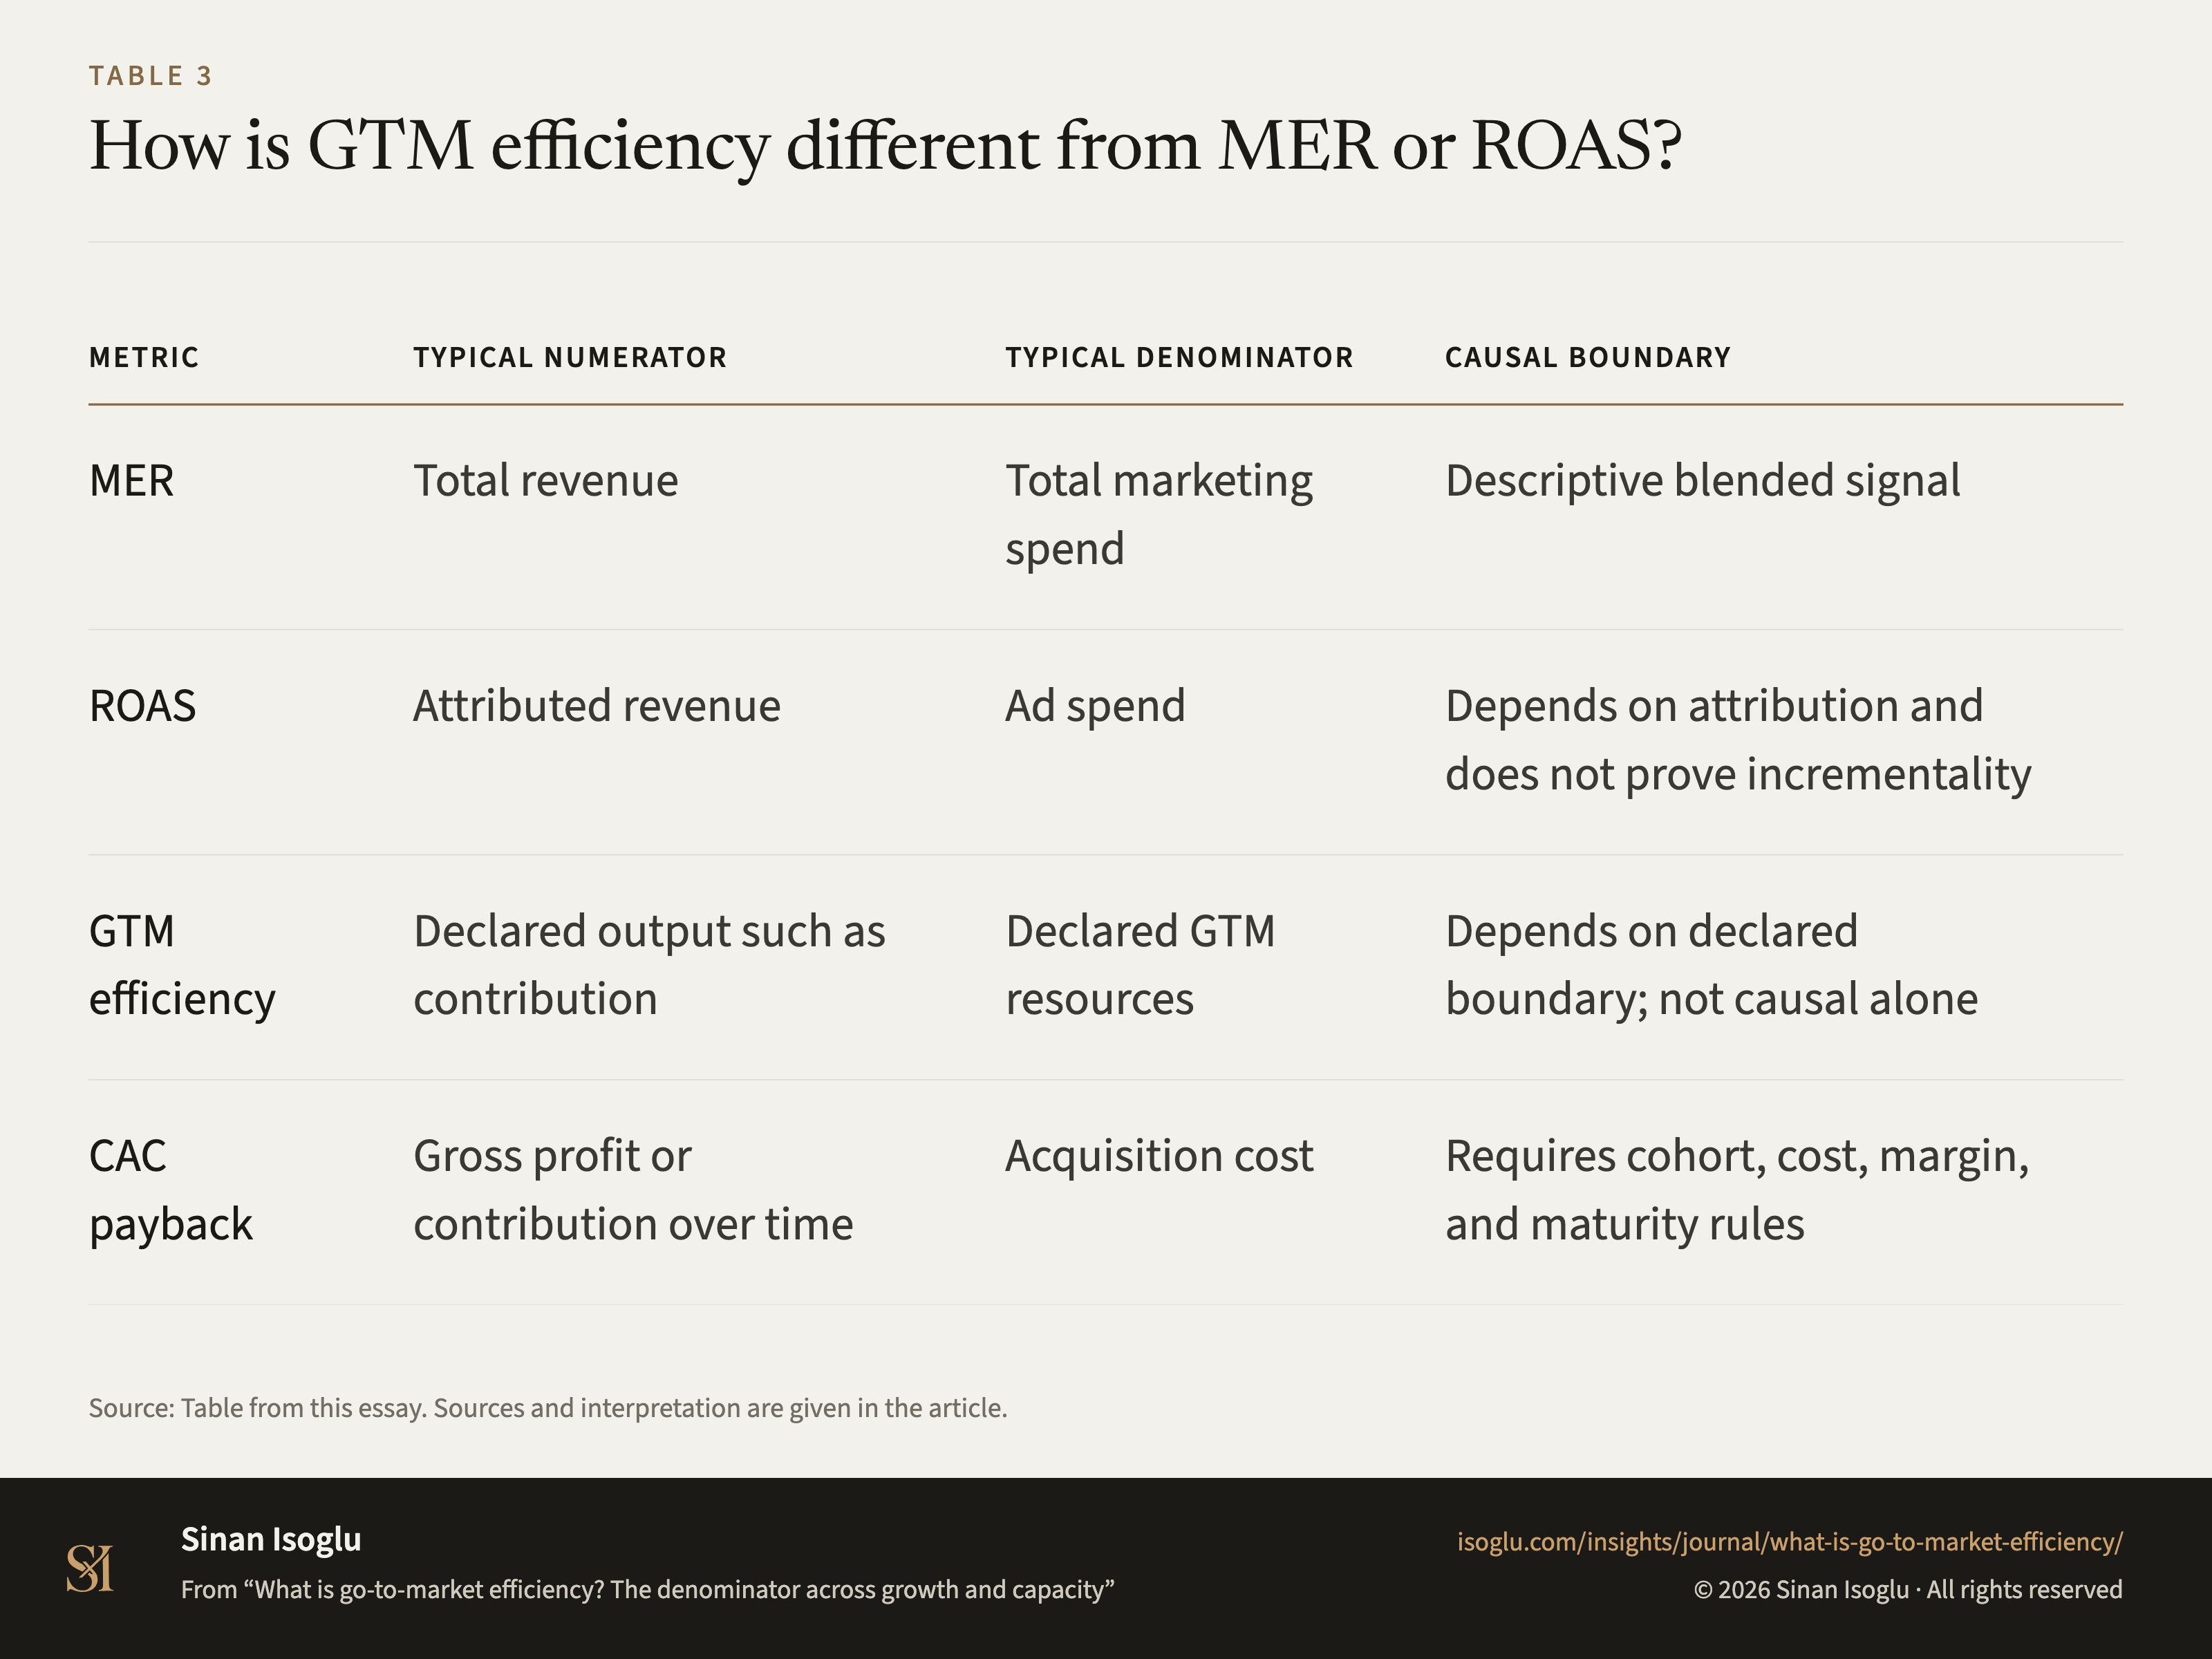
Table 3Table
How is GTM efficiency different from MER or ROAS?
What is go-to-market efficiency? The denominator across growth and capacity
Contact
Bring the question you're working on.
Research, a guest lecture, or a commercial question.