Figure 1From “What is customer satisfaction?”
How eleven satisfaction and loyalty metrics correlated with revenue change in two industries
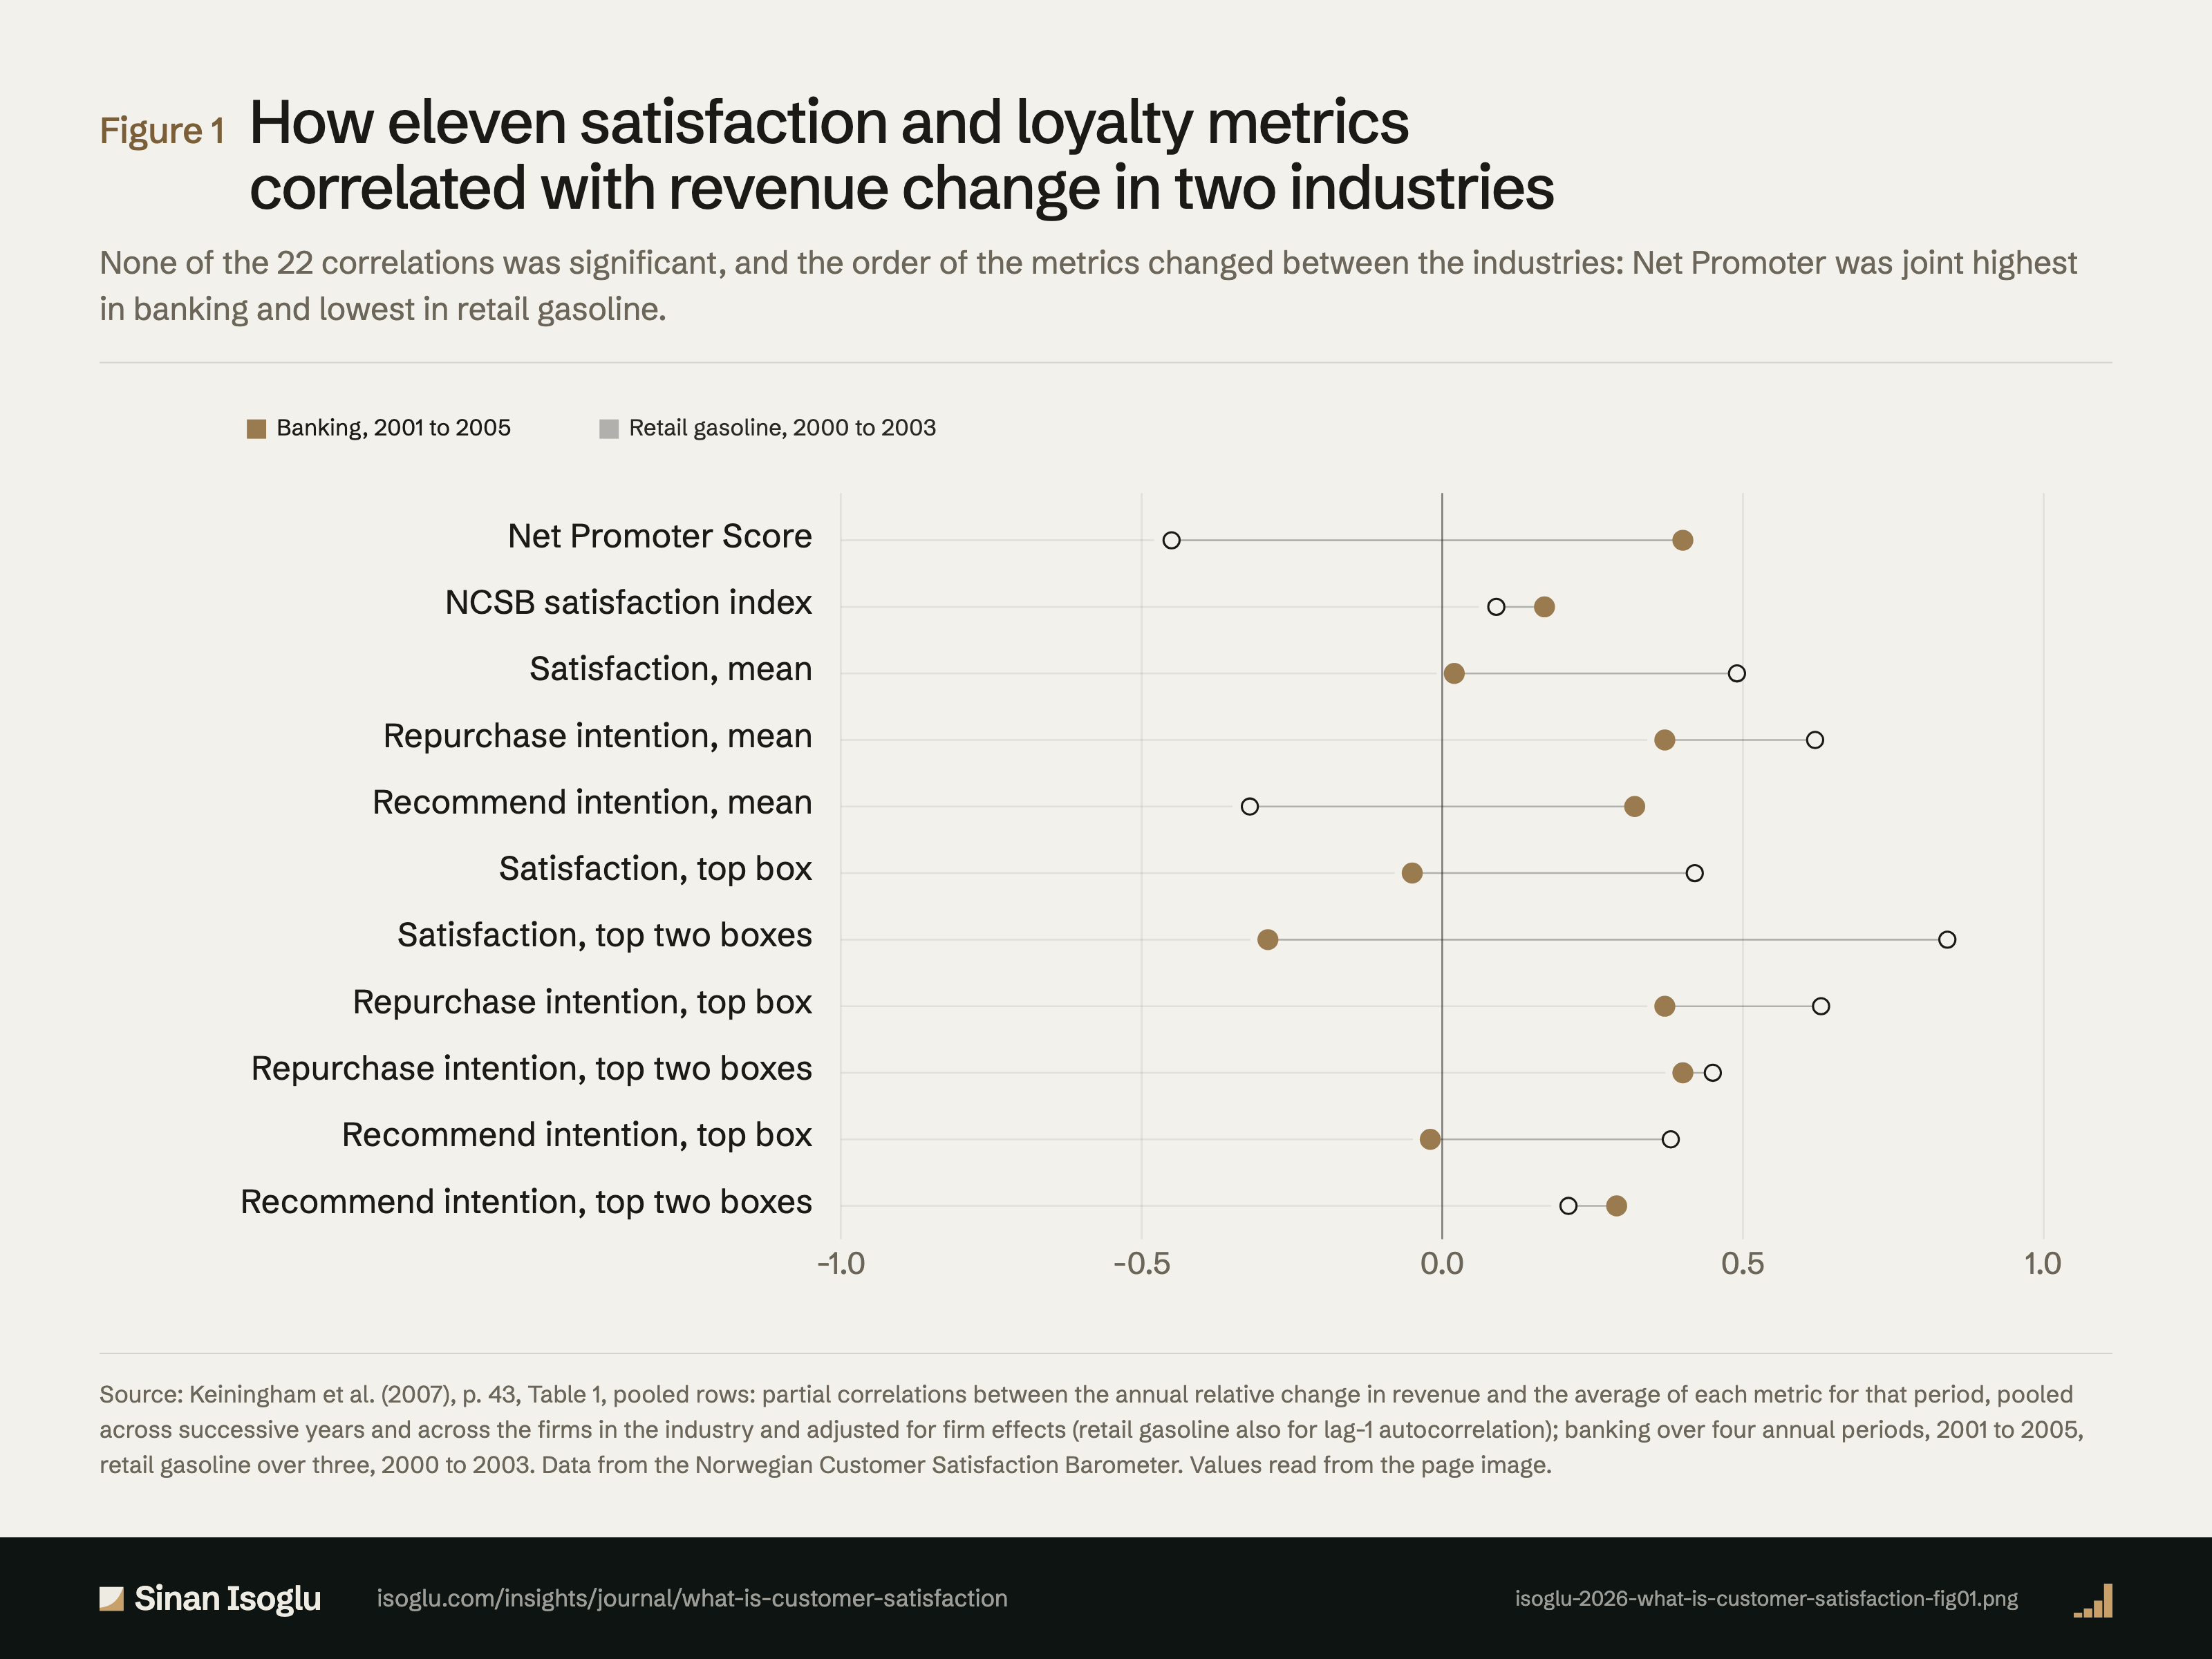
None of the 22 correlations was significant, and the order of the metrics changed between the industries: Net Promoter was joint highest in banking and lowest in retail gasoline.
Figure 1How eleven satisfaction and loyalty metrics correlated with revenue change in two industries
Source: Keiningham et al. (2007), p. 43, Table 1, pooled rows: partial correlations between the annual relative change in revenue and the average of each metric for that period, pooled across successive years and across the firms in the industry and adjusted for firm effects (retail gasoline also for lag-1 autocorrelation); banking over four annual periods, 2001 to 2005, retail gasoline over three, 2000 to 2003. Data from the Norwegian Customer Satisfaction Barometer. Values read from the page image.
Source and evidence
Each line names a claim related to this exhibit, its source, and how it was checked.
- A KCAA07-C3 Table 1 (p. 43): no real indication that any of the eleven metrics is significantly correlated with relative change in revenue within industry; pooled partial correlations adjusted for firm effects (gasoline also for lag-1 autocorrelation), banking over four annual periods 2001 to 2005 and retail gasoline over three 2000 to 2003; pooled values, banking then gasoline, in the order Net Promoter, NCSB, satisfaction (M), repurchase (M), recommend (M), satisfaction top box, top two box, repurchase top box, top two box, recommend top box, top two box: 0.40, 0.17, 0.02, 0.37, 0.32, −0.05, −0.29, 0.37, 0.40, −0.02, 0.29 (p 0.20, 0.60, 0.95, 0.24, 0.32, 0.88, 0.37, 0.23, 0.20, 0.96, 0.36) and −0.45, 0.09, 0.49, 0.62, −0.32, 0.42, 0.84, 0.63, 0.45, 0.38, 0.21 (p 0.55, 0.91, 0.51, 0.38, 0.68, 0.58, 0.16, 0.37, 0.55, 0.62, 0.79), read from the page image; a best-subsets model by BIC included none of the metrics, only industry effects (pp. 42 to 44): "Net Promoter in no way would be categorized as the"; "there is no real indication that average levels of any of the satisfaction/loyalty metrics in Table 1 are significantly correlated with the relative change in revenue within the respective industry"; "these correlations are partial correlations after we adjust for firm effects"; "the four annual periods between 2001 and 2005 in the banking industry and for the three annual periods from 2000 to 2003 in the retail gasoline industry"; "did not include any of these metrics; it included only the most significant industry effects"Keiningham, Cooil, Andreassen & Aksoy (2007) · Keiningham, Cooil, Andreassen & Aksoy. (2007)
Grades: A, verified against the printed page of the primary source · B, primary source, text layer only · C, authoritative secondary · D, reported.
From the essay
Growth that compounds
What is customer satisfaction?
Customer satisfaction is a judgement of the quality received against the quality expected. In one large survey, shortfalls weighed more than surpluses.
Read the essayThis exhibit belongs to an essay: the numbers live here, the argument lives there.
Cite or embed
Related exhibits
Contact
Bring the question you're working on.
Research, a guest lecture, or a commercial question.