Figure 2From “What the customer relationship costs while it stays”
One severance, two directions
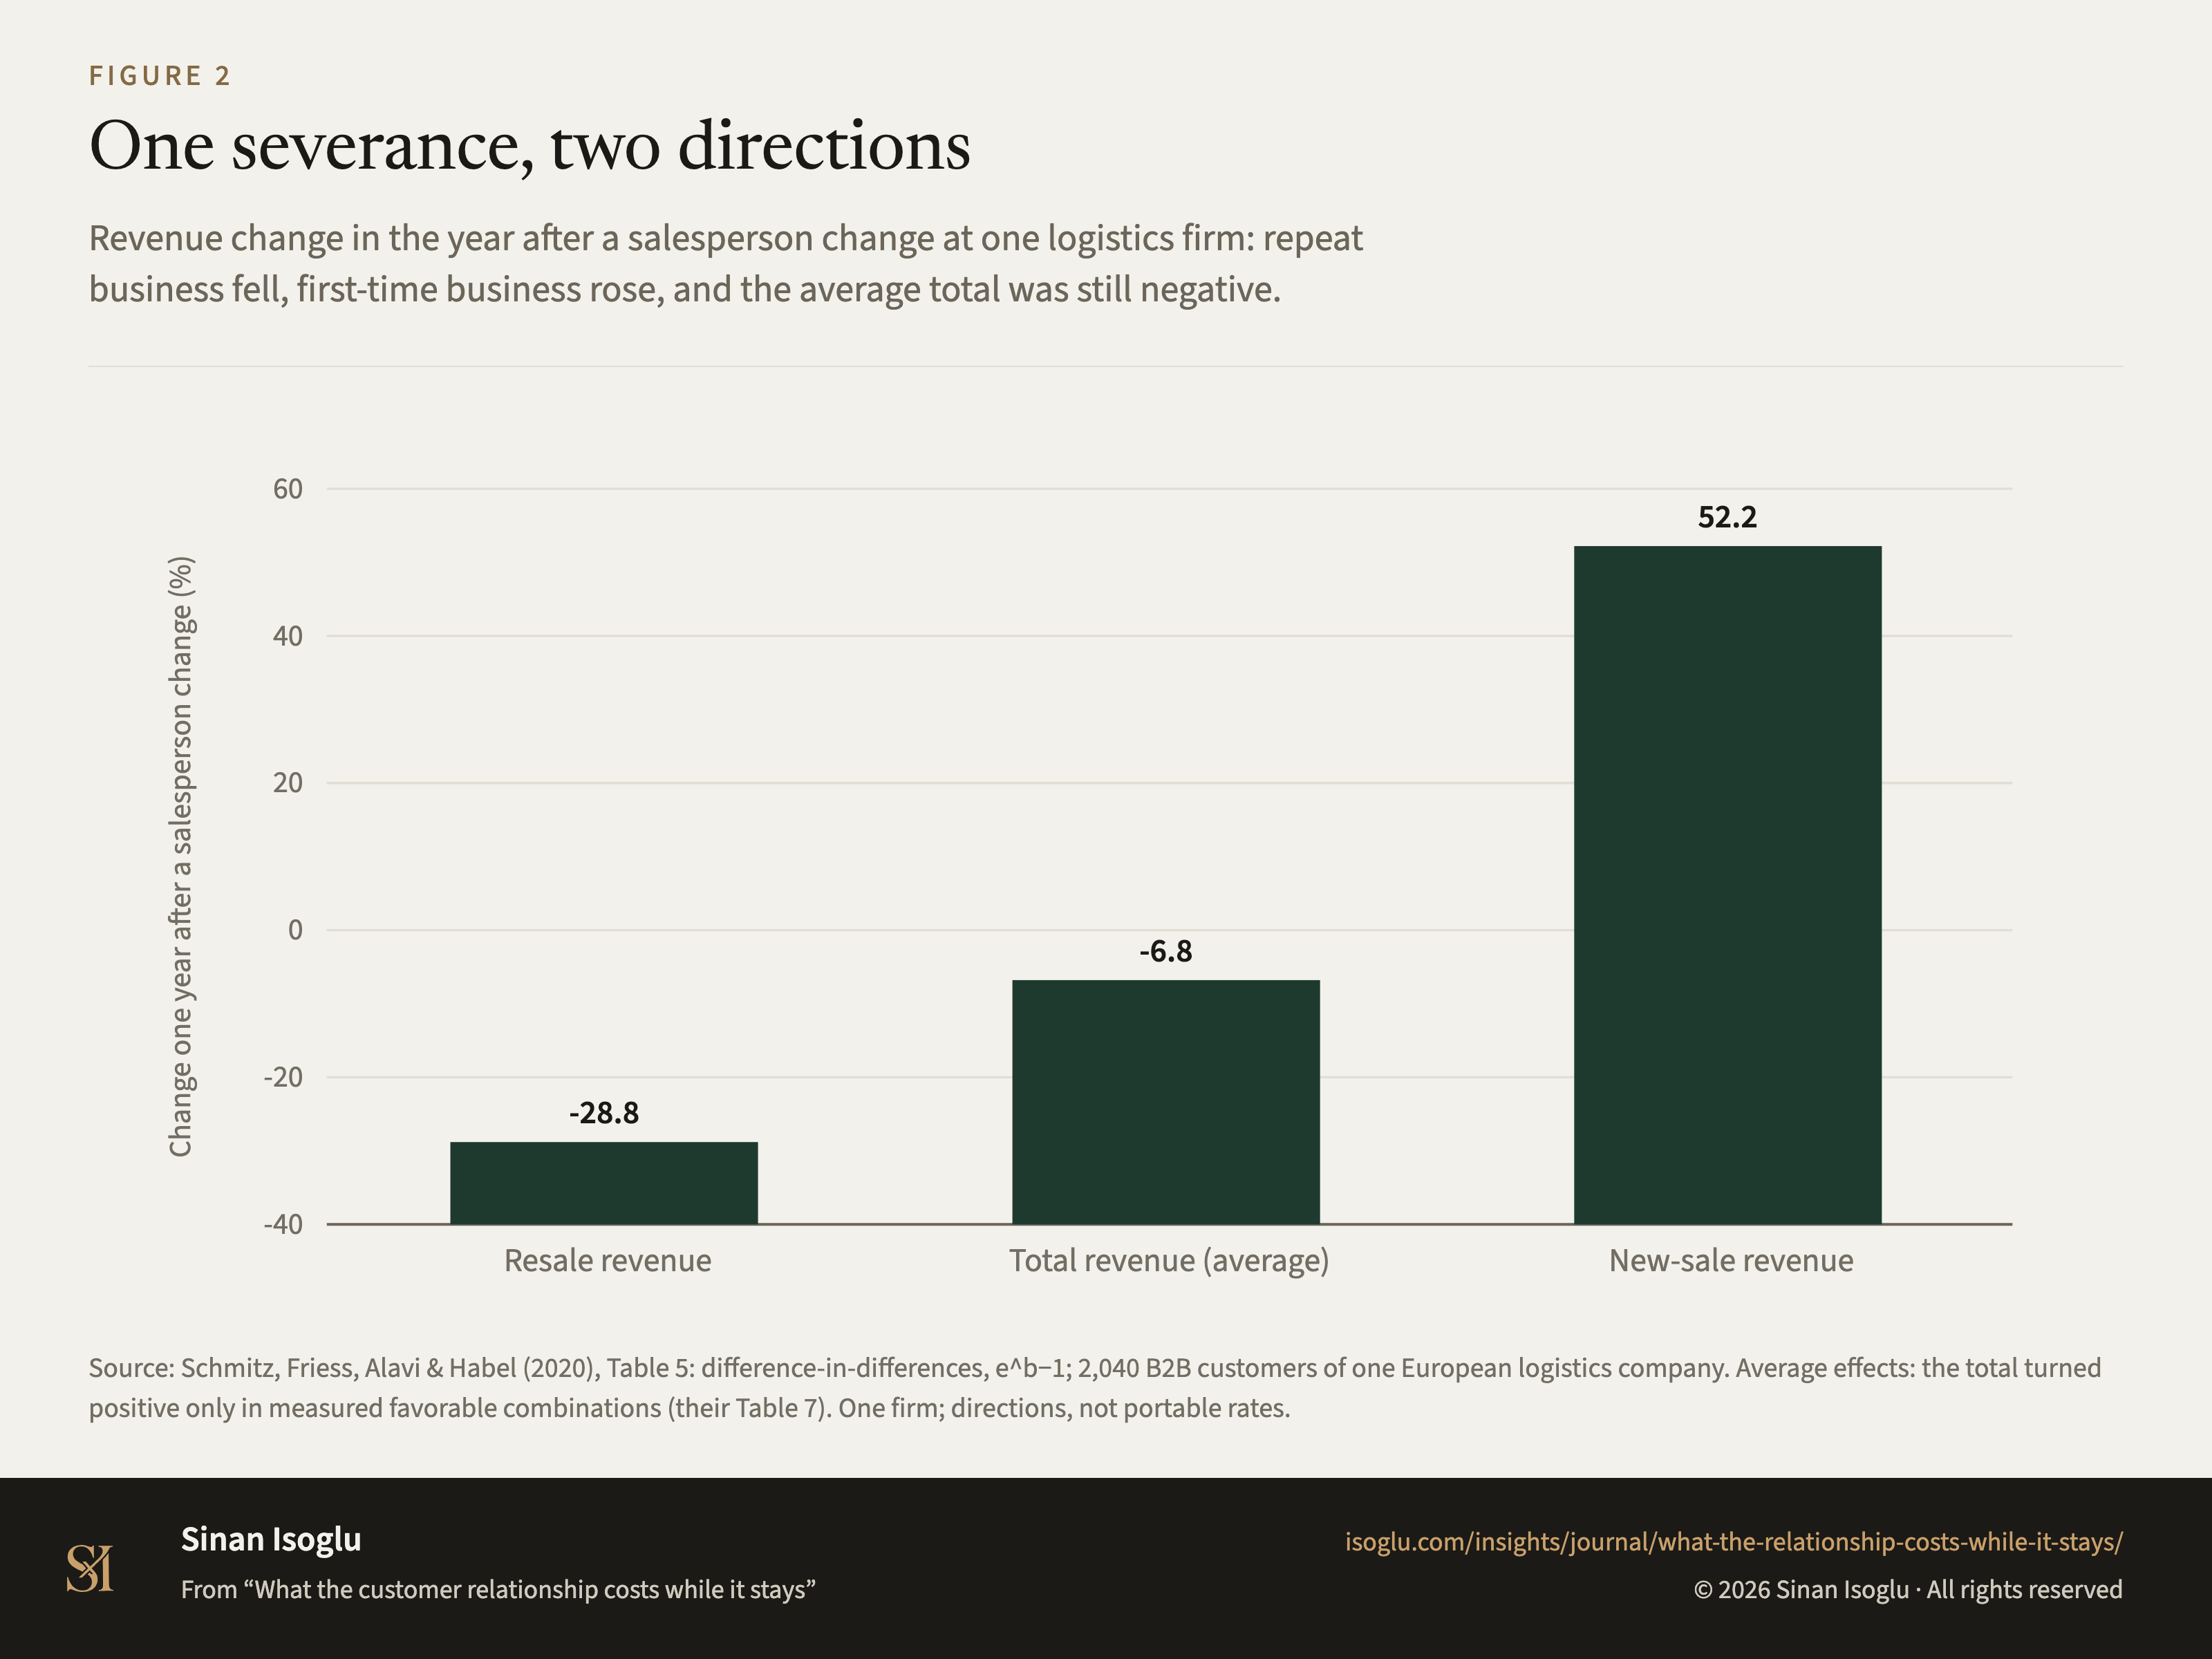
Revenue change in the year after a salesperson change at one logistics firm: repeat business fell, first-time business rose, and the average total was still negative.
Figure 2One severance, two directions
Source: Schmitz, Friess, Alavi & Habel (2020), Table 5: difference-in-differences, e^b−1; 2,040 B2B customers of one European logistics company. Average effects: the total turned positive only in measured favorable combinations (their Table 7). One firm; directions, not portable rates.
Source and evidence
Each line names a claim related to this exhibit, its source, and how it was checked.
- A SFAH20-C1 The two opposing paths, verbatim: "Data pertaining to 2,040 B2B customers of a leading European logistics company over a four-year period, implemented in a series of difference-in-differences models, reveal that relationship disruptions can decrease resale reve""nue by 28.8% but can also increase new sale revenues by 52.2%"Schmitz, Friess, Alavi & Habel (2020), Table 5
- A SFAH20-C2 The total effect is the smaller of the three: "we find that customers who experience a relationship disrup""tion generate 6.8% less total revenue on average"Schmitz, Friess, Alavi & Habel (2020), Table 5
- A SFAH20-C3 The positive totals are conditional, and the design is one firm: "Data pertaining to 2,040 B2B customers of a leading European logistics company over a four-year period, implemented in a series of difference-in-differences models"Schmitz, Friess, Alavi & Habel (2020), implications and Table 7
Grades: A, verified against the printed page of the primary source · B, primary source, text layer only · C, authoritative secondary · D, reported.
From the essay
Growth that compounds
What the customer relationship costs while it stays
Everyone prices the day your best salesperson leaves. The tie has a second cost that runs while they stay: it chooses who your customers are.
Read the essayThis exhibit belongs to an essay: the numbers live here, the argument lives there.
Cite or embed
Contact
Bring the question you're working on.
Research, a guest lecture, or a commercial question.