Figure 1From “What is customer perceived value?”
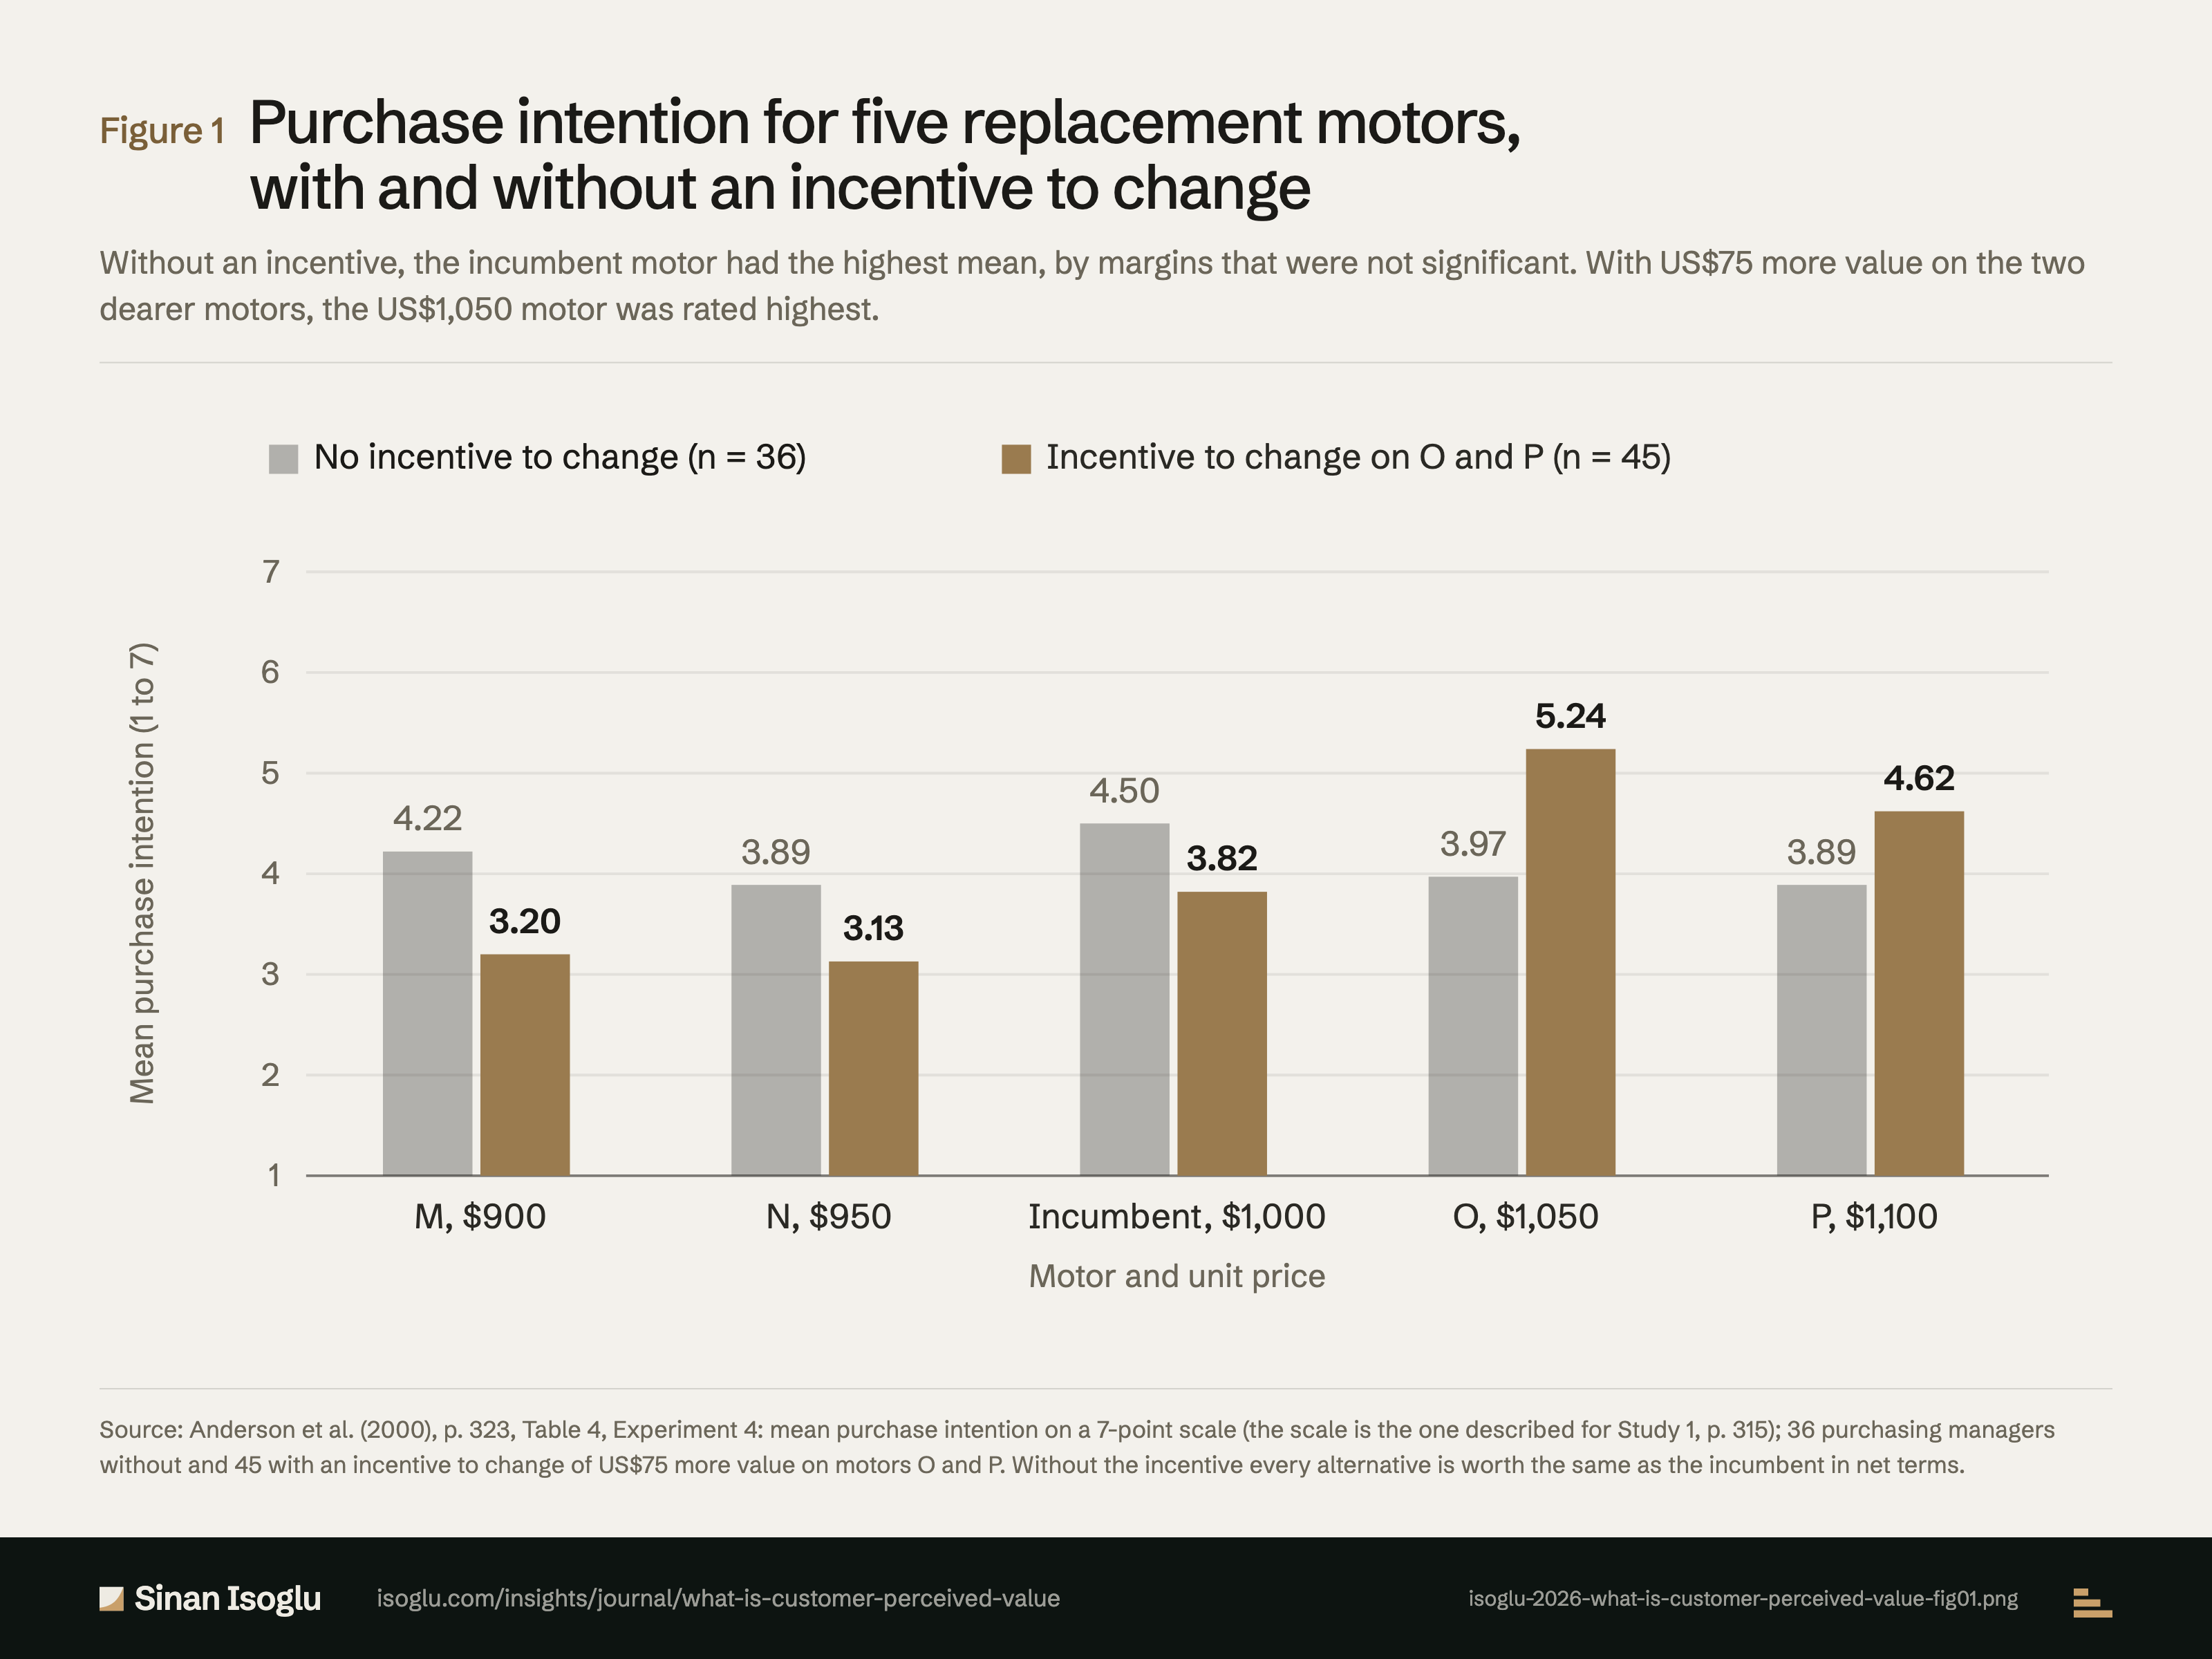
Purchase intention for five replacement motors, with and without an incentive to change
Without an incentive, the incumbent motor had the highest mean, by margins that were not significant. With US$75 more value on the two dearer motors, the US$1,050 motor was rated highest.
Figure 1Purchase intention for five replacement motors, with and without an incentive to change
Source: Anderson et al. (2000), p. 323, Table 4, Experiment 4: mean purchase intention on a 7-point scale (the scale is the one described for Study 1, p. 315); 36 purchasing managers without and 45 with an incentive to change of US$75 more value on motors O and P. Without the incentive every alternative is worth the same as the incumbent in net terms.
Source and evidence
Each line names a claim related to this exhibit, its source, and how it was checked.
- A ATW00-C4 Study 2: 10-horsepower replacement motors; 243 sampled, 81 usable, 33%; incumbent US$1,000, M US$900 and N US$950 with US$100 and US$50 less value, O US$1,050 and P US$1,100 with US$50 and US$100 more; incentive of US$75 more value on O and P, 7.5% of the incumbent's price; Table 4 mean purchase intention without (n = 36) 4.22, 3.89, 4.50, 3.97, 3.89 and with (n = 45) 3.20, 3.13, 3.82, 5.24, 4.62 for M, N, incumbent, O, P; between-condition differences significant for M and O, marginal for N and the incumbent, not significant for P; 18% still chose the lowest-price offering first (pp. 320 to 323, 326): "We chose 10-horsepower replacement motors."; "we sent survey packages to a random sample of 243 purchasing managers"; "these research participants returned 81 complete and usable surveys, providing a response rate of 33%"; "This incentive-to-change amount is 7.5% of the reference-offering price."; "18% of purchasing managers still chose the lowest-price, lowest-value offering first"Anderson, Thomson & Wynstra (2000) · Anderson, Thomson & Wynstra. (2000)
Grades: A, verified against the printed page of the primary source · B, primary source, text layer only · C, authoritative secondary · D, reported.
From the essay
Pricing & revenue architecture
What is customer perceived value?
Customer perceived value is what an offering is worth to the customer in use, as the customer sees it. In B2B it is a sum of money that excludes price.
Read the essayThis exhibit belongs to an essay: the numbers live here, the argument lives there.
Cite or embed
Related exhibits
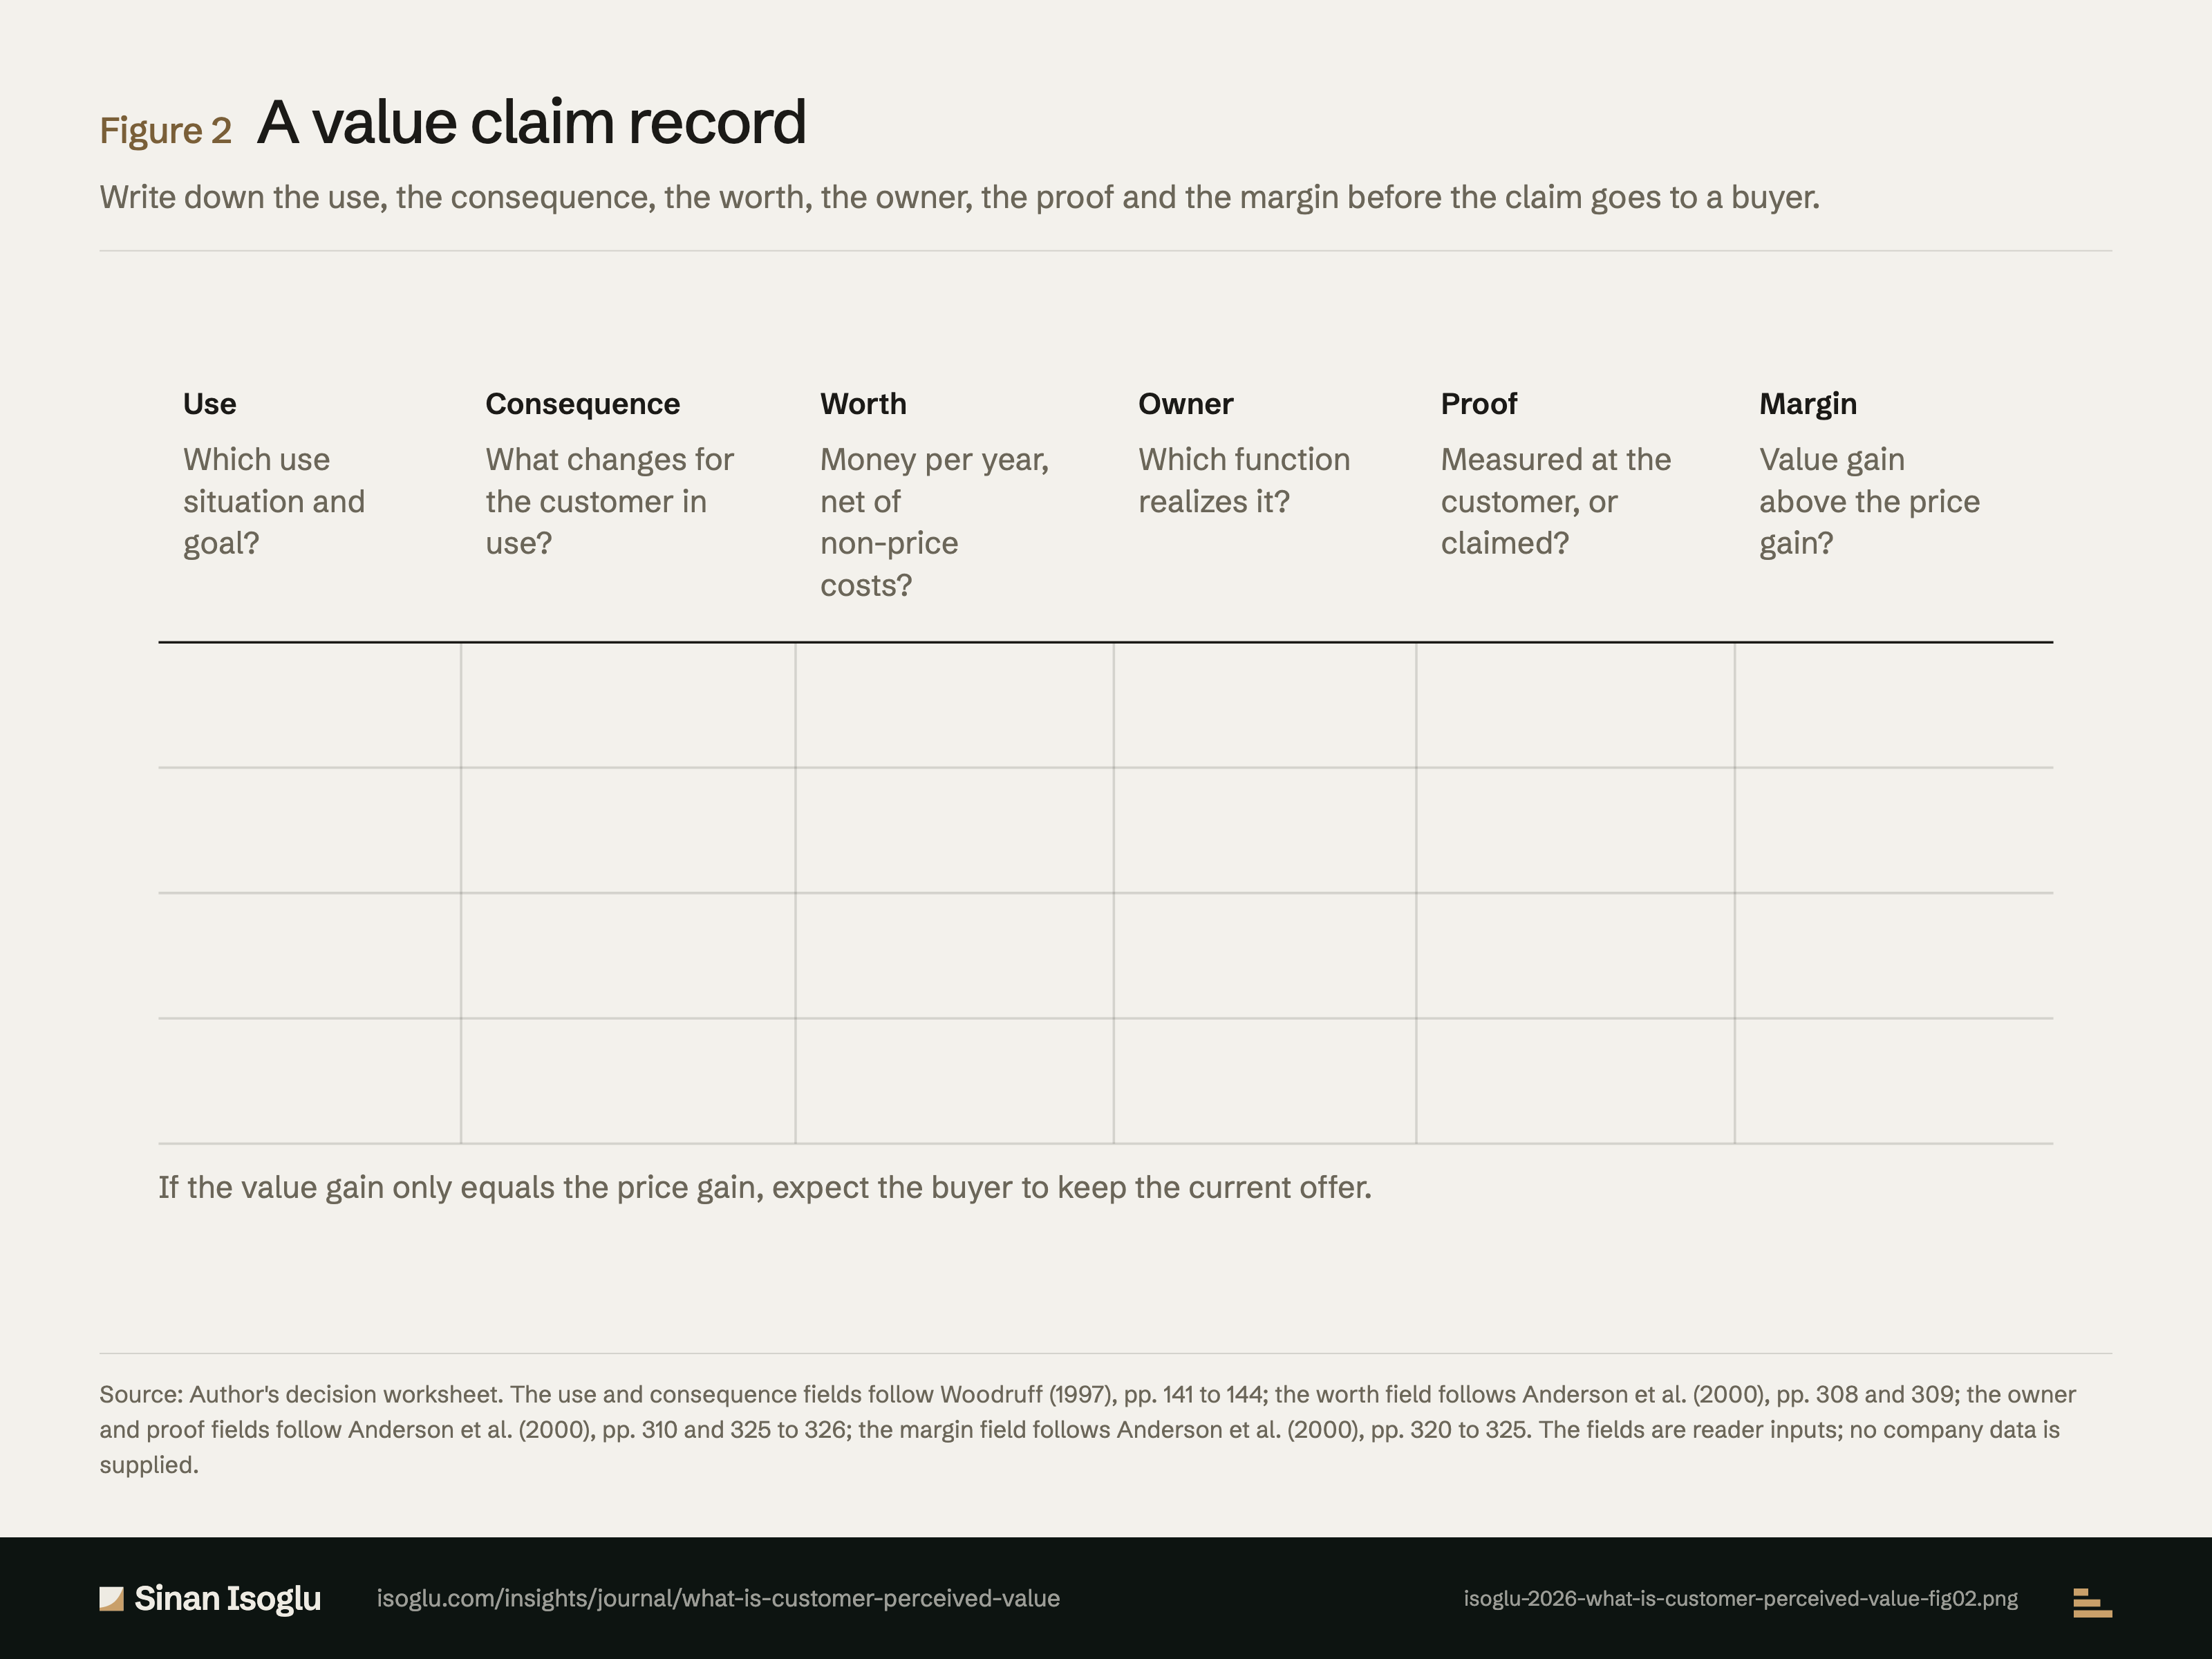
Figure 2Figure
A value claim record
What is customer perceived value?
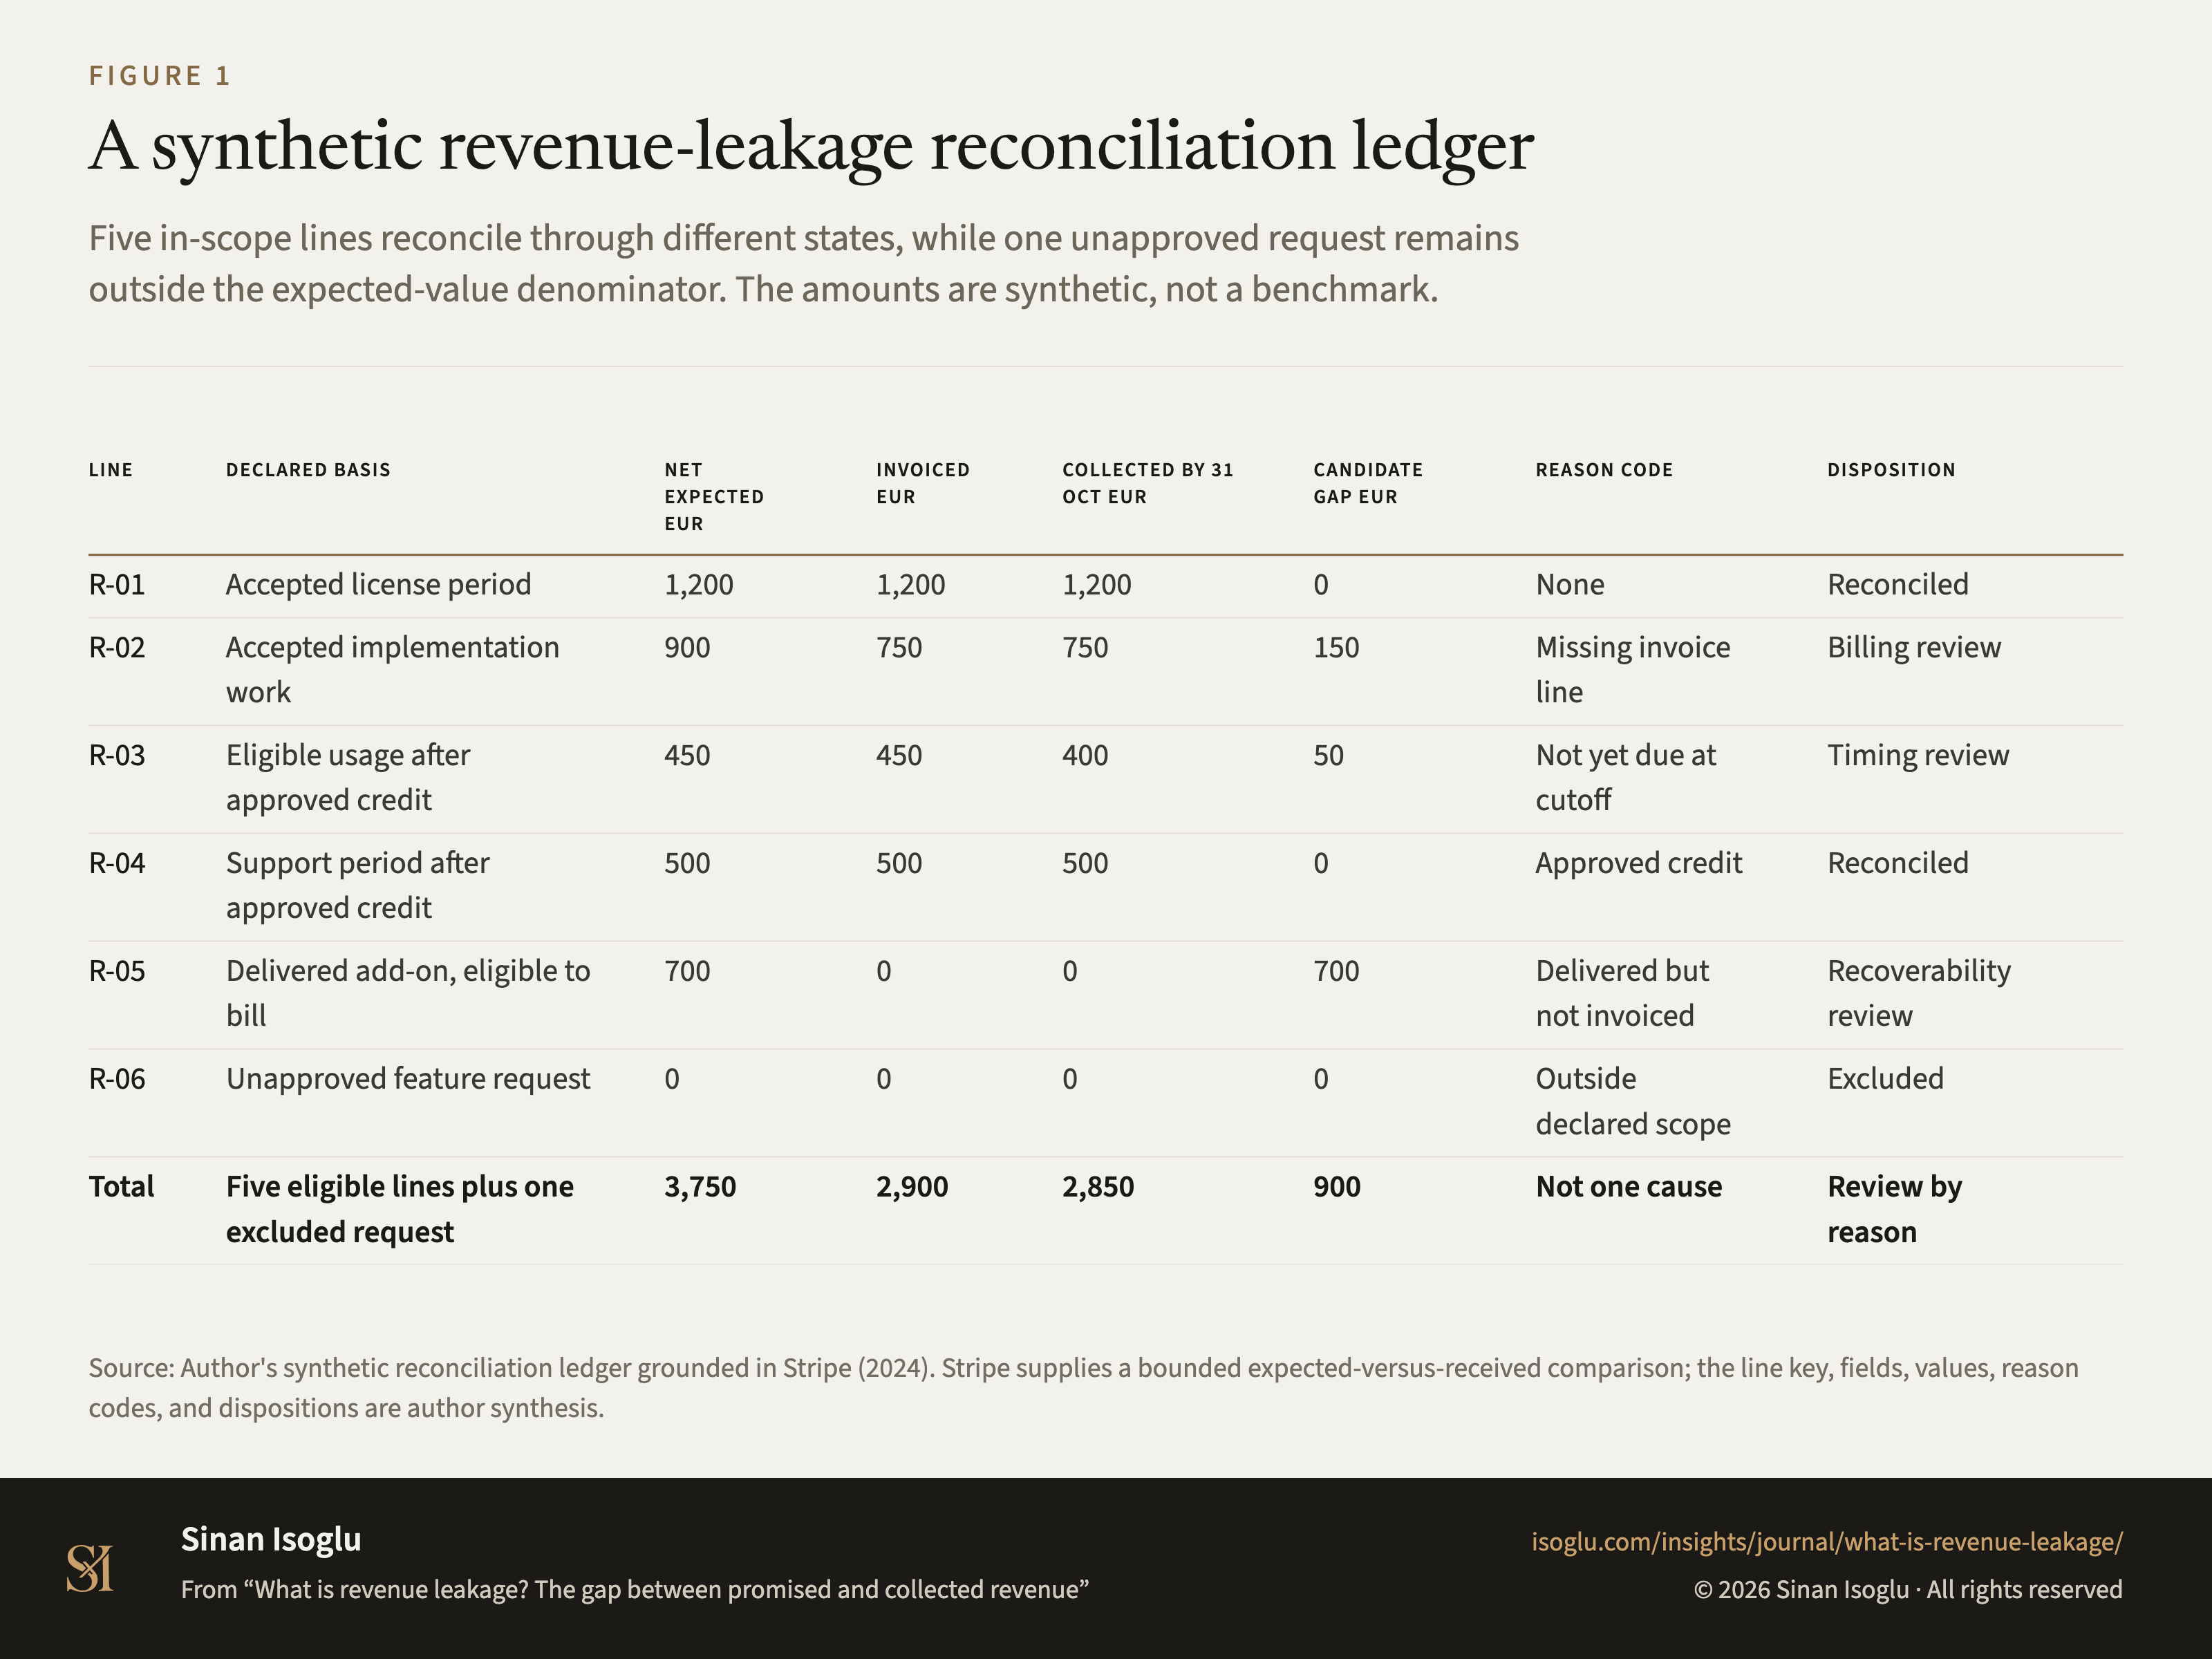
Figure 1Figure
A synthetic revenue-leakage reconciliation ledger
What is revenue leakage? The gap between promised and collected revenue
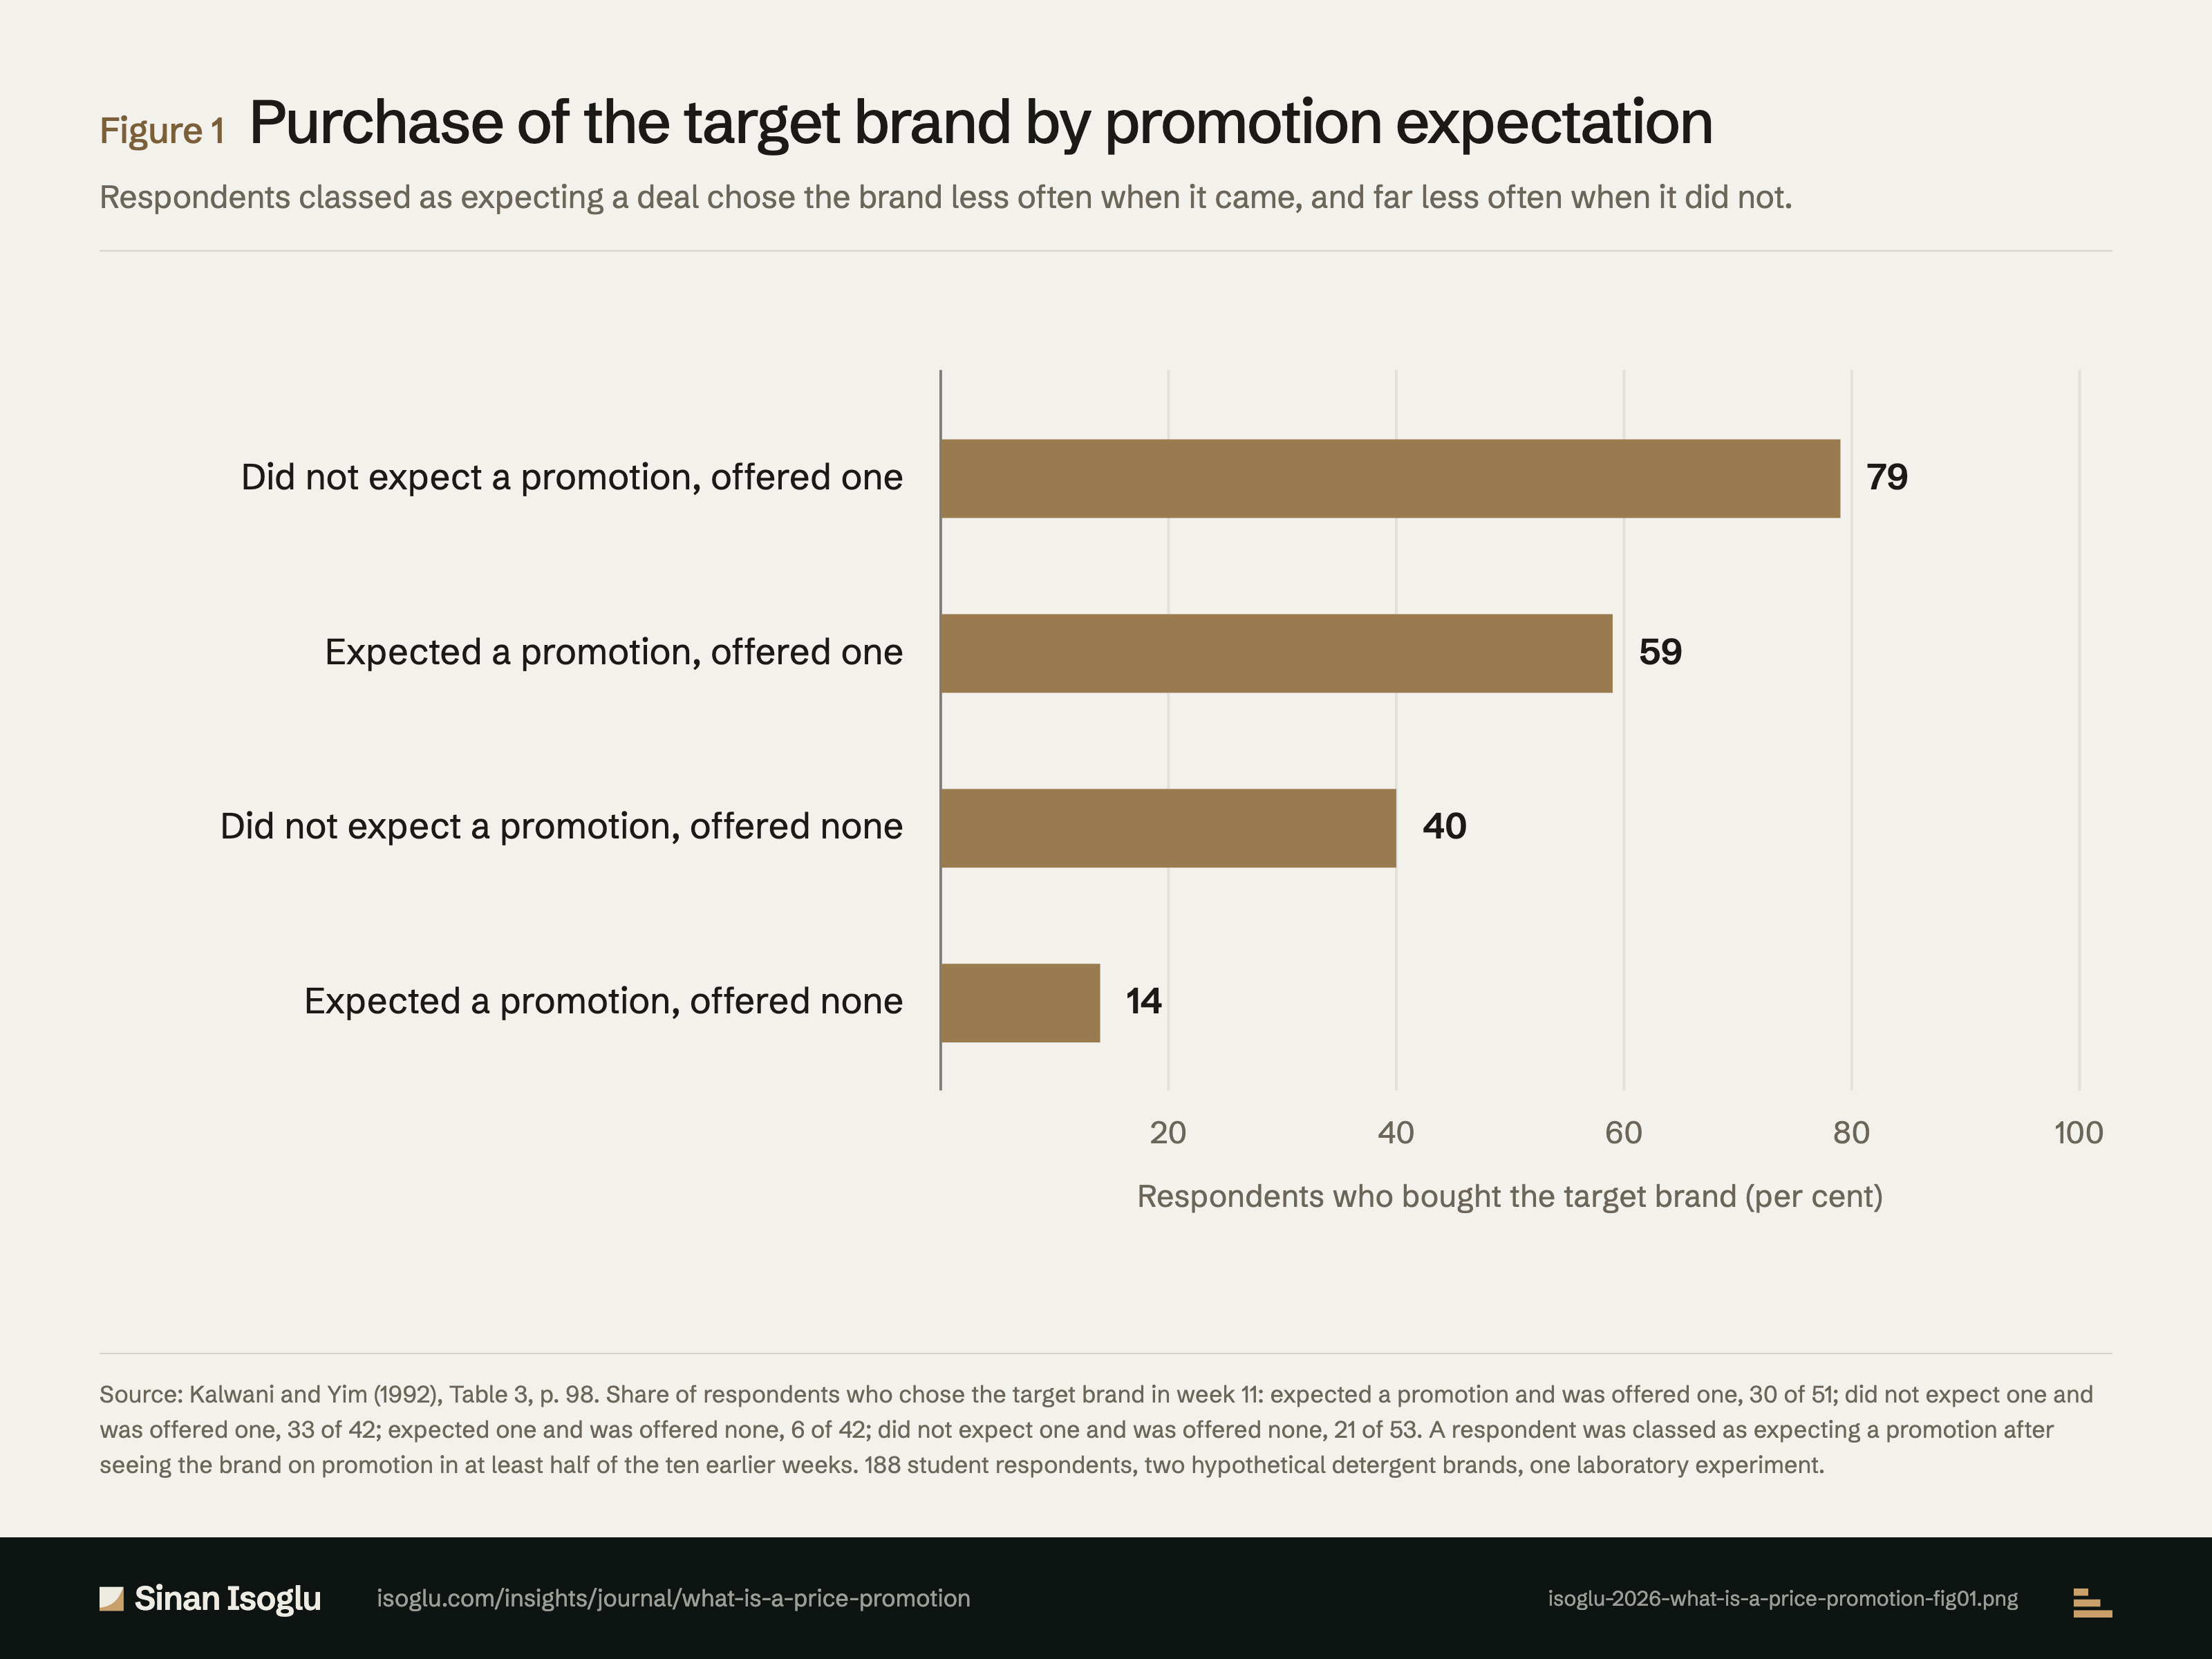
Figure 1Figure
Purchase of the target brand by promotion expectation
What is a price promotion?
Contact
Bring the question you're working on.
Research, a guest lecture, or a commercial question.