← Every exhibit
Table 2From “What are TAM, SAM, and SOM?”
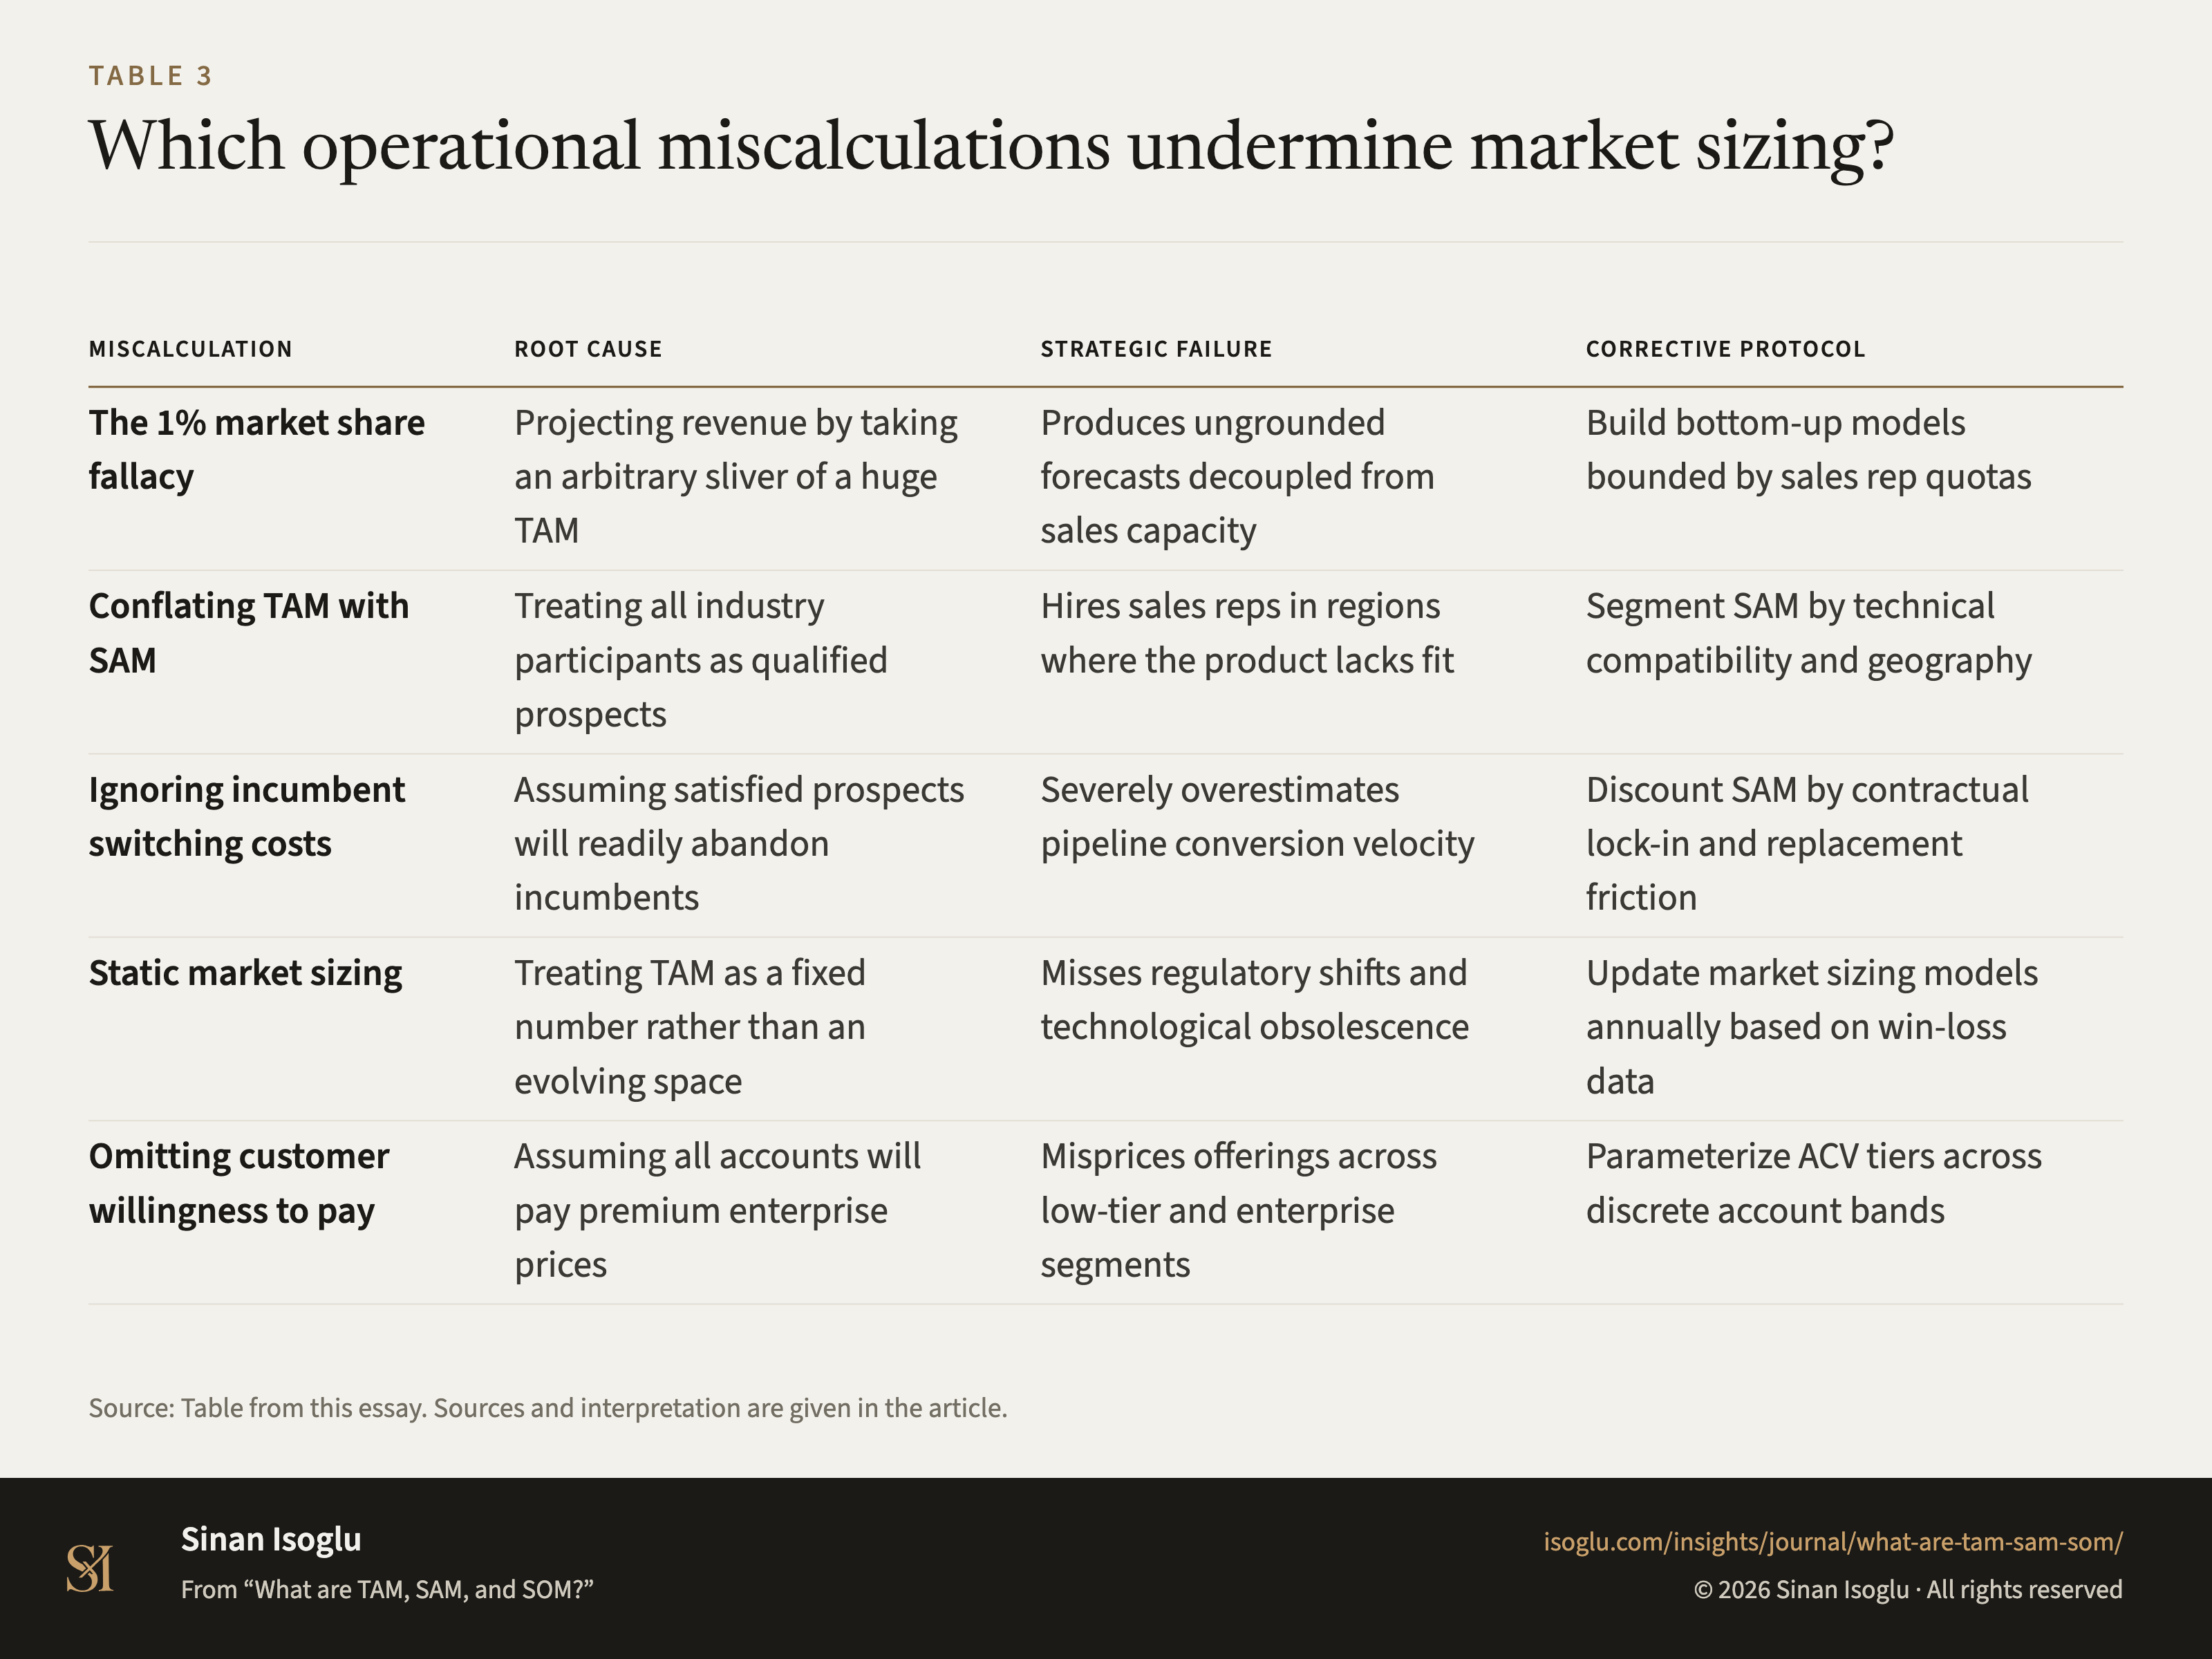
Which operational miscalculations undermine market sizing?
Table 2Which operational miscalculations undermine market sizing?
| Miscalculation | Root cause | Strategic failure | Corrective protocol |
|---|---|---|---|
| The 1% market share fallacy | Projecting revenue by taking an arbitrary sliver of a huge TAM | Produces ungrounded forecasts decoupled from sales capacity | Build bottom-up models bounded by sales rep quotas |
| Conflating TAM with SAM | Treating all industry participants as qualified prospects | Hires sales reps in regions where the product lacks fit | Segment SAM by technical compatibility and geography |
| Ignoring incumbent switching costs | Assuming satisfied prospects will readily abandon incumbents | Severely overestimates pipeline conversion velocity | Discount SAM by contractual lock-in and replacement friction |
| Static market sizing | Treating TAM as a fixed number rather than an evolving space | Misses regulatory shifts and technological obsolescence | Update market sizing models annually based on win-loss data |
| Omitting customer willingness to pay | Assuming all accounts will pay premium enterprise prices | Misprices offerings across low-tier and enterprise segments | Parameterize ACV tiers across discrete account bands |
Swipe or scroll horizontally if the table is wider than your screen.
Source: Table from this essay. Sources and interpretation are given in the article.
PNG4:3, 1600 × 1200, with the title, the source line and the attribution set in the image isoglu-2026-what-are-tam-sam-som-fig03.png
From the essay
Go-to-market strategy
What are TAM, SAM, and SOM?
TAM, SAM, and SOM establish a nested market sizing architecture that separates aggregate theoretical demand from operational go-to-market capacity.
Read the essayThis exhibit belongs to an essay: the numbers live here, the argument lives there.
Cite or embed
Contact
Bring the question you're working on.
Research, a guest lecture, or a commercial question.