← Every exhibit
Table 1From “What are TAM, SAM, and SOM?”
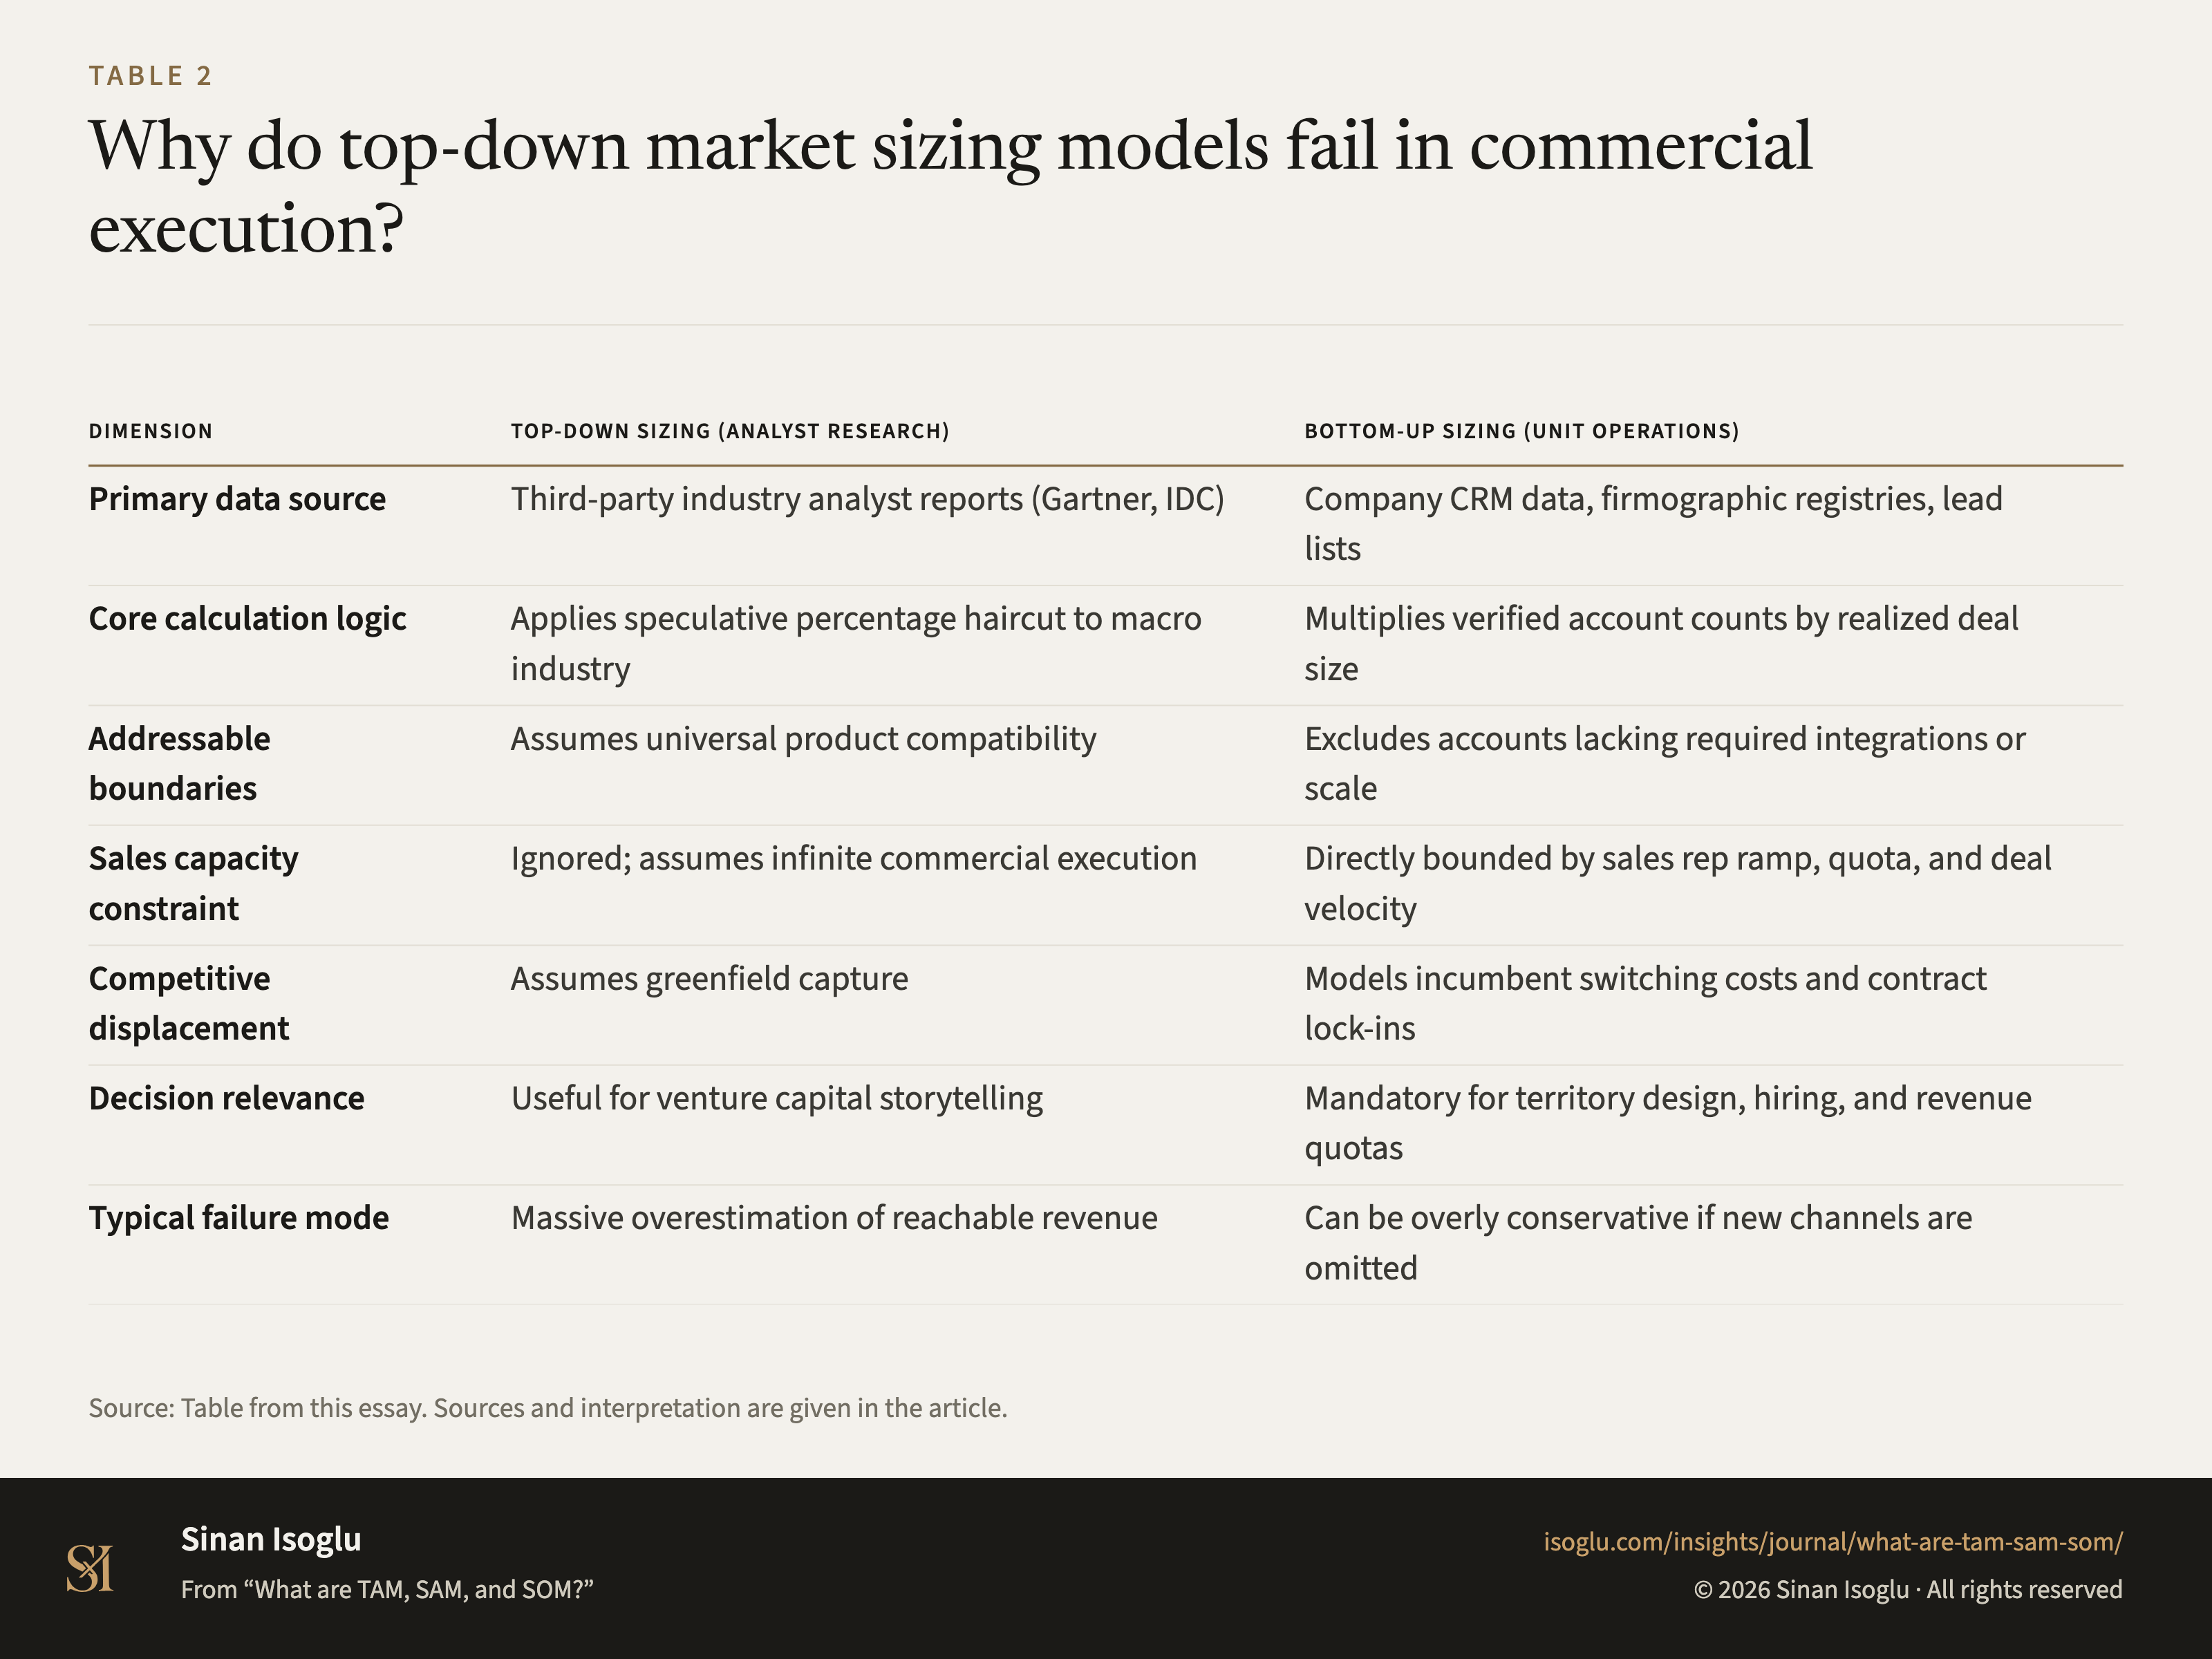
Why do top-down market sizing models fail in commercial execution?
Table 1Why do top-down market sizing models fail in commercial execution?
| Dimension | Top-Down Sizing (Analyst Research) | Bottom-Up Sizing (Unit Operations) |
|---|---|---|
| Primary data source | Third-party industry analyst reports (Gartner, IDC) | Company CRM data, firmographic registries, lead lists |
| Core calculation logic | Applies speculative percentage haircut to macro industry | Multiplies verified account counts by realized deal size |
| Addressable boundaries | Assumes universal product compatibility | Excludes accounts lacking required integrations or scale |
| Sales capacity constraint | Ignored; assumes infinite commercial execution | Directly bounded by sales rep ramp, quota, and deal velocity |
| Competitive displacement | Assumes greenfield capture | Models incumbent switching costs and contract lock-ins |
| Decision relevance | Useful for venture capital storytelling | Mandatory for territory design, hiring, and revenue quotas |
| Typical failure mode | Massive overestimation of reachable revenue | Can be overly conservative if new channels are omitted |
Swipe or scroll horizontally if the table is wider than your screen.
Source: Table from this essay. Sources and interpretation are given in the article.
PNG4:3, 1600 × 1200, with the title, the source line and the attribution set in the image isoglu-2026-what-are-tam-sam-som-fig02.png
From the essay
Go-to-market strategy
What are TAM, SAM, and SOM?
TAM, SAM, and SOM establish a nested market sizing architecture that separates aggregate theoretical demand from operational go-to-market capacity.
Read the essayThis exhibit belongs to an essay: the numbers live here, the argument lives there.
Cite or embed

Contact
Bring the question you're working on.
Research, a guest lecture, or a commercial question.