Figure 5From “MQL and SQL: what are marketing- and sales-qualified leads?”
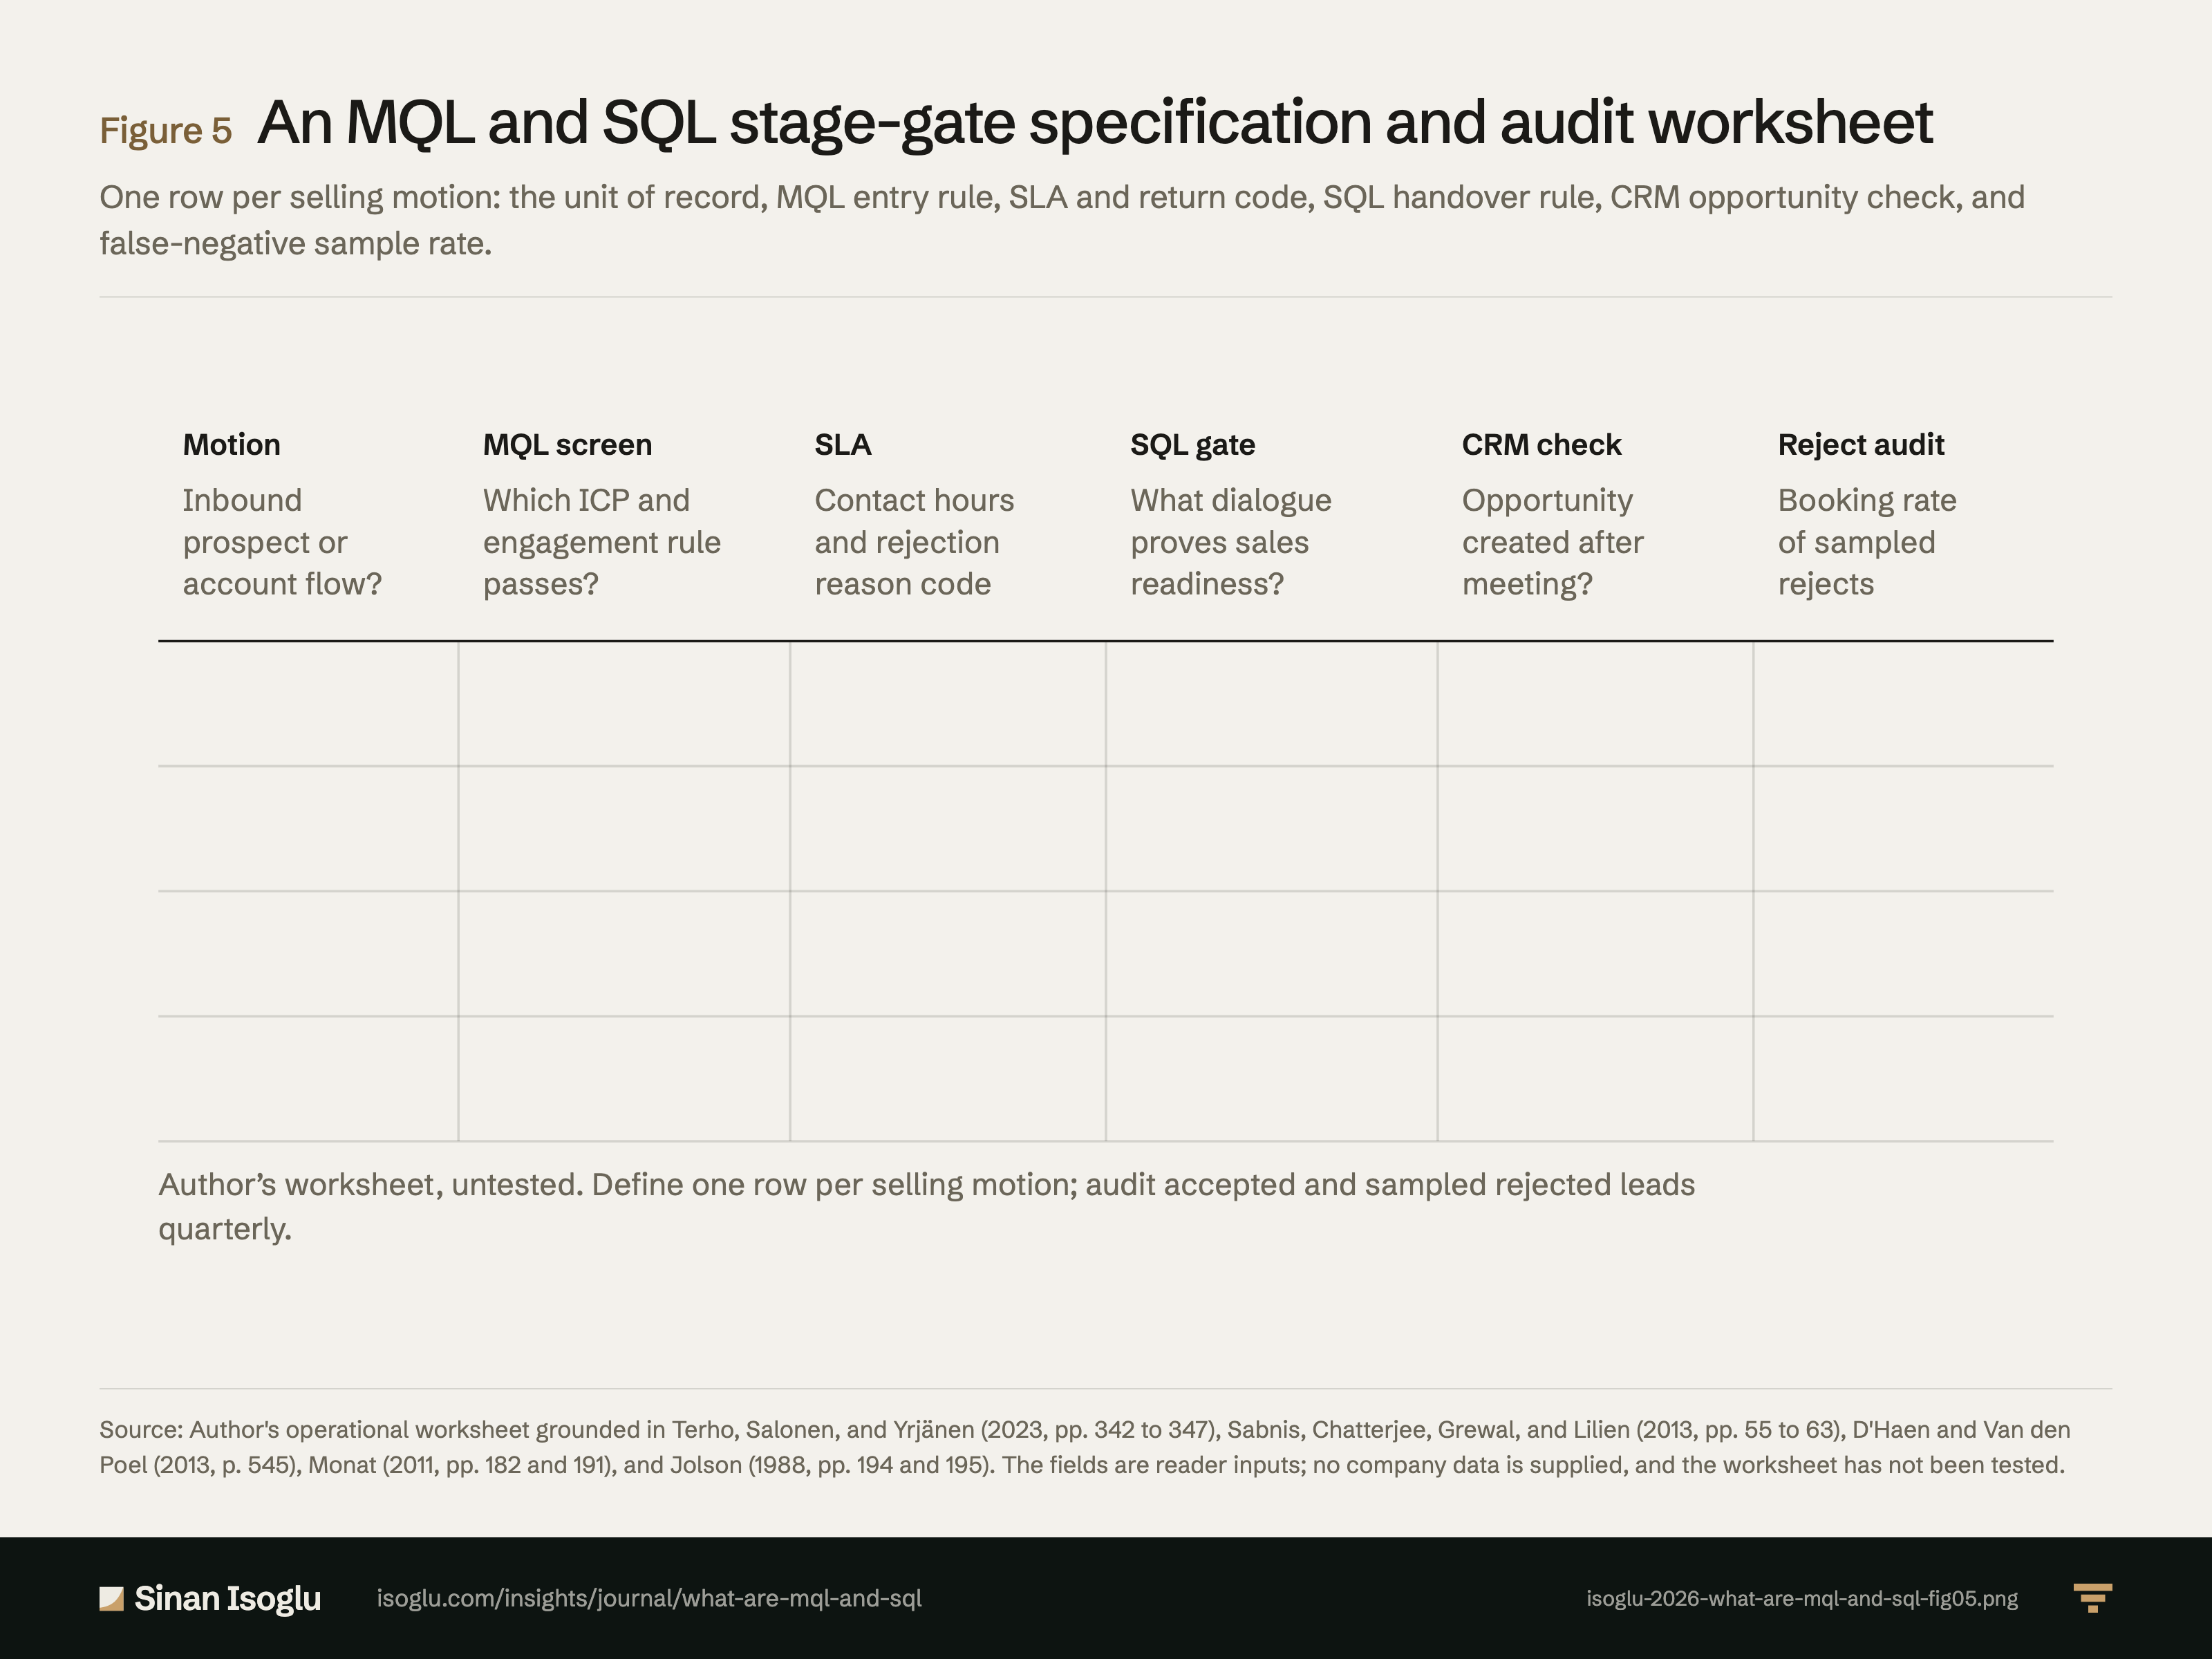
An MQL and SQL stage-gate specification and audit worksheet
One row per selling motion: the unit of record, MQL entry rule, SLA and return code, SQL handover rule, CRM opportunity check, and false-negative sample rate.
Figure 5An MQL and SQL stage-gate specification and audit worksheet
Source: Author's operational worksheet grounded in Terho, Salonen, and Yrjänen (2023, pp. 342 to 347), Sabnis, Chatterjee, Grewal, and Lilien (2013, pp. 55 to 63), D'Haen and Van den Poel (2013, p. 545), Monat (2011, pp. 182 and 191), and Jolson (1988, pp. 194 and 195). The fields are reader inputs; no company data is supplied, and the worksheet has not been tested.
Source and evidence
Each line names a claim related to this exhibit, its source, and how it was checked.
- B A verified against the printed page of the primary sourceB primary source, text layer onlyC authoritative secondaryD reported An MQL-to-SQL stage-gate specification names the entry criteria for both gates, the owner and SLA at handover, the structured rejection reason when a lead is returned, and a periodic audit of both accepted and rejected leads against downstream opportunity creation and bookingsAuthor operating framework
- A A verified against the printed page of the primary sourceB primary source, text layer onlyC authoritative secondaryD reported Four sales development contexts differ by incoming lead source and sales complexity (pp. 342 to 345): "The data analysis further pointed out four key types of sales development that notably differ by the nature of the incoming leads and the complexity of the lead management process, as illustrated in Figure 2."; "an SDR can pick up “inbound leads” generated by the marketing function or focus on sales function–directed “outbound prospecting” based on predefined criteria."; "the activities of an SDR can focus on “individual prospects” or “larger enterprise accounts”, depending on the complexity of the sales situation."; "Once SD deems that the customer, as a decision-making unit, is ready to start a dialogue with the account executive, the lead is handed over to outside sales."Terho, Salonen & Yrjänen (2023)
- A A verified against the printed page of the primary sourceB primary source, text layer onlyC authoritative secondaryD reported Cross-unit alignment requires shared definitions of lead, SQL and prospect, backward-calculated joint targets, internal SLAs governing contact times, clear ownership, and balanced evaluation rather than rewarding booked meetings alone (pp. 346, 347): "units should clearly define and agree on the terminology “what is a lead, a sales qualified lead or a prospect,” as well as clearly define responsibilities who has the ownership of the lead along the sales process."; "Many firms further used internal service-level agreements to formally govern the internal lead management process, for example, regarding the contact times for different leads"; "Many respondents emphasized joint target setting by working backward from sales targets to understand how many leads marketing needs to generate monthly and what the quality of those leads needs to be so that the sales funnel maintains a steady flow."; "this was my lead, no I talked to them first, no it was mine"; "did the field sales enter a new sales opportunity into the firm’s CRM system after holding a sales meeting booked by an SDR"; "“Booked meetings” is a classic metric, however, in my opinion a wrong one. It would be more important to think about the lifecycle of the client: how it was transformed from a subscriber to an opportunity."Terho, Salonen & Yrjänen (2023)
- A A verified against the printed page of the primary sourceB primary source, text layer onlyC authoritative secondaryD reported Marketing and sales hold different time horizons, and in the 461-rep sample across four firms (51, 30, 100 and 280 reps; no compensation component explicitly rewarded following up on marketing leads), reps allocate 5.7% of working time to marketing leads, 15.6% to self-generated leads and 78.8% to non-acquisition work; in Table 2 (p. 61), perceived prequalification quality (b = .64, 95% interval .39 to .85) and its interaction with experience (b = .71, .48 to .96) increase marketing-lead time share, while managerial tracking (b = -.89, -.96 to -.68), its interaction with experience (b = -.55, -.74 to -.39) and past performance (b = -.31, -.46 to -.12) reduce it, and lead volume (b = .44, -.28 to .73) and experience (b = -.19, -.34 to .16) have intervals crossing zero; in Table 1 and Table 3 (pp. 59, 63), annual marketing leads per rep average 48.61 (109.30, 199.48, 18.42, 32.14) and managerial-tracking elasticity is -.14 (-.08, -.27, .33, .02) (pp. 54, 58, 59, 61 to 63): "leads that demand careful nurturing to be more attractive than sales does, because sales reps must focus on short-term quota attainment"; "the leads that marketing views as most attractive may not meet the immediate needs of the sales rep."; "Although the compensation schemes included bonuses tied to acquiring new customers, no component explicitly rewarded following up on marketing leads."Sabnis et al (2013)
- A A verified against the printed page of the primary sourceB primary source, text layer onlyC authoritative secondaryD reported Qualification judgement and record-keeping: leads are prospects contacted after being qualified as most likely to respond, a qualification often driven by gut feeling; decisions and steps must be documented and analysed periodically; no full real-life test of the model was possible (pp. 545, 550): "Leads are prospects that will be contacted, after they have been qualified as the most likely to respond."; "This qualification is often driven by gut feeling or self-claimed competence."; "Information on decisions made, steps taken, strategies employed, and so on must be recorded and analyzed periodically."; "The main limitation of this study is that it was not possible to run a full, real-life test of the algorithm."D'Haen and Van den Poel (2013)
- A A verified against the printed page of the primary sourceB primary source, text layer onlyC authoritative secondaryD reported The scorecard test: items include funding, decision authority, timeframe and an approved project; five of eight determinants scored (need, urgency, ability to purchase, trust in the vendor, competition), equally weighted and summed, with lead source and contact direction counting towards need and urgency; only the summed score is reported, so no separation can be credited to the BANT-like items; 324 leads drawn at random from about 750 at one US computer hardware and software company, 2003 to 2005, coded from archived e-mails by one analyst; 58 (17.9%) converted, 266 did not; Table VII (p. 191, page image): 38 of 58 and 171 of 266 correctly predicted (66% and 64%); cutoff found by experimentation on the same leads; no hold-out, no significance tests; three of eight determinants had no data; the model is not formally validated. The text says 264 non-converting leads, Table VII 266 (pp. 189 to 191): "five of the eight customer purchase decision determinants"; "Is the project funded?"; "Decision authority of the contact"; "Is there an approved project?"; "The 324 leads analyzed were selected at random from a total of"; "that sells computer hardware and software, covering the time period 2003-2005"; "a single analyst scrutinized the archived e-mails"; "Of the 324 leads analyzed, 58 (17.9 percent) eventually converted to bookings while 266 did not."; "Number of leads that developed into sales"; "By experimentation, a cutoff score of"; "It did not use hold-out samples for validation"; "no tests of statistical significance were performed"; "no data were available from the archived leads for any lead for the last three purchase determinants"; "The proposed model has not yet been formally field validated"Monat (2011)
- A A verified against the printed page of the primary sourceB primary source, text layer onlyC authoritative secondaryD reported Results, read from the page images of pp. 194 and 195: leads returned 104 (tight) and 622 (loose), appointments 66 and 174, presentations 48 and 104, sales on leads 32 and 48, other sales 3 and 4; Table 2: sales from leads $64,200 and $95,320, salesperson earnings $10,144 and $12,761, sales per lead 30.8% and 7.7%, sales per presentation 66.7% and 46.2%, cost per lead $92.30 and $15.43, lead cost per sale $300.00 and $200.00; the tight team ran out of places to go; loose leads produced more volume, earnings and returns at lower cost per sale, tight leads a higher conversion rate and more motivation (pp. 194 to 196): "A Comparison of Tight vs. Loose Sales Leads"; "Almost one third of the T leads were converted into sales, whereas 13 loose leads were required for a sale."; "The sales emerging from tight leads cost 50% more."; "The T sales group seemed to run out of places to go and demonstrated little initiative and weak work habits in developing their own prospects."; "loose leads produced more sales volume, higher earnings for salespeople, a larger lead return rate, a lower lead cost per sale, and a lower compensation-cost ratio"; "Tight leads produced a higher conversion rate into sales and an increased level of motivation for sales force members."Jolson (1988)
From the essay
Revenue operations & AI
MQL and SQL: what are marketing- and sales-qualified leads?
A marketing-qualified lead passes marketing’s prequalification screen; a sales-qualified lead is verified by sales as ready for a sales conversation.
Read the essayThis exhibit belongs to an essay: the numbers live here, the argument lives there.
Cite or embed
Related exhibits
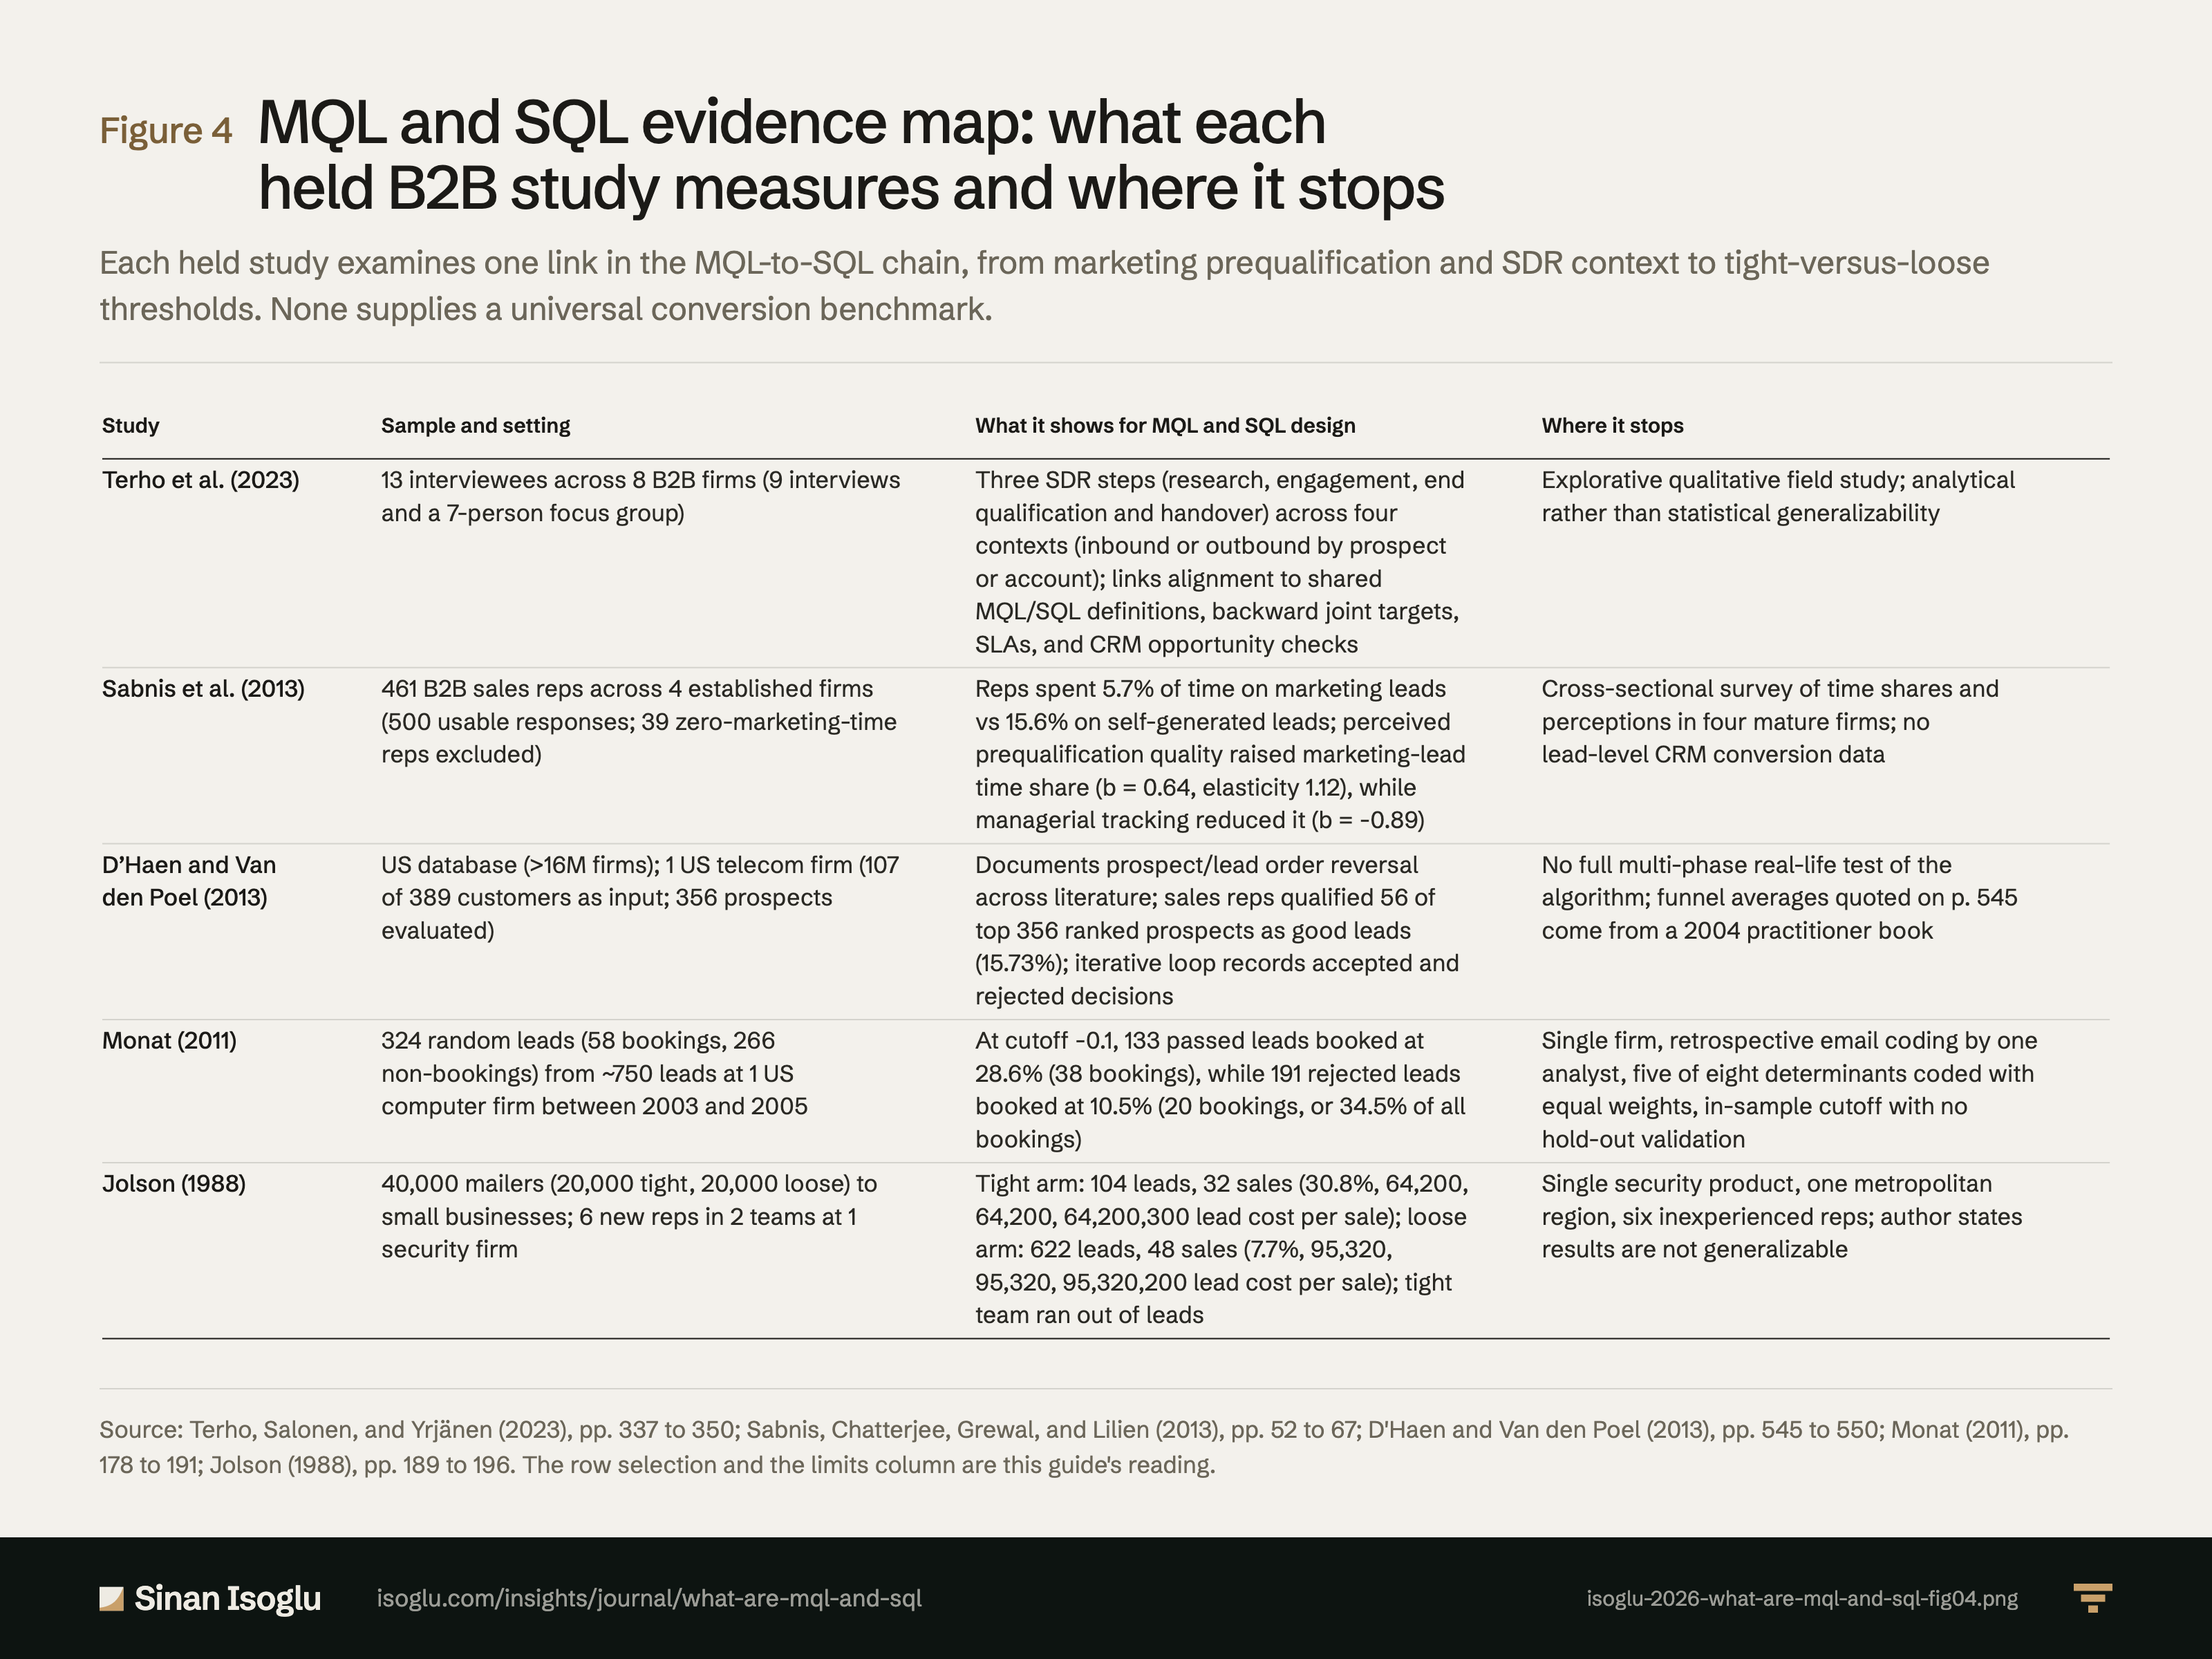
Figure 4Figure
MQL and SQL evidence map: what each held B2B study measures and where it stops
MQL and SQL: what are marketing- and sales-qualified leads?
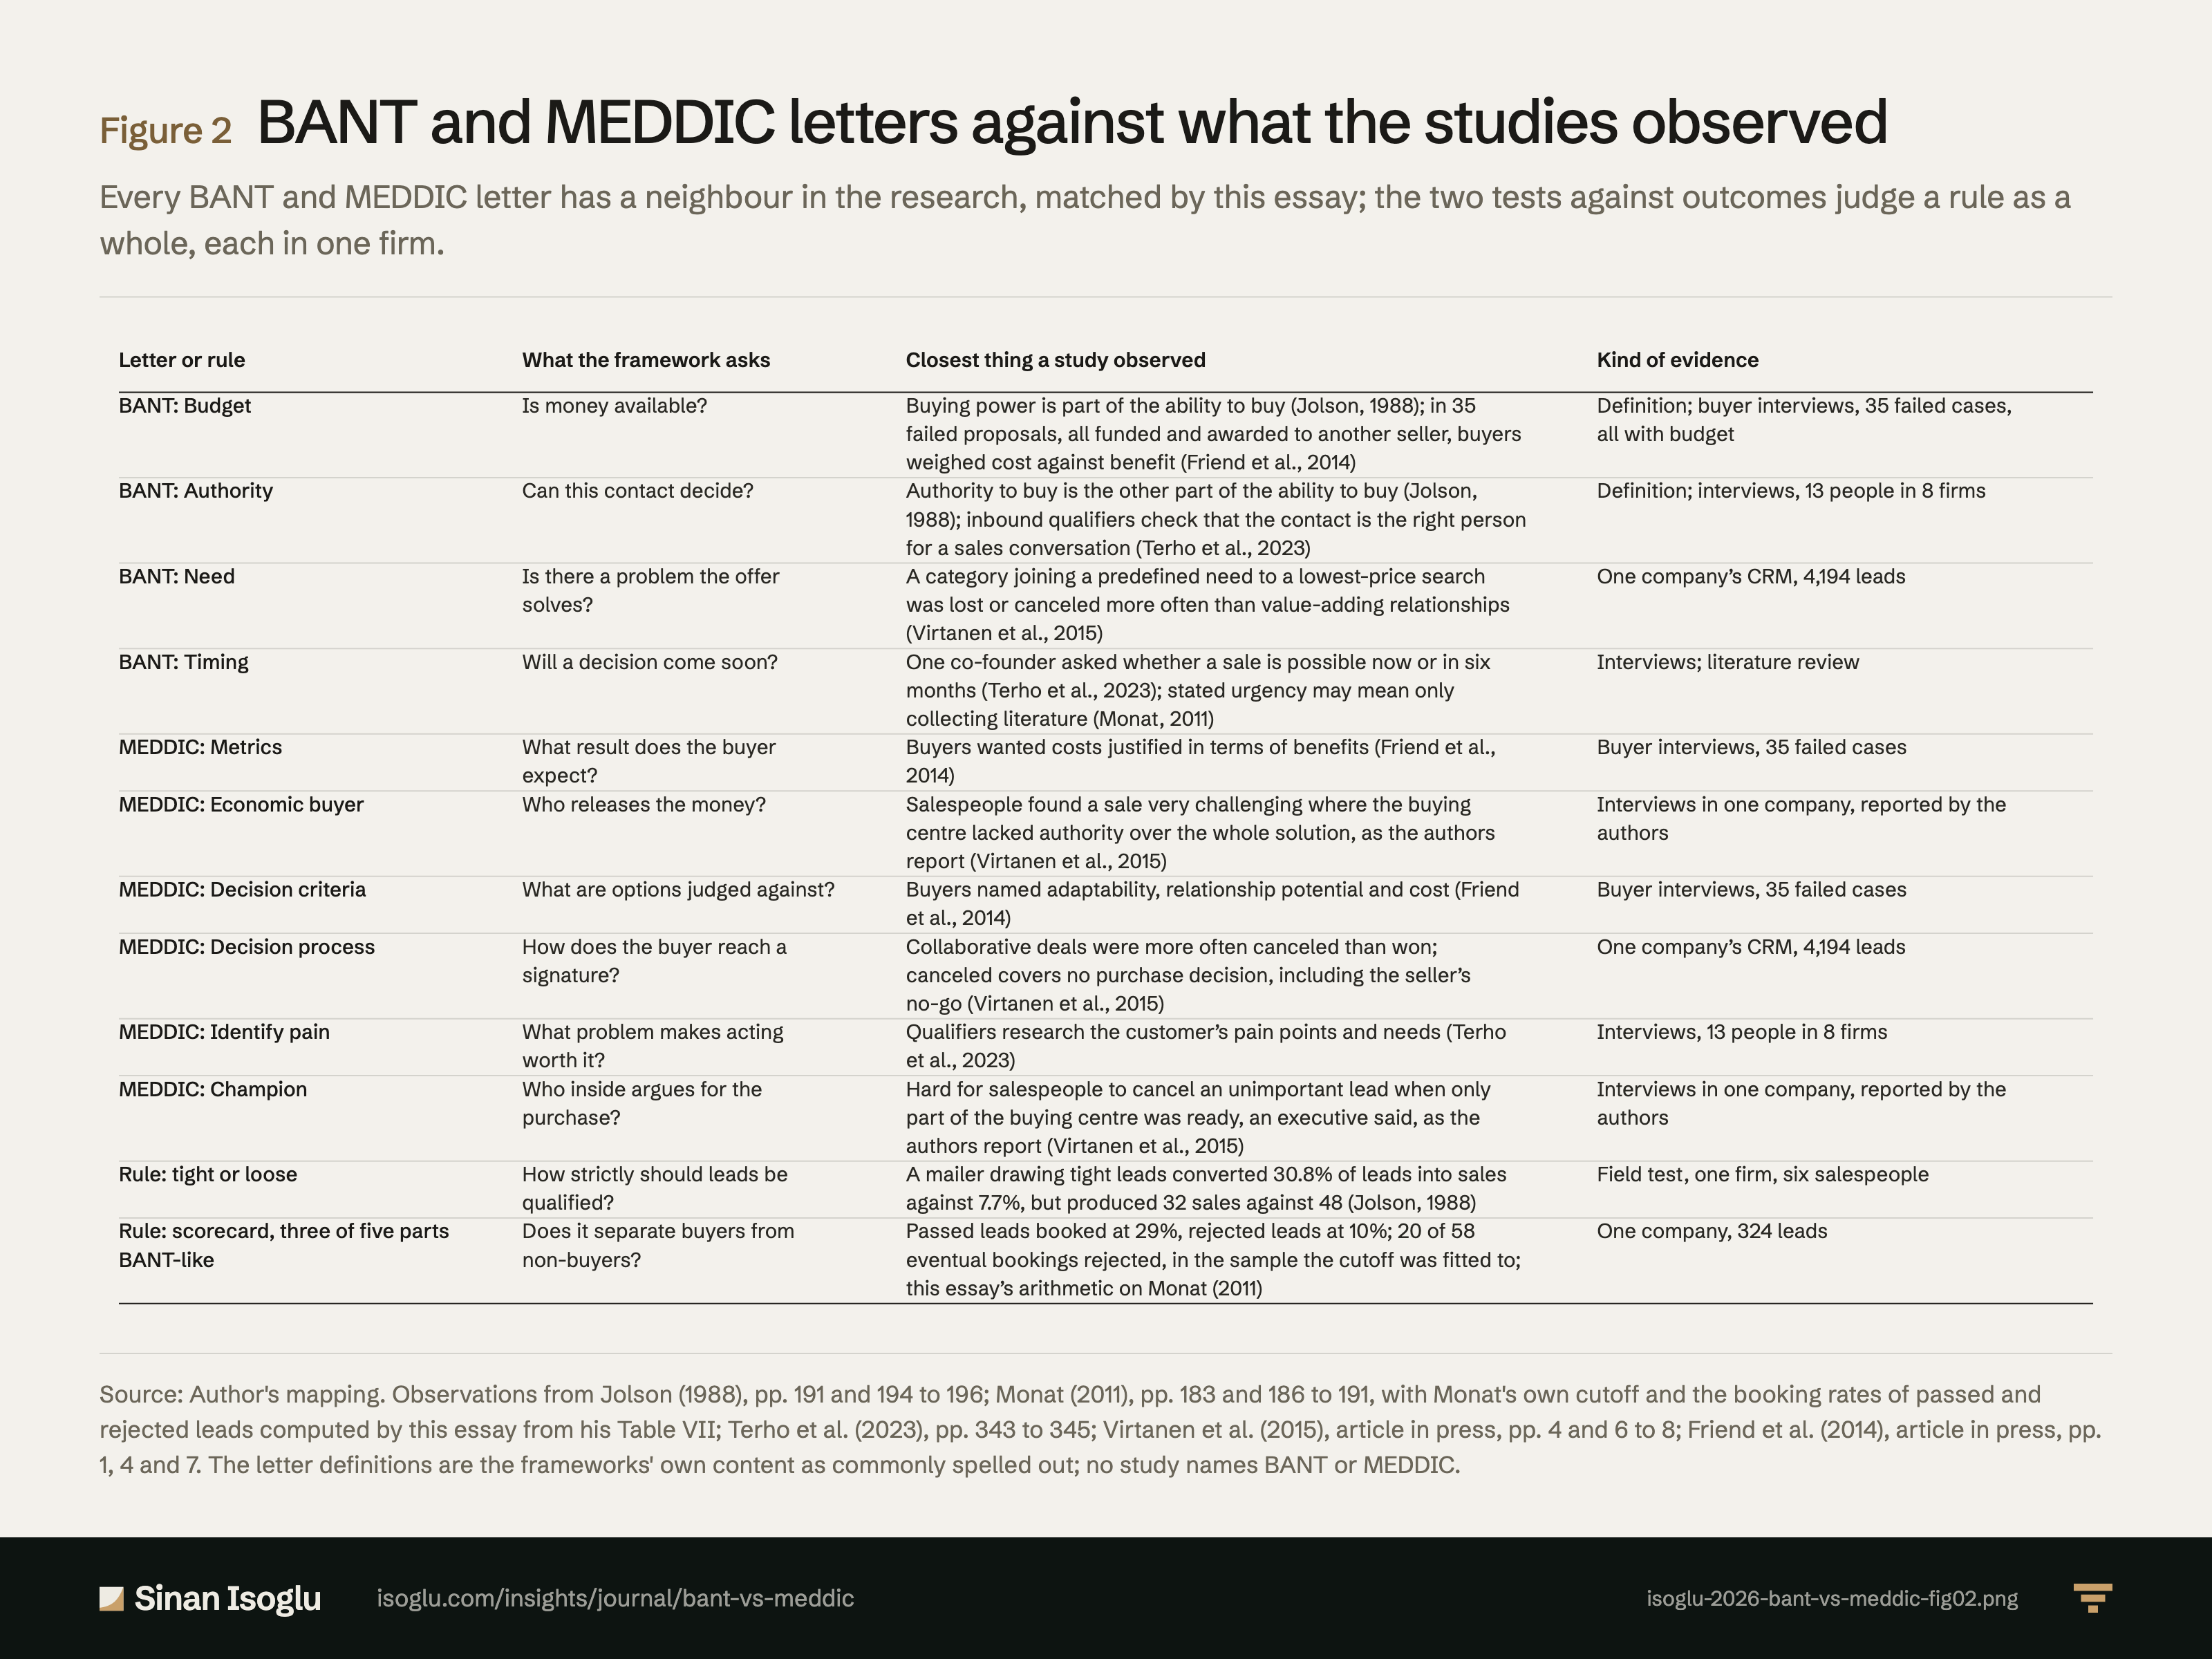
Figure 2Figure
BANT and MEDDIC letters against what the studies observed
BANT vs MEDDIC: a qualification checklist is a hypothesis
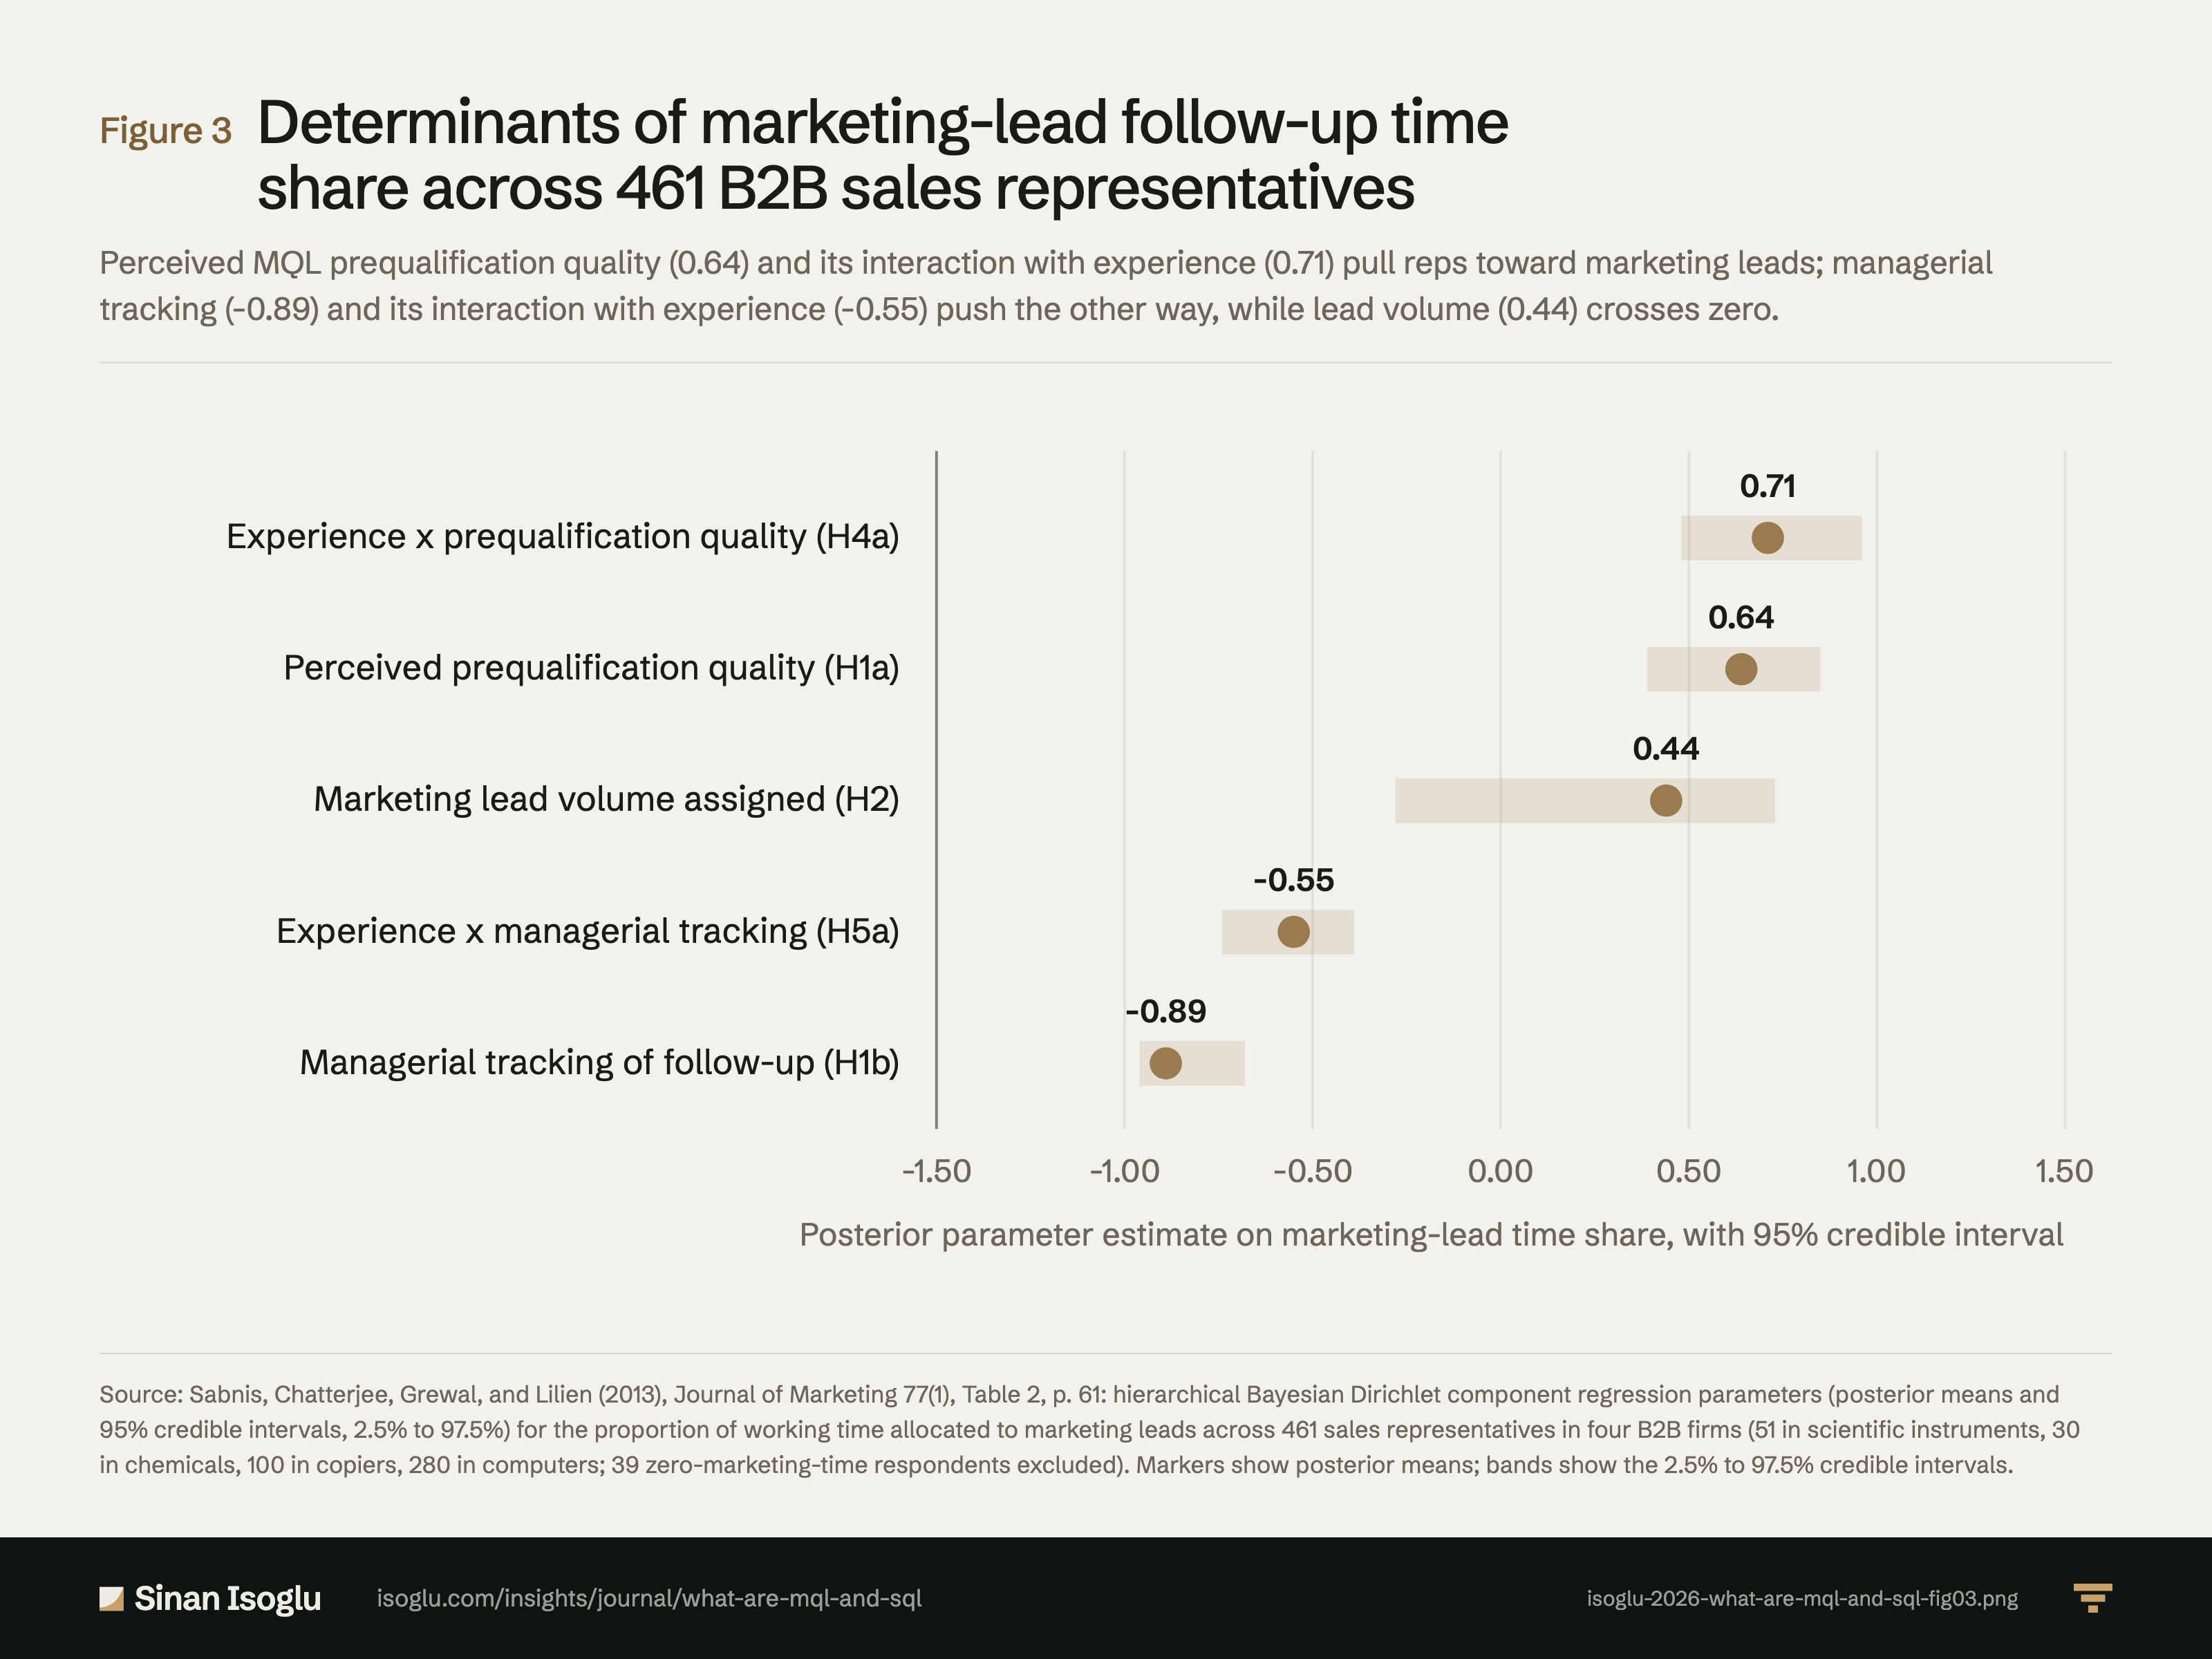
Figure 3Figure
Determinants of marketing-lead follow-up time share across 461 B2B sales representatives
MQL and SQL: what are marketing- and sales-qualified leads?
Contact
Bring the question you're working on.
Research, a guest lecture, or a commercial question.