Figure 3From “MQL and SQL: what are marketing- and sales-qualified leads?”
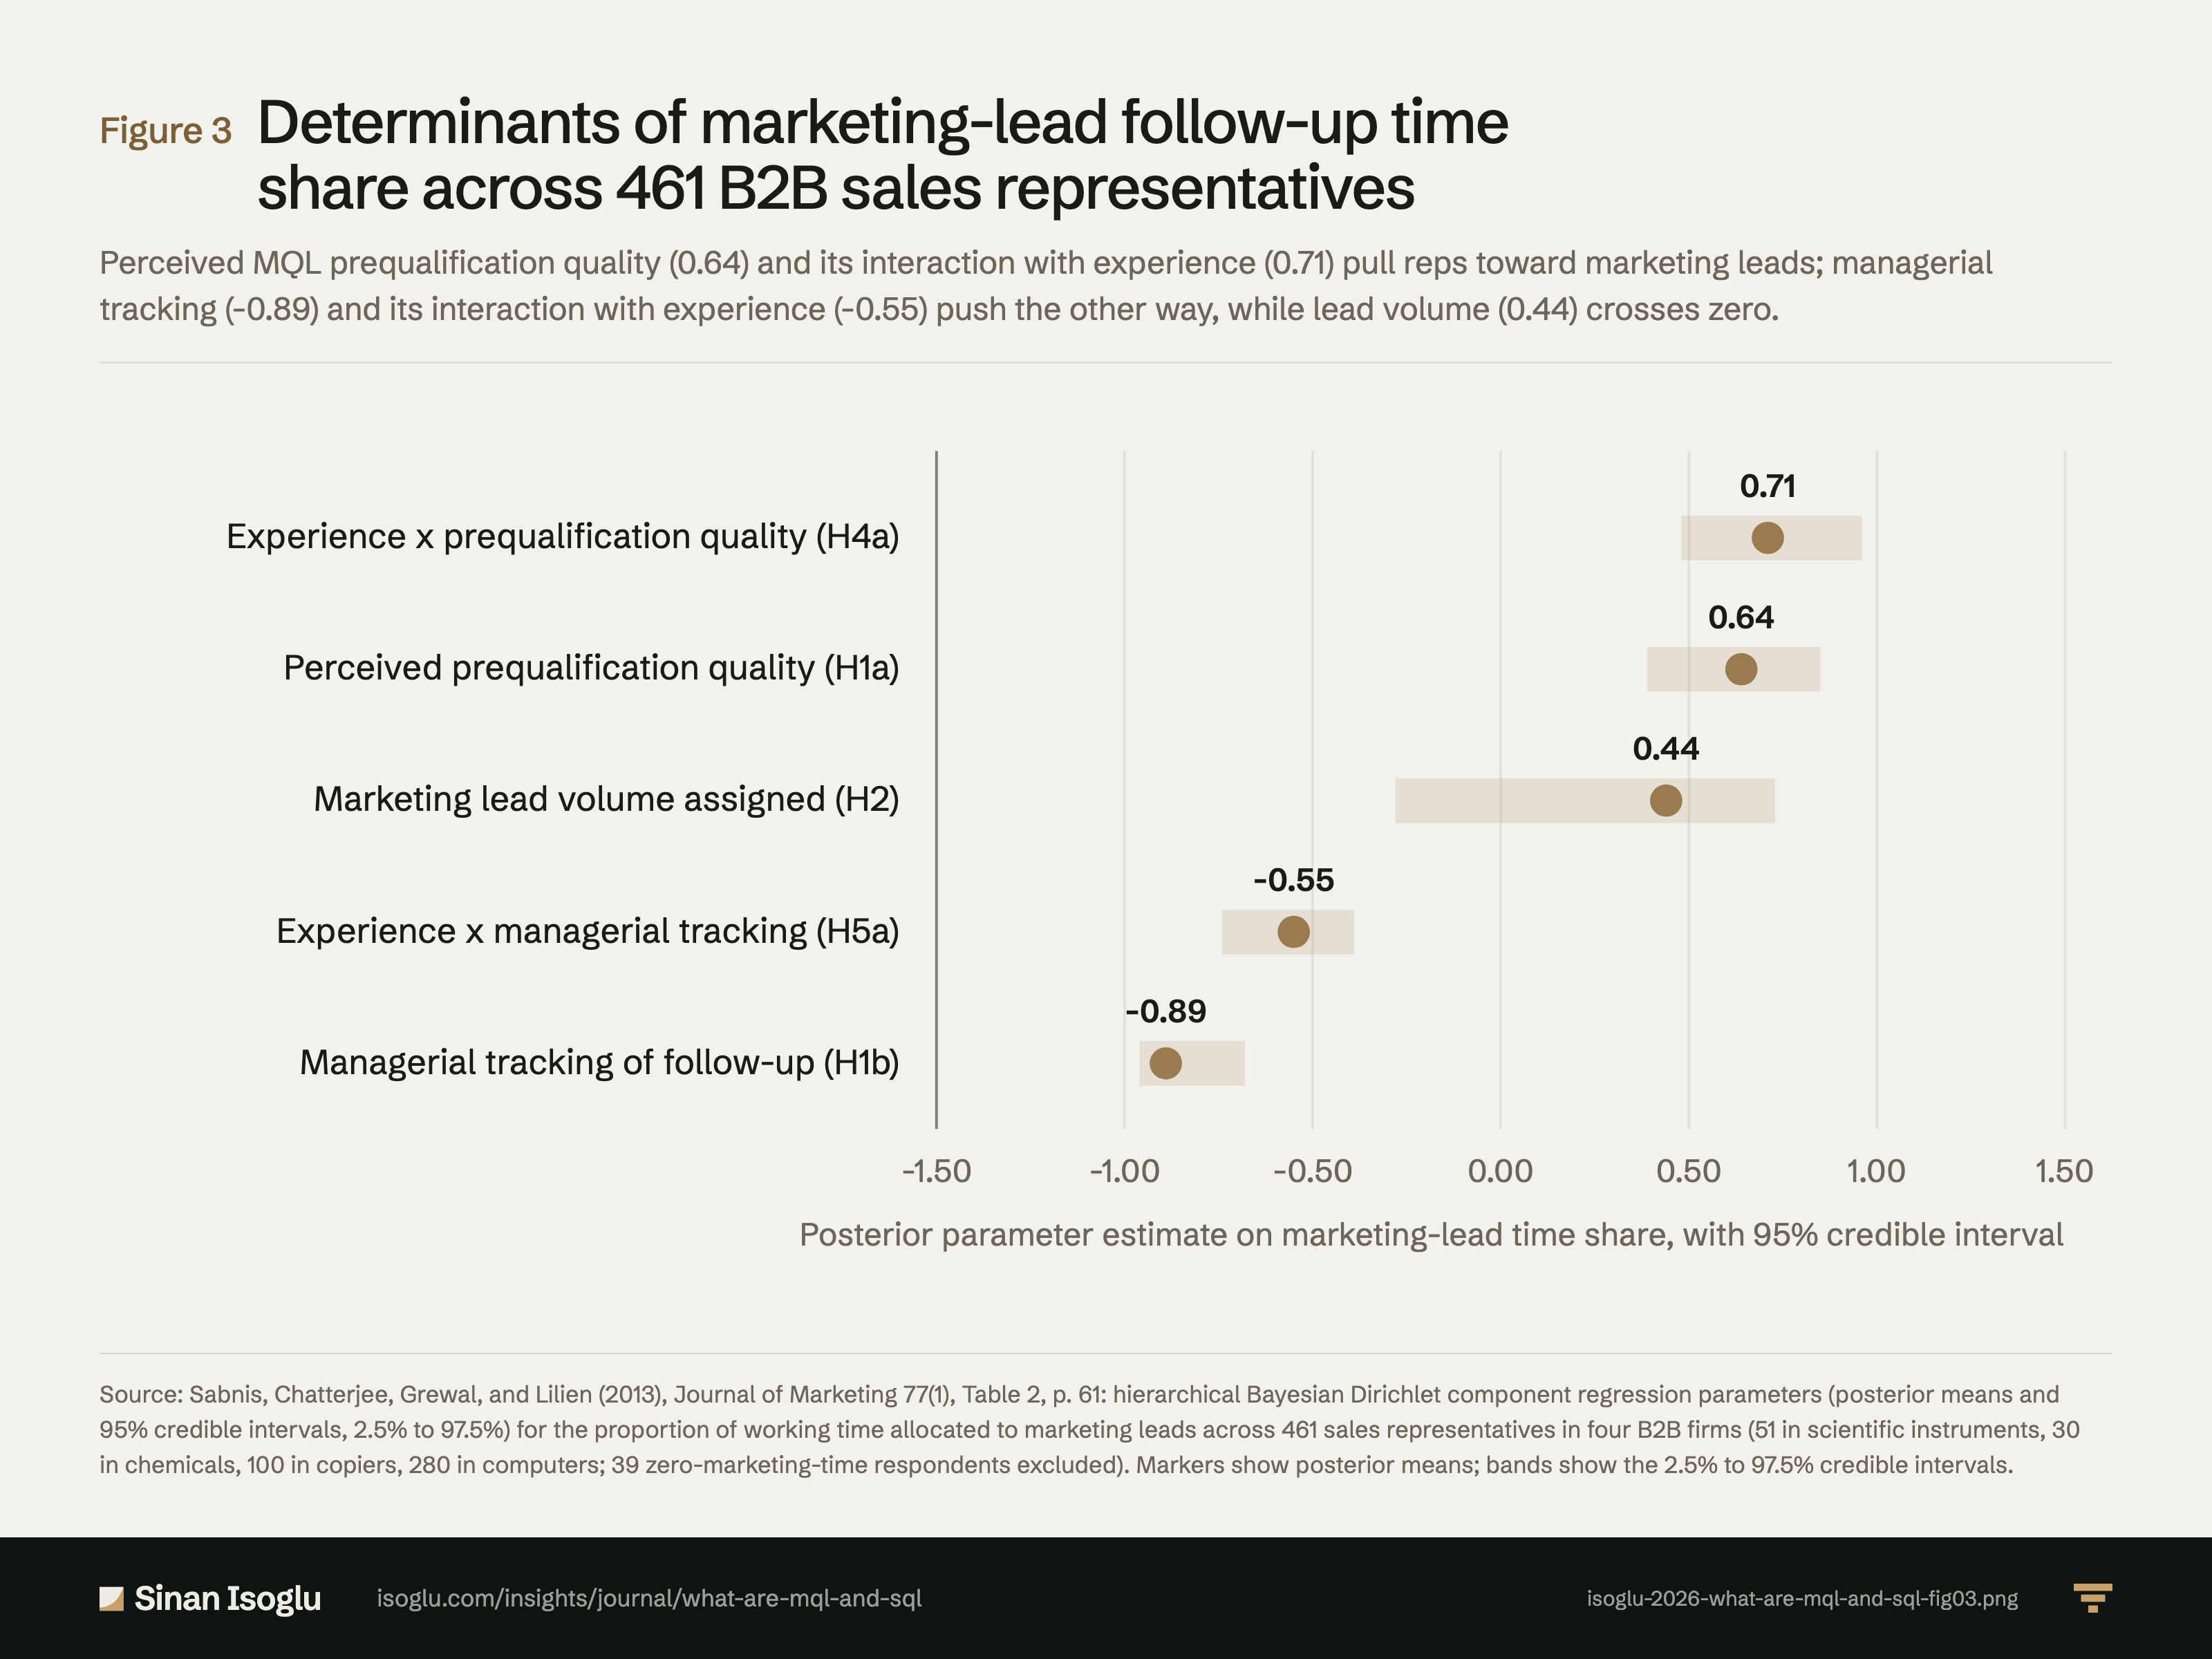
Determinants of marketing-lead follow-up time share across 461 B2B sales representatives
Perceived MQL prequalification quality (0.64) and its interaction with experience (0.71) pull reps toward marketing leads; managerial tracking (-0.89) and its interaction with experience (-0.55) push the other way, while lead volume (0.44) crosses zero.
Figure 3Determinants of marketing-lead follow-up time share across 461 B2B sales representatives
Source: Sabnis, Chatterjee, Grewal, and Lilien (2013), Journal of Marketing 77(1), Table 2, p. 61: hierarchical Bayesian Dirichlet component regression parameters (posterior means and 95% credible intervals, 2.5% to 97.5%) for the proportion of working time allocated to marketing leads across 461 sales representatives in four B2B firms (51 in scientific instruments, 30 in chemicals, 100 in copiers, 280 in computers; 39 zero-marketing-time respondents excluded). Markers show posterior means; bands show the 2.5% to 97.5% credible intervals.
Source and evidence
Each line names a claim related to this exhibit, its source, and how it was checked.
- A A verified against the printed page of the primary sourceB primary source, text layer onlyC authoritative secondaryD reported Design and premise: surveys of sales reps in four B2B firms, one each in scientific instruments, chemicals, copiers and computers, 461 analysed; reps cannot observe objective lead quality and act on their perception of the marketing department's qualification process; the dependent variable is the share of working time on marketing leads, self-generated leads and other work; follow-up is defined from first contact until the rep knows what the prospect will do (order, competitor's order, written off) (pp. 53, 55, 58, 59, 64): "Each firm represented a different industry (scientific instruments, chemicals, copiers, and computers)."; "data from 461 sales reps from four firms"; "leaving 461 surveys that reported on all relevant measures"; "Sales reps cannot observe the objective quality of leads; they are motivated by their perceptions of lead quality or, more operationally, of the marketing department’s lead qualification process."; "We count follow-up as starting when you contact a prospect in any way at all and ending when you know what the prospect will do (you get the order, somebody else gets the order, or you write them off as hopeless)."Sabnis et al. (2013)
- A A verified against the printed page of the primary sourceB primary source, text layer onlyC authoritative secondaryD reported Results: H1a supported (b = .64, p < .05); elasticity of the marketing-lead time share to perceived prequalification quality 1.12 for the sample, positive in all four firms, .58 to 1.64, which the authors call a 3:1 ratio; Table 3, row Quality of prequalification (p. 63, page image): aggregate 1.12, Firm 1 1.24, Firm 2 .58, Firm 3 1.64, Firm 4 1.43; the same table gives managerial tracking −.14 and marketing lead volume −.07 for the aggregate; Firms 1 to 4 are scientific instruments, chemicals, copiers and computers (pp. 59 and 63), with 51, 30, 100 and 280 reps (Table 1, p. 59); H4a supported (b = .71): the prequalification effect is stronger with more experience. The authors write produces; the data are one cross-sectional survey, so the page reads an association. Table 3 prints point estimates only, with no interval or test, and in the hierarchical specification the firm-level effects shrink toward the aggregate (p. 62); the aggregate value is the model's own estimate, not an average of the firm values, and Firm 2 rests on 30 reps; the page says so in the Figure 1 caption and calls the elasticity a slope, not a closeness of fit. The instrument prints the scale as 1 = agree and 7 = disagree (p. 58) while the text reads higher scores as higher perceived quality (pp. 59, 63), so the page gives direction as the authors state it and uses no scale means (pp. 59, 61 to 63): "which suggests that as the perceived quality of prequalification increases, the proportion of time spent on marketing leads increases"; "a 1% increase in perceived prequalification quality produces a 1.12% increase in marketing lead follow-up time allocation"; "The elasticity is positive across all four firms but varies considerably (from .58 to 1.64)."; "we find a 3:1 ratio for the elasticity of the perceived prequalification quality for the least and most responsive firms"; "Elasticity of Marketing Lead Time Proportion"; "It is negative for Firms 1 (scientific instruments) and 2 (chemicals) but positive for Firms 3 (copiers"; "in which we argued that experience enhances the positive effect of the perceived quality of prequalification on the proportion of time spent following up marketing leads"; "In the model specification, the firm-level effects shrink to the aggregate effects."; "from 55 (Firm 2, chemicals) to 2500 (Firm 4, computers)"Sabnis et al. (2013)
- A A verified against the printed page of the primary sourceB primary source, text layer onlyC authoritative secondaryD reported Reps reporting no marketing-lead time, and scope: 39 respondents reported spending no time on marketing leads (the page no longer says they ignored them, since receipt and intent are not reported) and perceived prequalification as significantly lower; 37 of the 39 came from the computer firm, a potential systematic bias, and they were removed; the black hole share in the paper's opening comes from two industry research reports it cites (Marcus 2002, Gartner Group; Michiels 2009, Aberdeen Group), not from the sample, and guard FUN-X1 keeps that figure off the page; the authors say the figure reflects marketing as well as sales, since reps can receive more leads than they could pursue; the firms are long-established major players and the conclusions might not apply to smaller or younger firms (pp. 52, 59, 64, 67): "Our preliminary examination of the data showed that 39 respondents reported spending no time pursuing marketing leads."; "sales reps who spent no time pursuing marketing leads perceived the quality of lead prequalification"; "as significantly lower than those who pursued at least some marketing leads"; "37 of the 39 respondents who indicated no marketing lead follow-up time came from one firm (computer industry)"; "a potential for systematic bias"; "We removed the responses with no marketing lead follow-up time allocations from our analysis"; "reflects inadequacies of marketing as well as the sales function"; "it is not possible for the sales reps to pursue all of them, even if they desired to do so"; "research report, Gartner Group"; "research report, Aberdeen Group"; "Our study uses data from firms that are major players in their industries and have been so for several decades"; "our conclusions might not apply to smaller or younger firms whose sales processes are still evolving"Sabnis et al. (2013)
- A A verified against the printed page of the primary sourceB primary source, text layer onlyC authoritative secondaryD reported Marketing and sales hold different time horizons, and in the 461-rep sample across four firms (51, 30, 100 and 280 reps; no compensation component explicitly rewarded following up on marketing leads), reps allocate 5.7% of working time to marketing leads, 15.6% to self-generated leads and 78.8% to non-acquisition work; in Table 2 (p. 61), perceived prequalification quality (b = .64, 95% interval .39 to .85) and its interaction with experience (b = .71, .48 to .96) increase marketing-lead time share, while managerial tracking (b = -.89, -.96 to -.68), its interaction with experience (b = -.55, -.74 to -.39) and past performance (b = -.31, -.46 to -.12) reduce it, and lead volume (b = .44, -.28 to .73) and experience (b = -.19, -.34 to .16) have intervals crossing zero; in Table 1 and Table 3 (pp. 59, 63), annual marketing leads per rep average 48.61 (109.30, 199.48, 18.42, 32.14) and managerial-tracking elasticity is -.14 (-.08, -.27, .33, .02) (pp. 54, 58, 59, 61 to 63): "leads that demand careful nurturing to be more attractive than sales does, because sales reps must focus on short-term quota attainment"; "the leads that marketing views as most attractive may not meet the immediate needs of the sales rep."; "Although the compensation schemes included bonuses tied to acquiring new customers, no component explicitly rewarded following up on marketing leads."Sabnis et al (2013)
From the essay
Revenue operations & AI
MQL and SQL: what are marketing- and sales-qualified leads?
A marketing-qualified lead passes marketing’s prequalification screen; a sales-qualified lead is verified by sales as ready for a sales conversation.
Read the essayThis exhibit belongs to an essay: the numbers live here, the argument lives there.
Cite or embed
Related exhibits
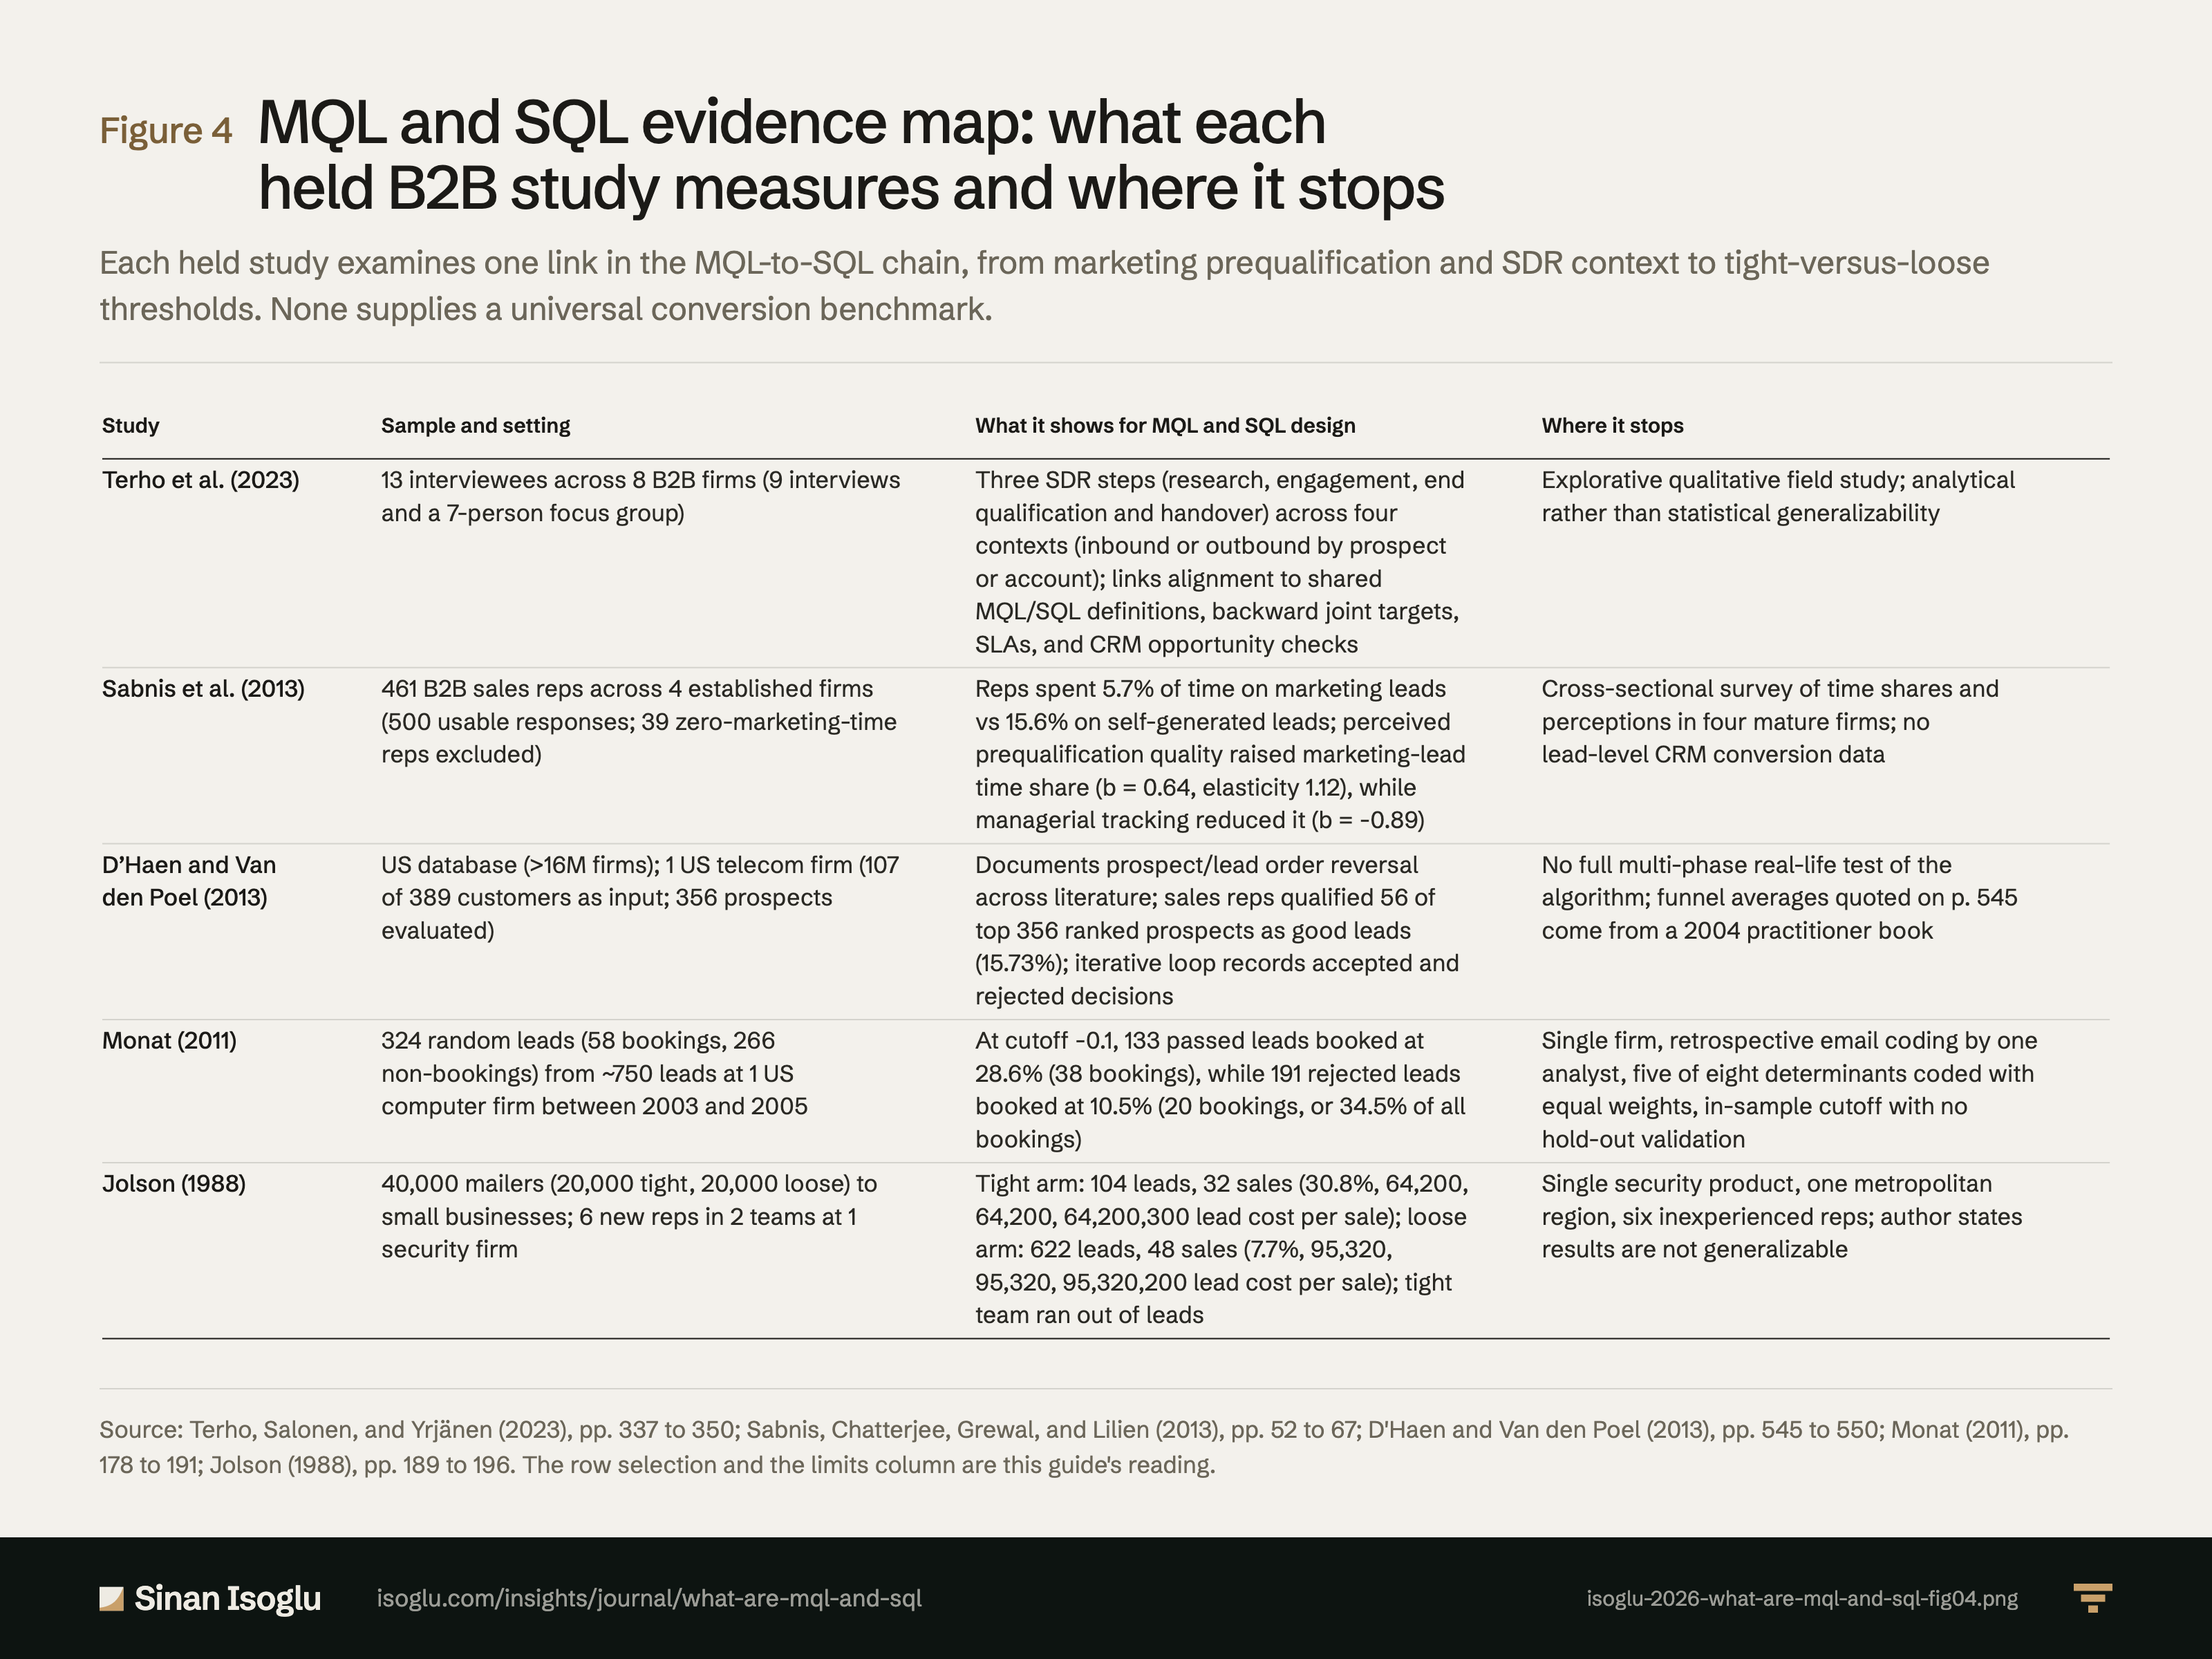
Figure 4Figure
MQL and SQL evidence map: what each held B2B study measures and where it stops
MQL and SQL: what are marketing- and sales-qualified leads?
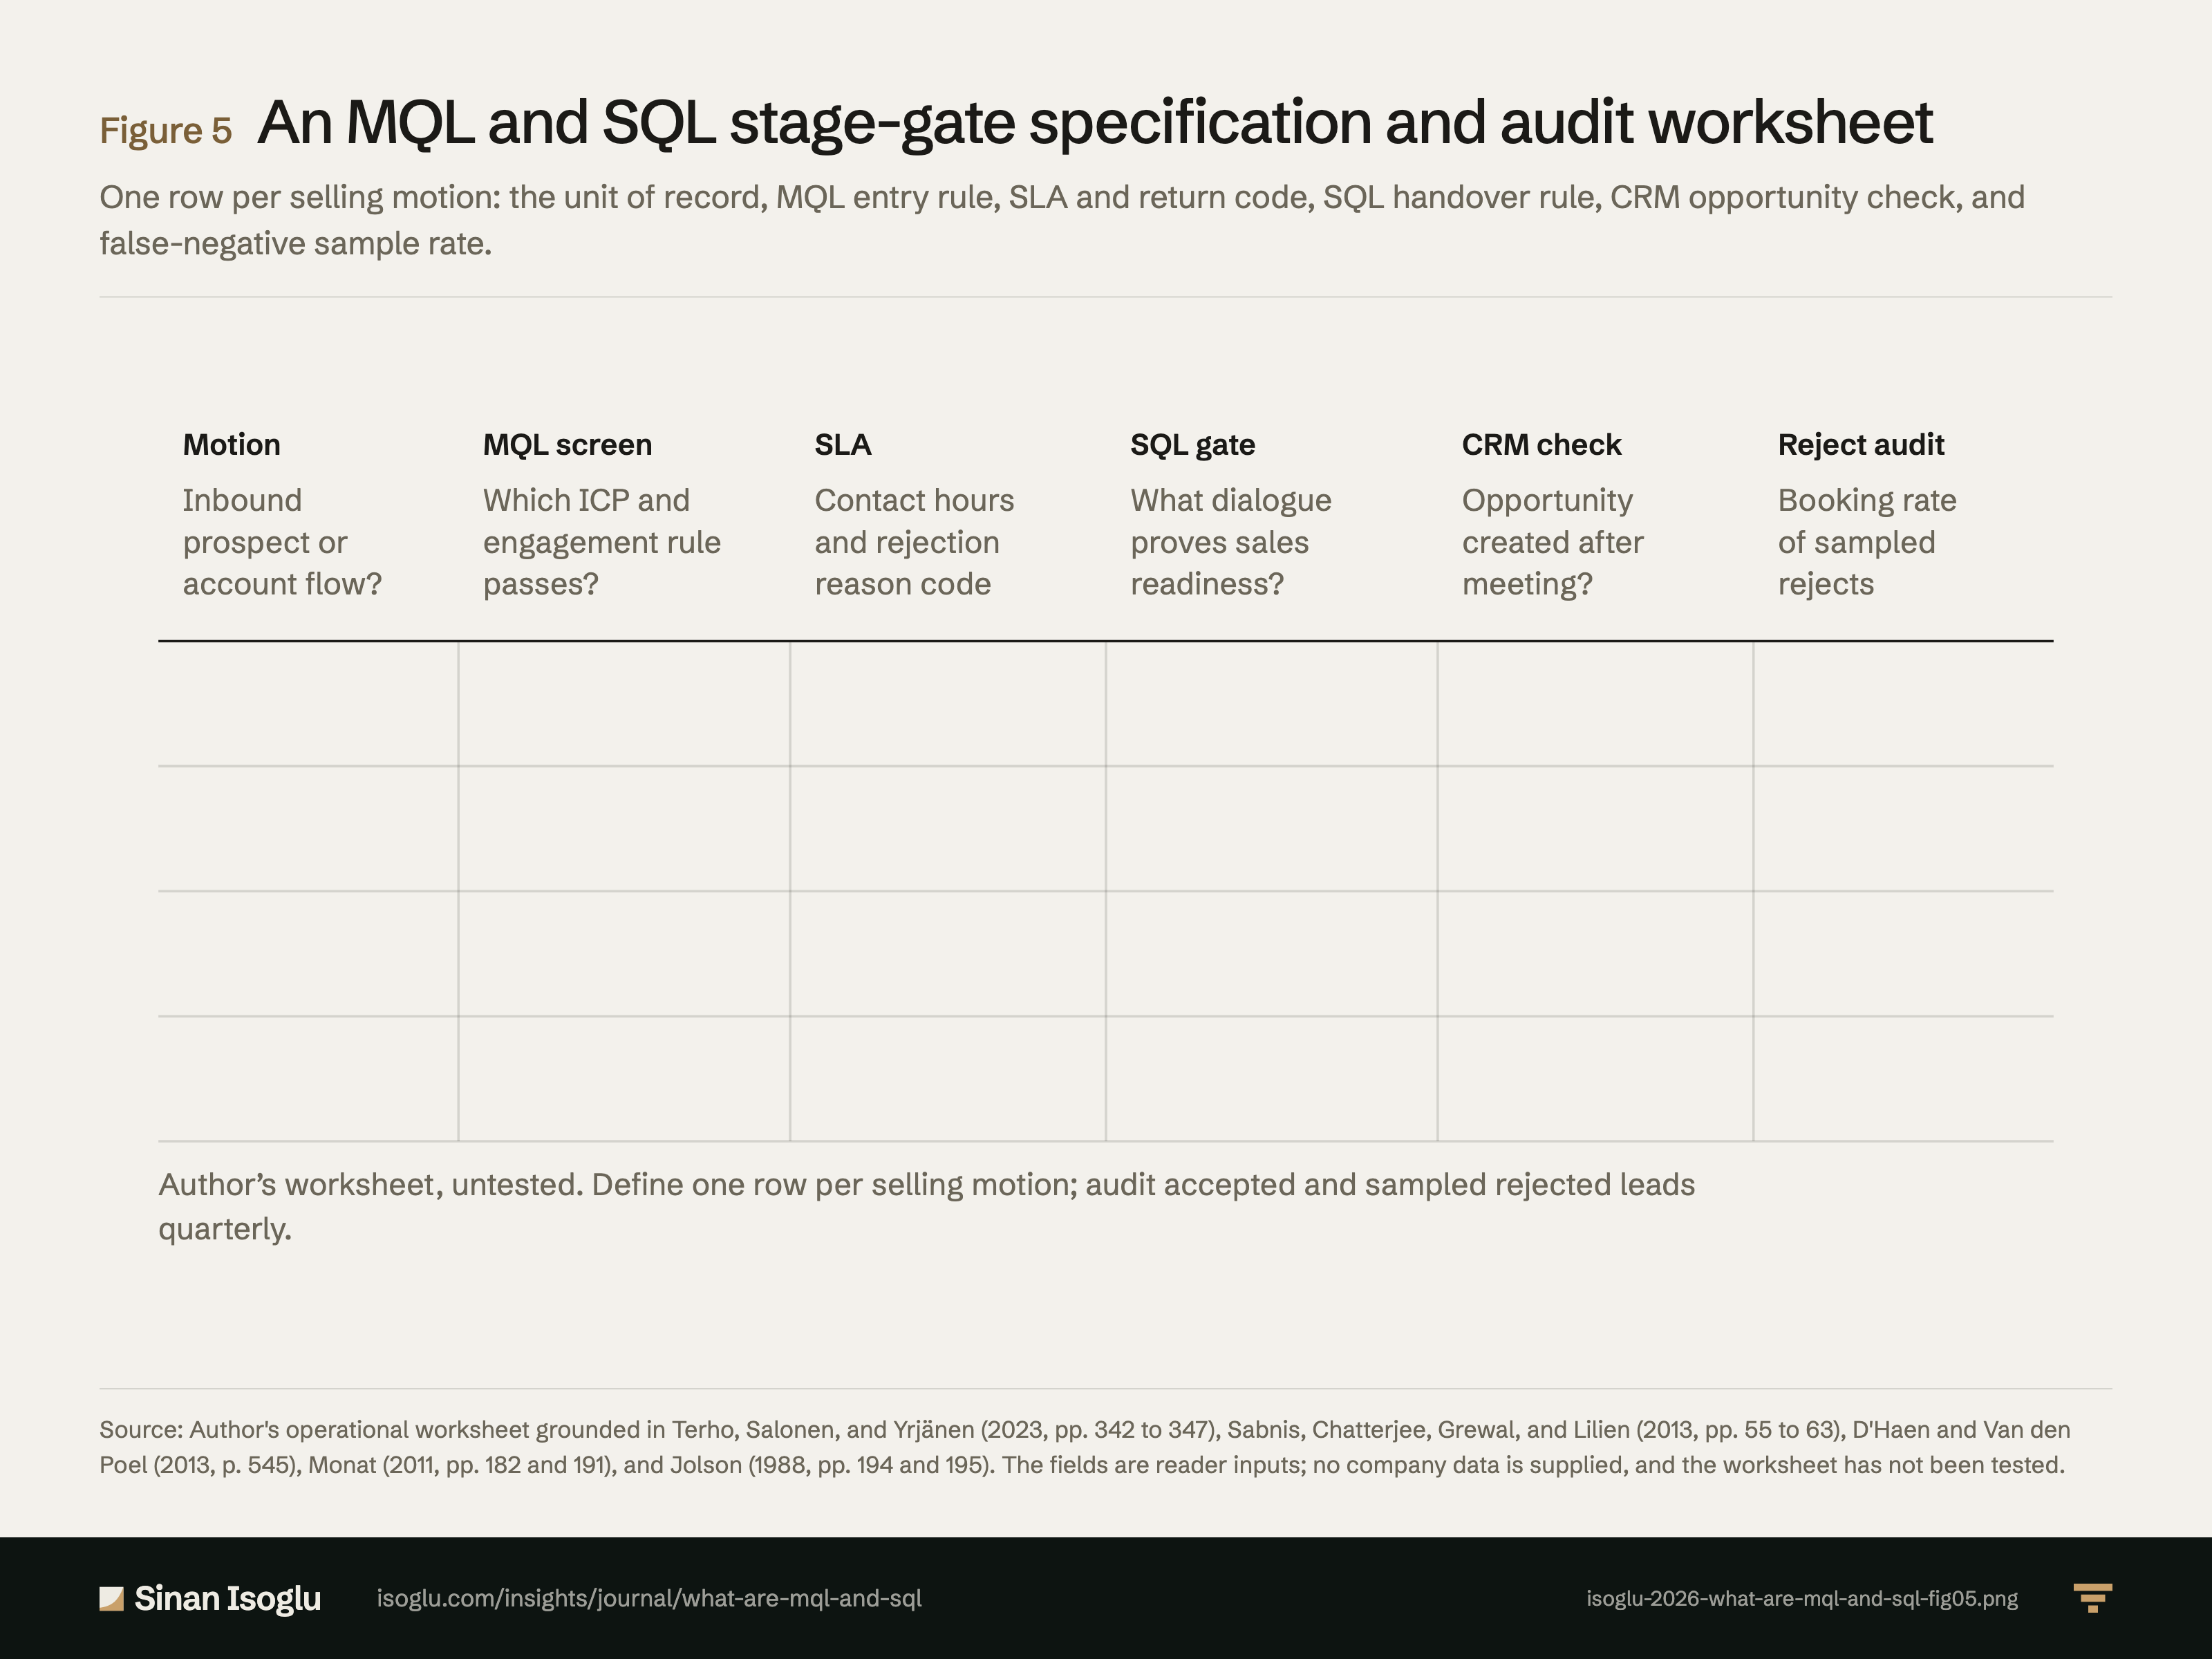
Figure 5Figure
An MQL and SQL stage-gate specification and audit worksheet
MQL and SQL: what are marketing- and sales-qualified leads?
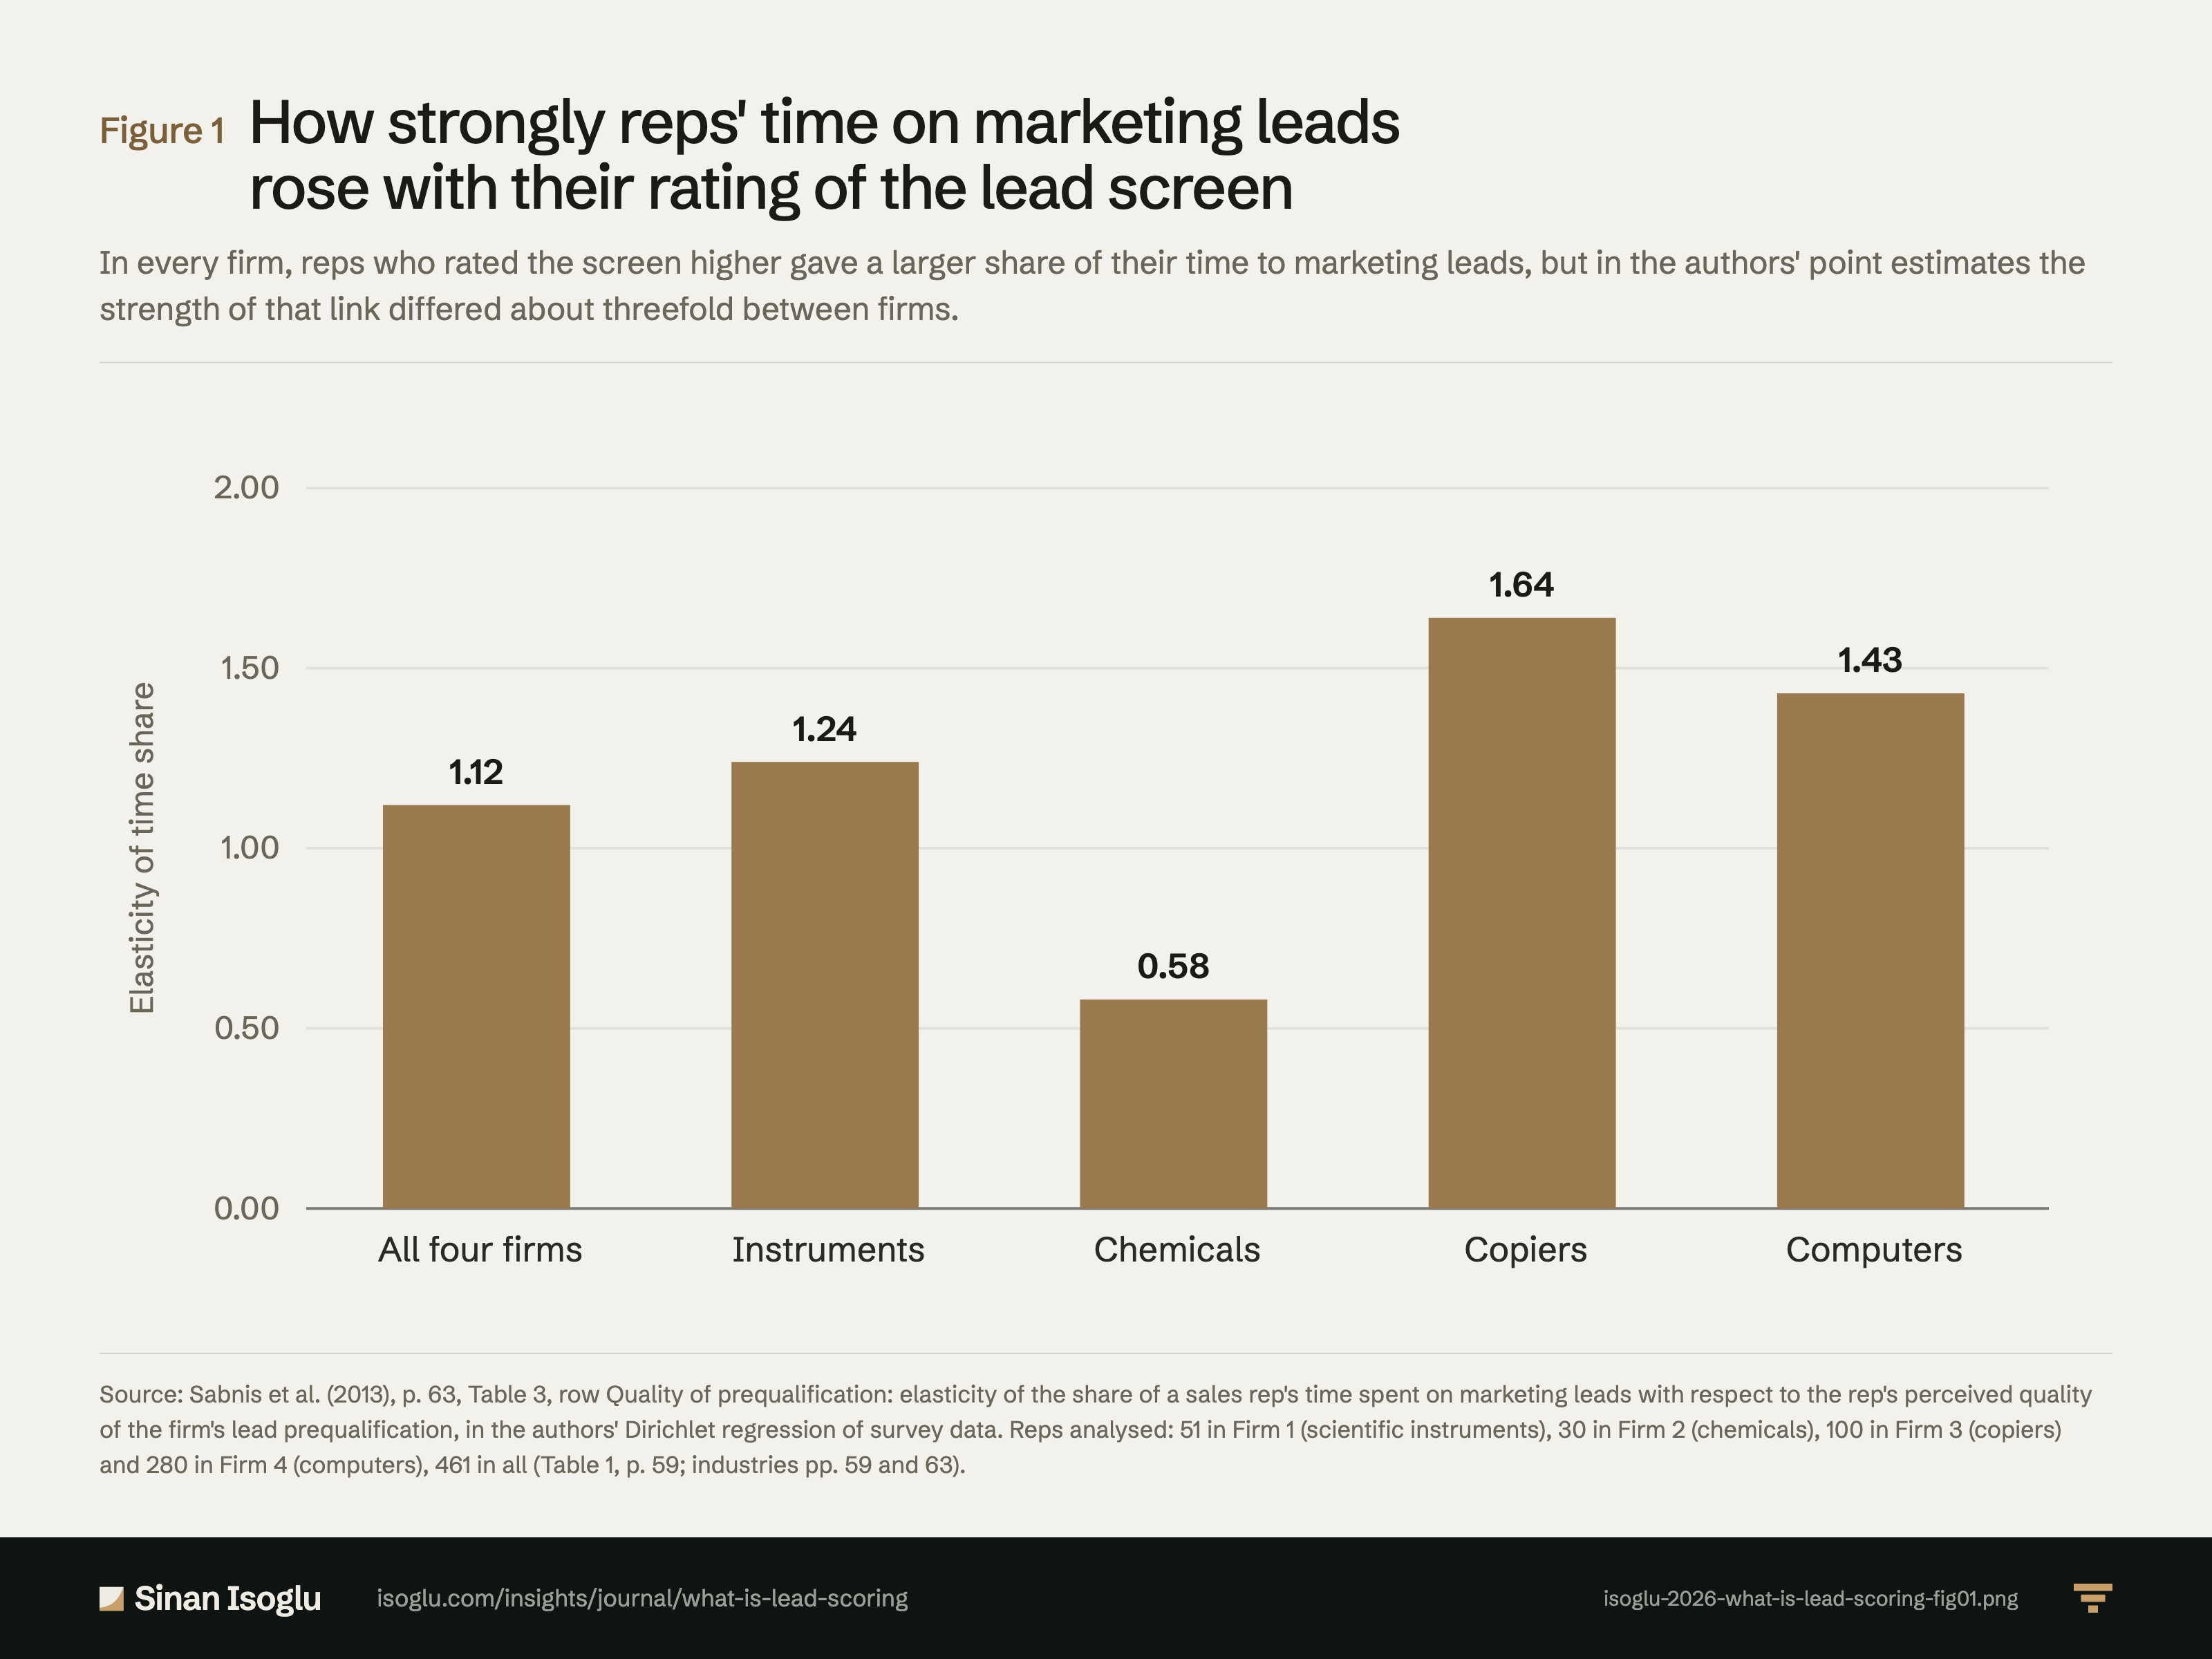
Figure 1Figure
How strongly reps' time on marketing leads rose with their rating of the lead screen
What is lead scoring?
Contact
Bring the question you're working on.
Research, a guest lecture, or a commercial question.