Figure 1From “The incrementality illusion”
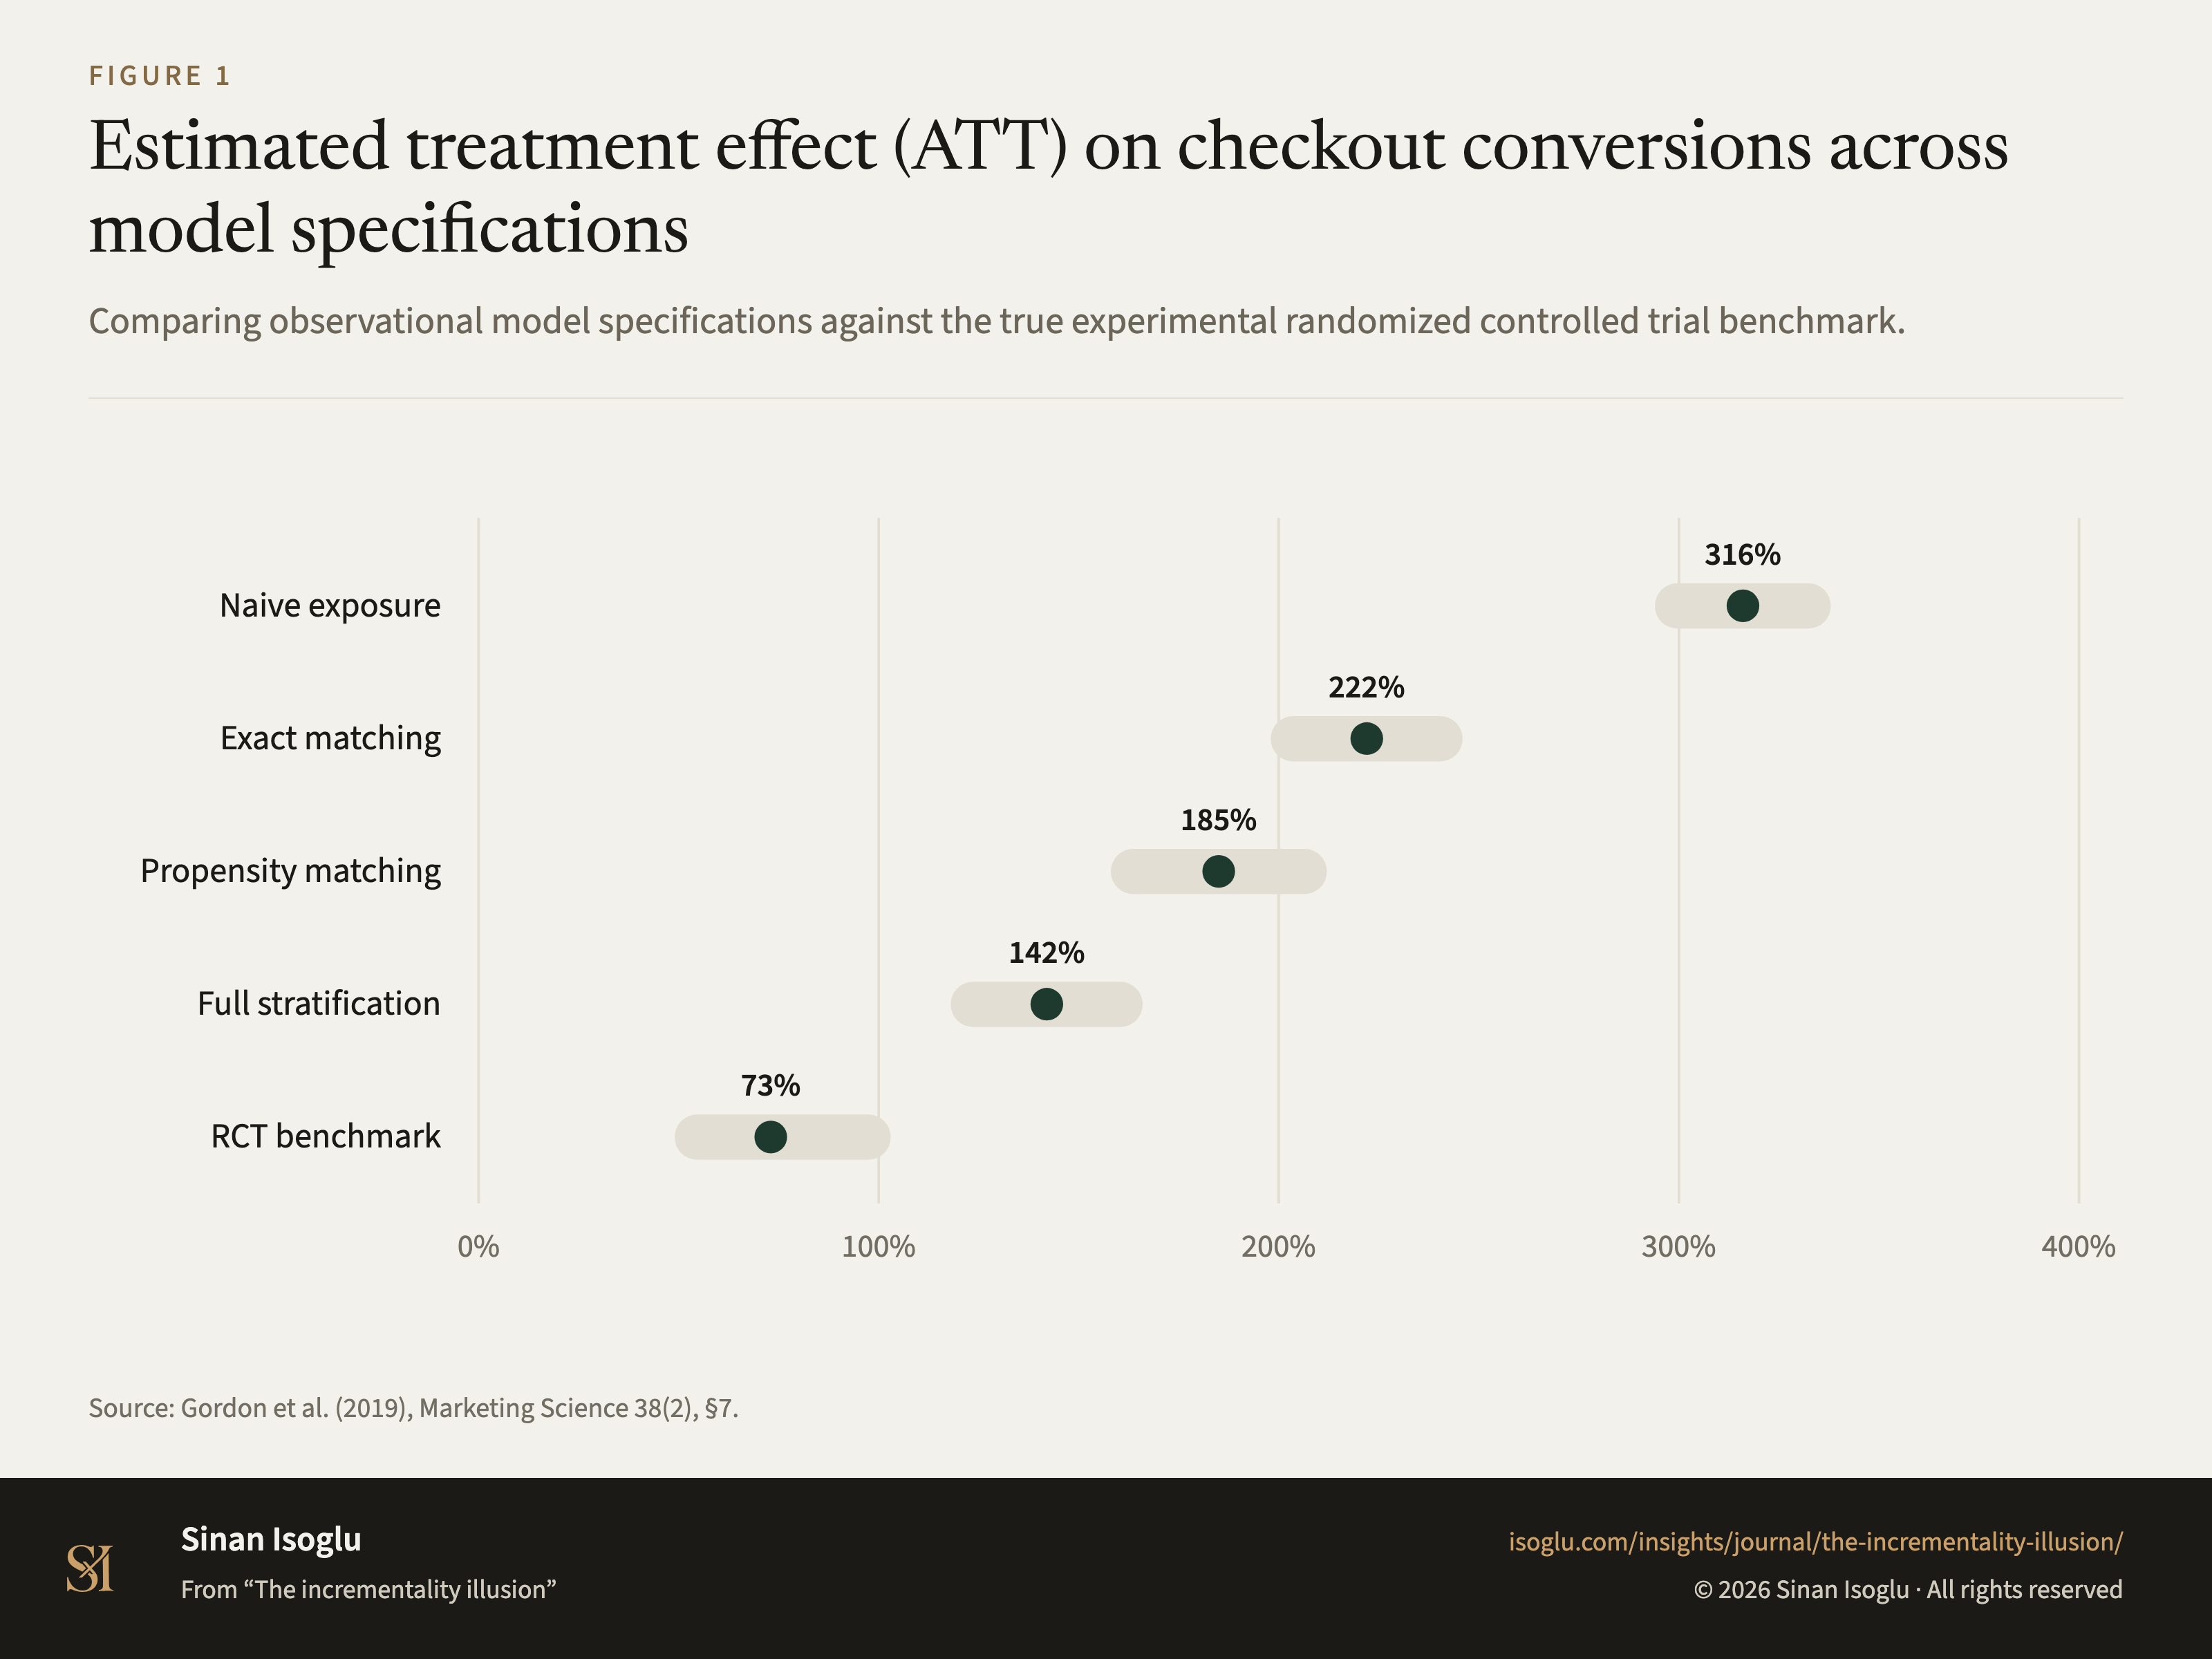
Estimated treatment effect (ATT) on checkout conversions in study 4, by method
Comparing observational estimates for one Facebook campaign against its randomized controlled trial benchmark.
Figure 1Estimated treatment effect (ATT) on checkout conversions in study 4, by method
Source: Gordon et al. (2019), Marketing Science 38(2): Figure 8, p. 21, and Figure 10, p. 24, of the Articles in Advance version held (pp. 1 to 33); the experiment's interval from §7.1, p. 19.
Source and evidence
Each line names a claim related to this exhibit, its source, and how it was checked.
- B GORDON19-C6 The randomized benchmark, with its interval: "this implies the ATT lift was 73%", and "the 95% bootstrapped confidence interval for this lift is [49%, 103%]"Gordon et al. (2019), section 7.1
- B GORDON19-C7 The naive comparison, and the authors' own reading of it: exposed and unexposed conversion of 0.061% against 0.019%, "implying an ATT lift of 316%. This estimate represents the combined lift due to treatment and selection and is more than four times the lift due to treatment of 73%"Gordon et al. (2019), section 7.2
- B GORDON19-C8 Matching on demographics is not enough: "exact matching on age and gender alone performs poorly, yielding a lift of 222%"Gordon et al. (2019), section 7.2.1
- A GORDON19-C15 Study 4, every method on every variable set (added 2026-10-16). Figure 8 (p. 21, page image) and Figure 10 (p. 24, page image), Articles in Advance version held, print the same lifts against an RCT lift of 73: exposed against unexposed 316, exact matching on age and gender 222; for variable sets 1 to 4, stratification 140, 136, 143 and 99, propensity score matching 145, 131, 143 and 95, regression adjustment 63, 61, 64 and 37, IPWRA 126, 122, 134 and 100, stratification with regression 98, 87, 96 and 74. Variable set 4 holds all the variables (Figure 10's column head: age, gender, FB, census, activity, FB match). Figure 8 draws an error bar for every estimate but prints no interval values; the only study 4 interval printed is the RCT's [49%, 103%] (GORDON19-C6). The authors read set 4 as close to the RCT except regression adjustment, and ask whether study 4 is typical (pp. 21, 22): "Summary of Lift Estimates and Confidence Intervals for Study 4"; "The richest set of explanatory variables, variable set 4, yields estimates of lift that are close to the RCT, except for RA, which underestimates lift."; "Study 4 suggests that some observational methods with a rich set of explanatory variables (e.g., STRATREG4) can recover the RCT lift."; "However, are the findings from study 4 typical?"Gordon et al. (2019), section 7.2.1, Figures 8 and 10
Grades: A, verified against the printed page of the primary source · B, primary source, text layer only · C, authoritative secondary · D, reported.
From the essay
Growth that compounds
The incrementality illusion
Why attribution dashboards can report phantom returns while holdout tests find little or no lift, and how to size causal measurement.
Read the essayThis exhibit belongs to an essay: the numbers live here, the argument lives there.
Cite or embed
Related exhibits
Contact
Bring the question you're working on.
Research, a guest lecture, or a commercial question.