Abbildung 1Aus „Die Inkrementalitäts-Illusion“
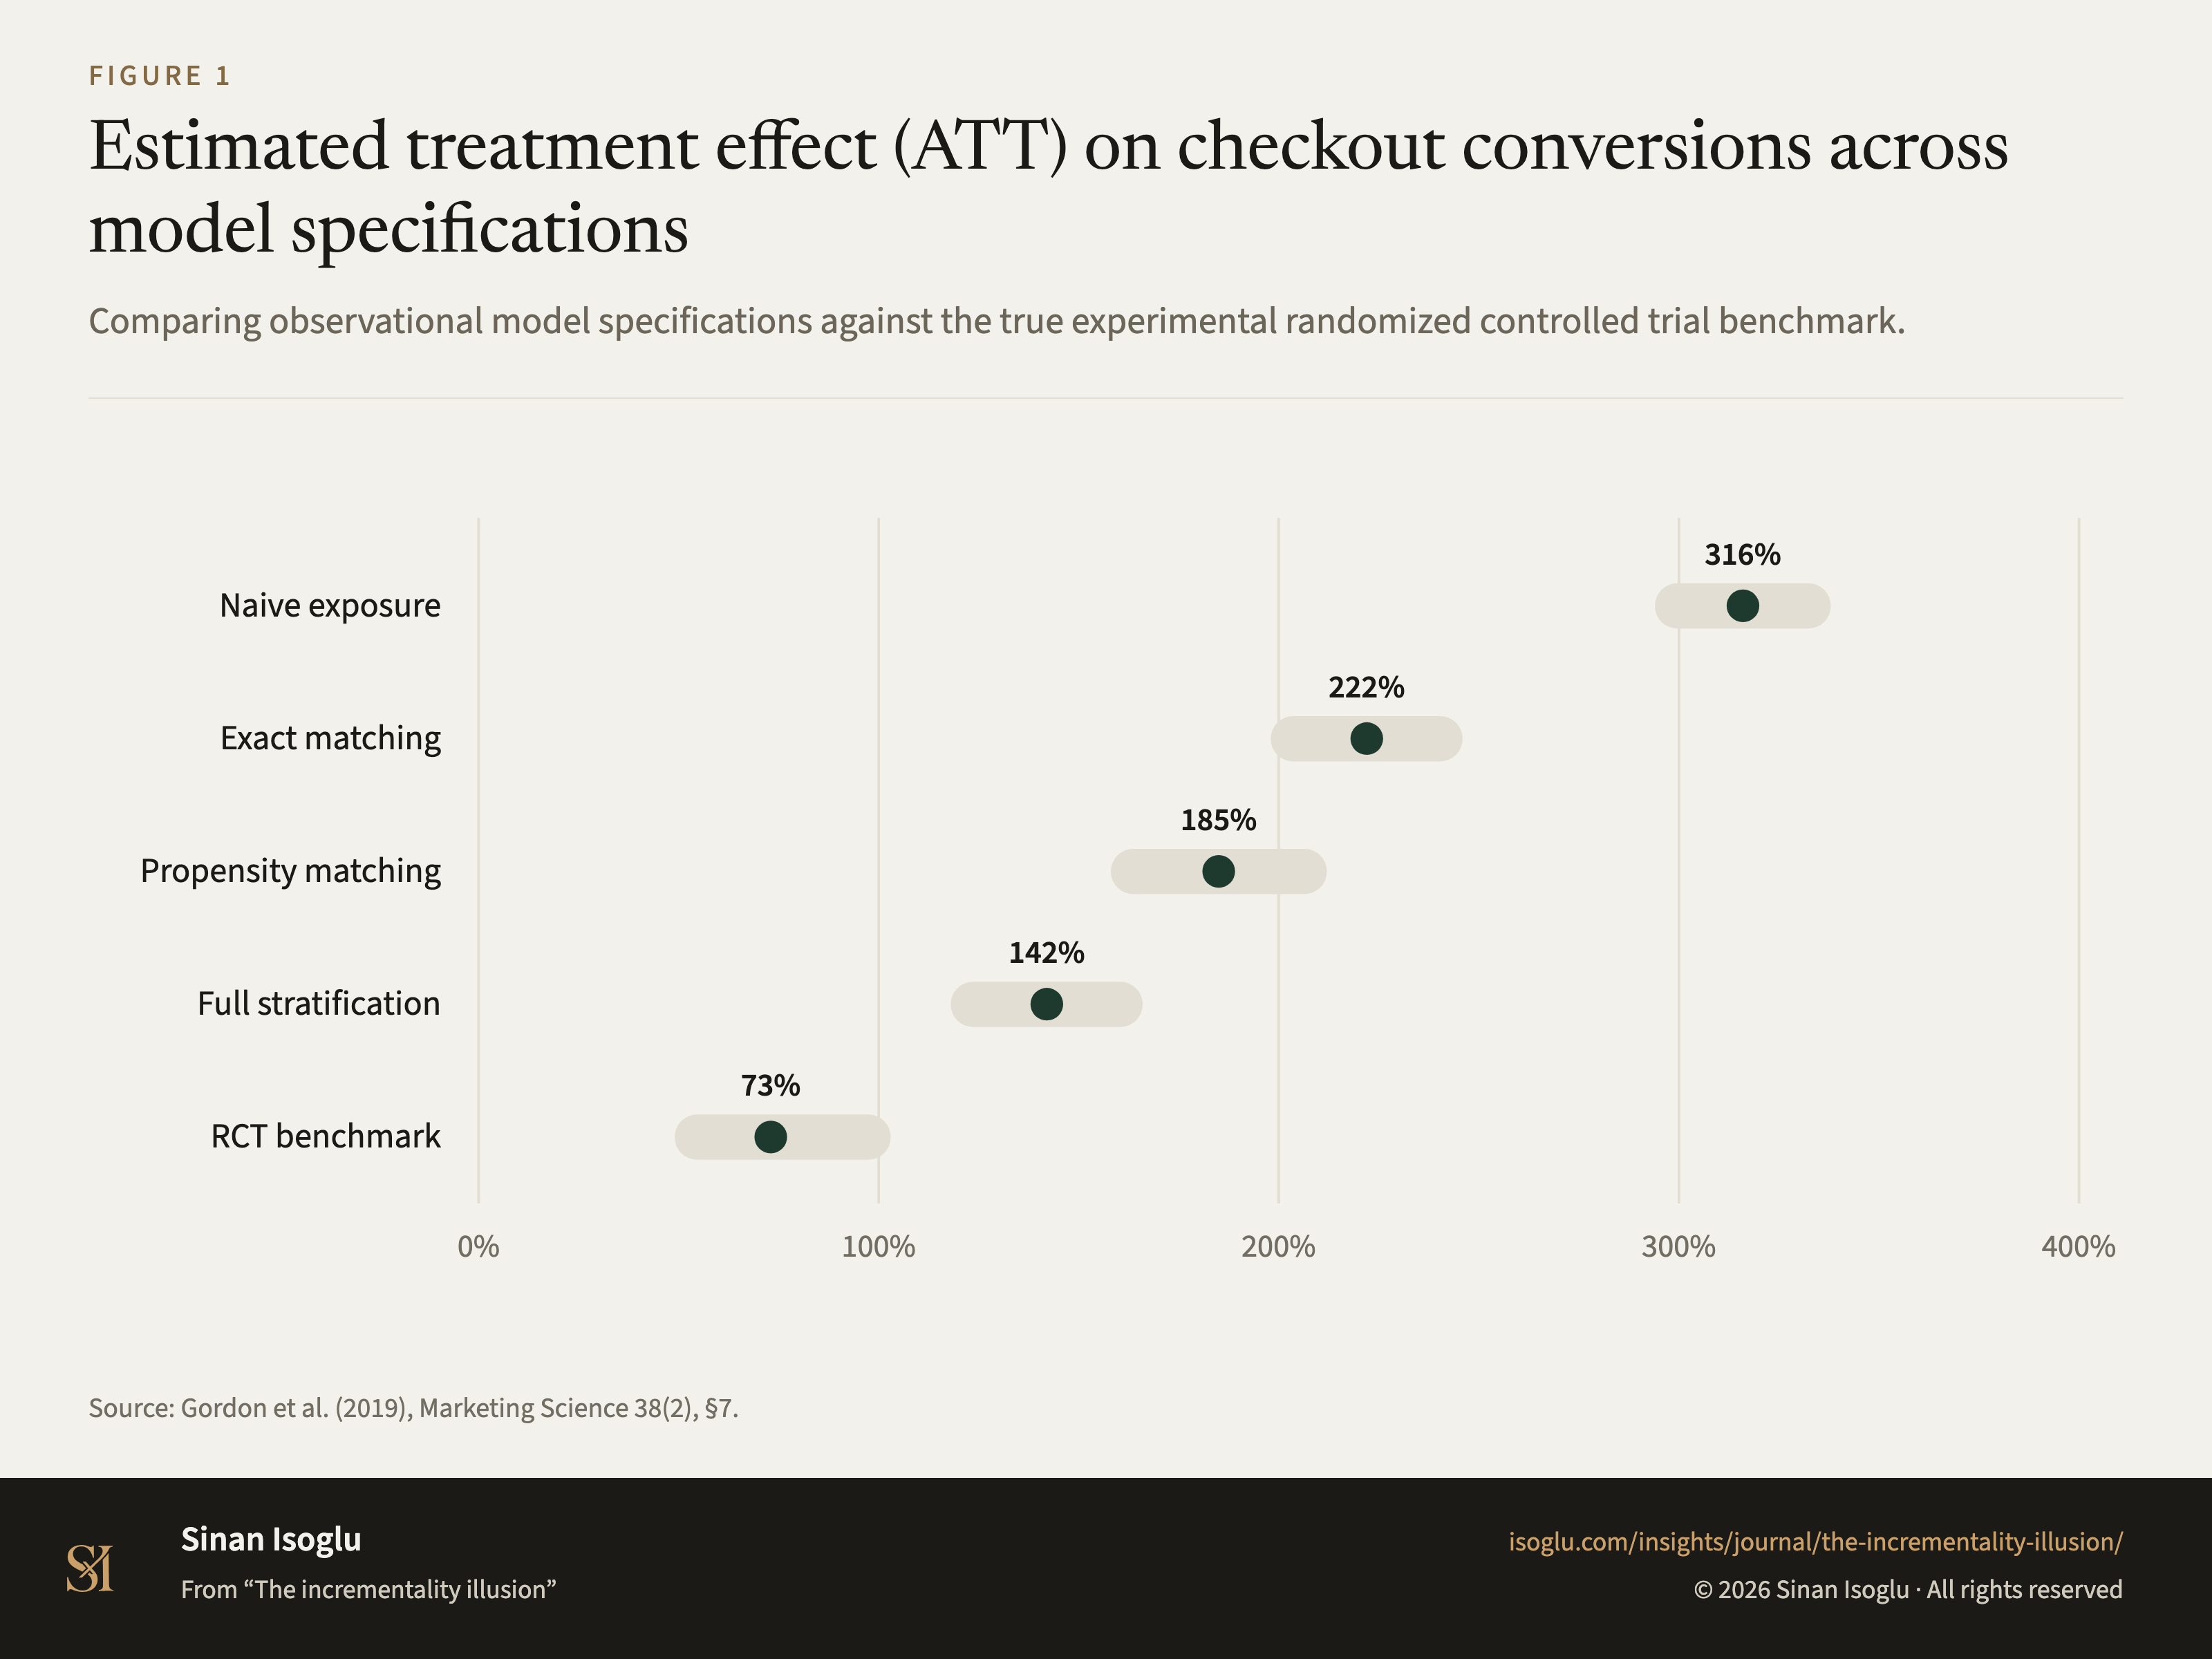
Geschätzter Behandlungseffekt (ATT) auf Checkout-Konversionen in Studie 4, nach Verfahren
Beobachtende Schätzungen für eine Facebook-Kampagne im Vergleich mit ihrem randomisierten Benchmark.
Abbildung 1Geschätzter Behandlungseffekt (ATT) auf Checkout-Konversionen in Studie 4, nach Verfahren
Quelle: Gordon et al. (2019), Marketing Science 38(2): Abbildung 8, S. 21, und Abbildung 10, S. 24 der vorliegenden Articles-in-Advance-Fassung (S. 1 bis 33); das Intervall des Experiments aus §7.1, S. 19.
Quelle und Evidenz
Jede Zeile nennt eine Aussage zu dieser Abbildung, ihre Quelle und die Art ihrer Prüfung.
- B GORDON19-C6 The randomized benchmark, with its interval: "this implies the ATT lift was 73%", and "the 95% bootstrapped confidence interval for this lift is [49%, 103%]"Gordon et al. (2019), section 7.1
- B GORDON19-C7 The naive comparison, and the authors' own reading of it: exposed and unexposed conversion of 0.061% against 0.019%, "implying an ATT lift of 316%. This estimate represents the combined lift due to treatment and selection and is more than four times the lift due to treatment of 73%"Gordon et al. (2019), section 7.2
- B GORDON19-C8 Matching on demographics is not enough: "exact matching on age and gender alone performs poorly, yielding a lift of 222%"Gordon et al. (2019), section 7.2.1
- A GORDON19-C15 Study 4, every method on every variable set (added 2026-10-16). Figure 8 (p. 21, page image) and Figure 10 (p. 24, page image), Articles in Advance version held, print the same lifts against an RCT lift of 73: exposed against unexposed 316, exact matching on age and gender 222; for variable sets 1 to 4, stratification 140, 136, 143 and 99, propensity score matching 145, 131, 143 and 95, regression adjustment 63, 61, 64 and 37, IPWRA 126, 122, 134 and 100, stratification with regression 98, 87, 96 and 74. Variable set 4 holds all the variables (Figure 10's column head: age, gender, FB, census, activity, FB match). Figure 8 draws an error bar for every estimate but prints no interval values; the only study 4 interval printed is the RCT's [49%, 103%] (GORDON19-C6). The authors read set 4 as close to the RCT except regression adjustment, and ask whether study 4 is typical (pp. 21, 22): "Summary of Lift Estimates and Confidence Intervals for Study 4"; "The richest set of explanatory variables, variable set 4, yields estimates of lift that are close to the RCT, except for RA, which underestimates lift."; "Study 4 suggests that some observational methods with a rich set of explanatory variables (e.g., STRATREG4) can recover the RCT lift."; "However, are the findings from study 4 typical?"Gordon et al. (2019), section 7.2.1, Figures 8 and 10
Prüfgrade: A, gegen die gedruckte Seite der Primärquelle geprüft · B, Primärquelle, nur Textebene · C, belastbare Sekundärquelle · D, berichtet.
Aus dem Beitrag
Wachstum, das sich potenziert
Die Inkrementalitäts-Illusion
Warum Attributions-Dashboards Phantom-Renditen melden, während Holdout-Tests wenig oder keinen Uplift finden und wie kausale Messung planbar wird.
Den Beitrag lesenDiese Abbildung gehört zu einem Essay: Die Zahlen stehen hier, das Argument dort.
Zitieren oder einbetten
Verwandte Abbildungen
Kontakt
Schicken Sie die Frage, an der Sie arbeiten.
Forschung, ein Gastvortrag oder eine Frage aus der Praxis.