Figure 1From “What is incrementality?”
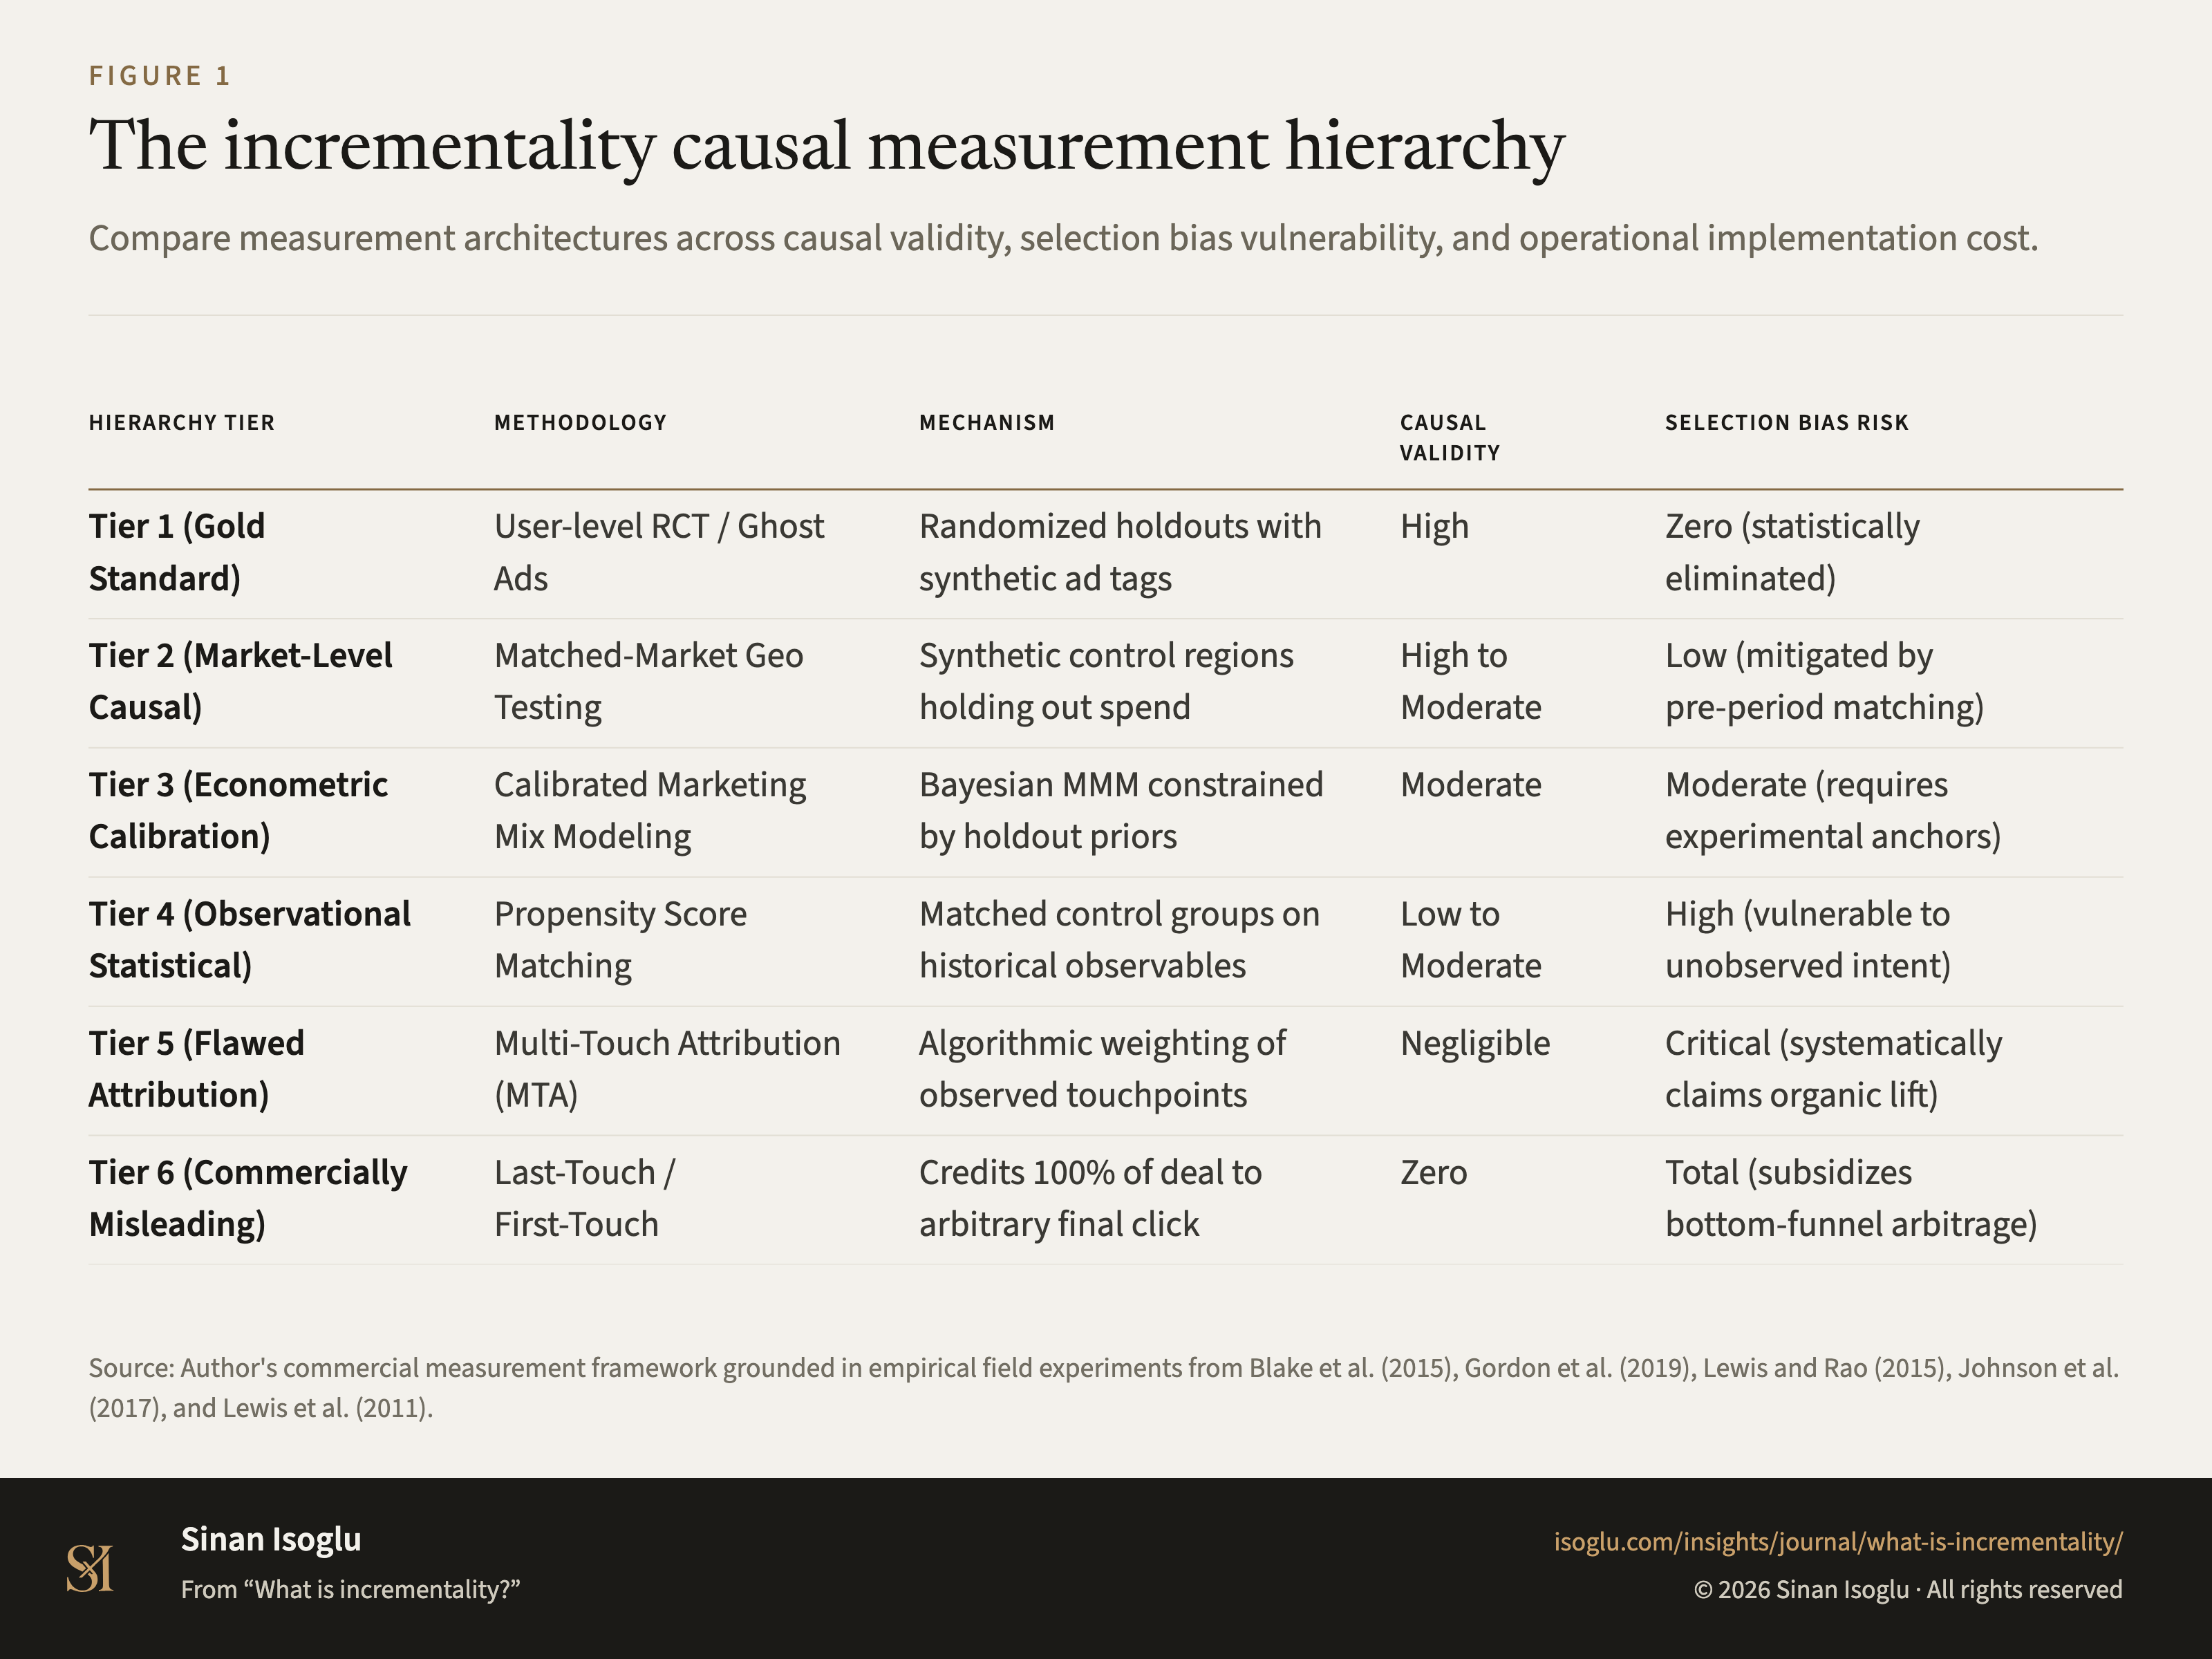
The incrementality causal measurement hierarchy
Compare measurement architectures across causal validity, selection bias vulnerability, and operational implementation cost.
Figure 1The incrementality causal measurement hierarchy
| Hierarchy tier | Methodology | Mechanism | Causal validity | Selection bias risk |
|---|---|---|---|---|
| Tier 1 (Gold Standard) | User-level RCT / Ghost Ads | Randomized holdouts with synthetic ad tags | High | Zero (statistically eliminated) |
| Tier 2 (Market-Level Causal) | Matched-Market Geo Testing | Matched or synthetic control regions holding out spend | High to Moderate | Low to Moderate (pre-period fit is necessary, not sufficient) |
| Tier 3 (Econometric Calibration) | Calibrated Marketing Mix Modeling | Bayesian MMM constrained by holdout priors | Moderate | Moderate (requires experimental anchors) |
| Tier 4 (Observational Statistical) | Propensity Score Matching | Matched control groups on historical observables | Low to Moderate | High (vulnerable to unobserved intent) |
| Tier 5 (Flawed Attribution) | Multi-Touch Attribution (MTA) | Algorithmic weighting of observed touchpoints | Negligible | Critical (systematically claims organic lift) |
| Tier 6 (Commercially Misleading) | Last-Touch / First-Touch | Credits 100% of deal to arbitrary final click | Zero | Total (subsidizes bottom-funnel arbitrage) |
Swipe or scroll horizontally if the table is wider than your screen.
Source: Author's commercial measurement framework grounded in empirical field experiments from Blake et al. (2015), Gordon et al. (2019), Lewis and Rao (2015), Johnson et al. (2017), and Lewis et al. (2011).
Source and evidence
Each line names a claim related to this exhibit, its source, and how it was checked.
- B BNT15-C2 The strongest result is stated as an extreme case, not a rule: "as an extreme case, we show that brand keyword ads have no measurable short-term bene"fitsBlake, Nosko & Tadelis (2015), abstract
- B GORDON19-C7 The naive comparison, and the authors' own reading of it: exposed and unexposed conversion of 0.061% against 0.019%, "implying an ATT lift of 316%. This estimate represents the combined lift due to treatment and selection and is more than four times the lift due to treatment of 73%"Gordon et al. (2019), section 7.2
- A LR15-C1 "The median confidence interval on return on investment is over 100 percentage points wide", across 25 field experiments "most reaching millions of customers and collectively representing $2.8" million in spendLewis & Rao (2015)
- A LRR11-C3 What exposure actually signals is more of everything: "in given period of time, making it difficult to find a suitable" matched control, so the "match is fundamentally different from the exposed group" and the observational estimate is inflated rather than the advertising effectiveLewis, Rao & Reiley (2011)
Grades: A, verified against the printed page of the primary source · B, primary source, text layer only · C, authoritative secondary · D, reported.
From the essay
From the research bench
What is incrementality?
Incrementality isolates the true causal revenue lift produced by commercial interventions relative to an unexposed counterfactual baseline.
Read the essayThis exhibit belongs to an essay: the numbers live here, the argument lives there.
Cite or embed
Related exhibits
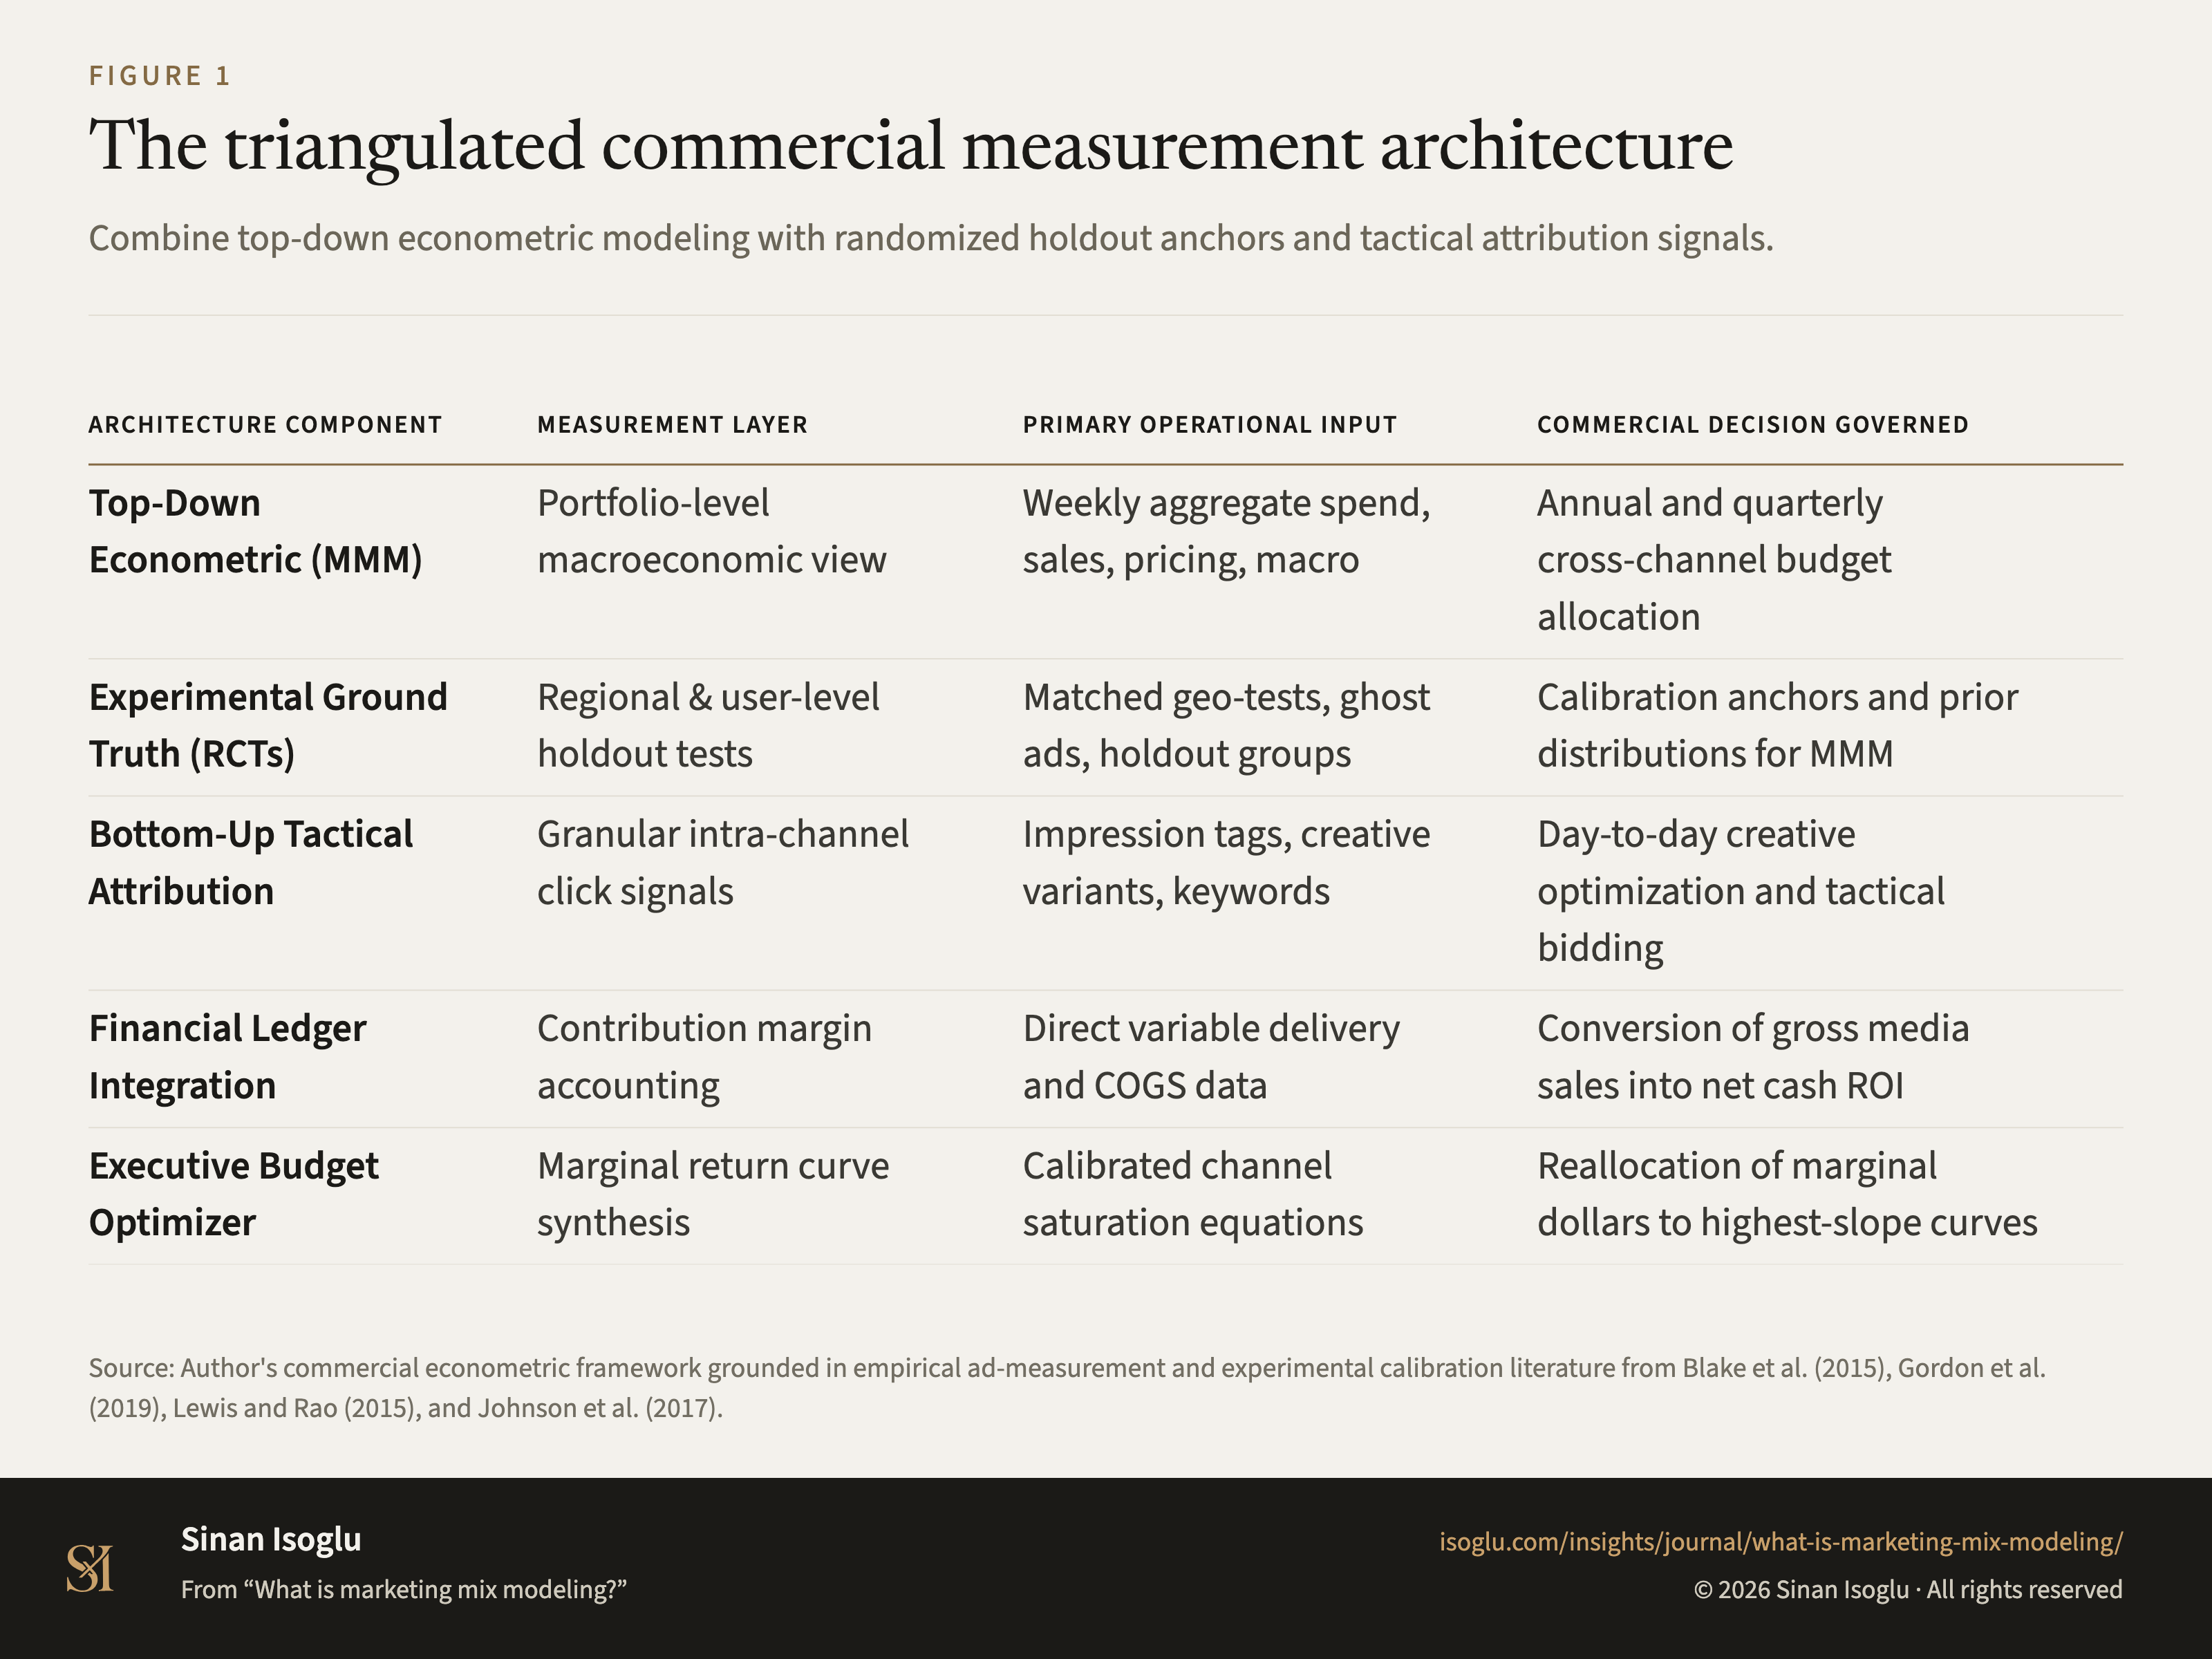
Figure 1Figure
The triangulated commercial measurement architecture
What is marketing mix modeling?

Figure 1Figure
Causal claim specification sheet
An uplift claim needs a specification before it needs a number
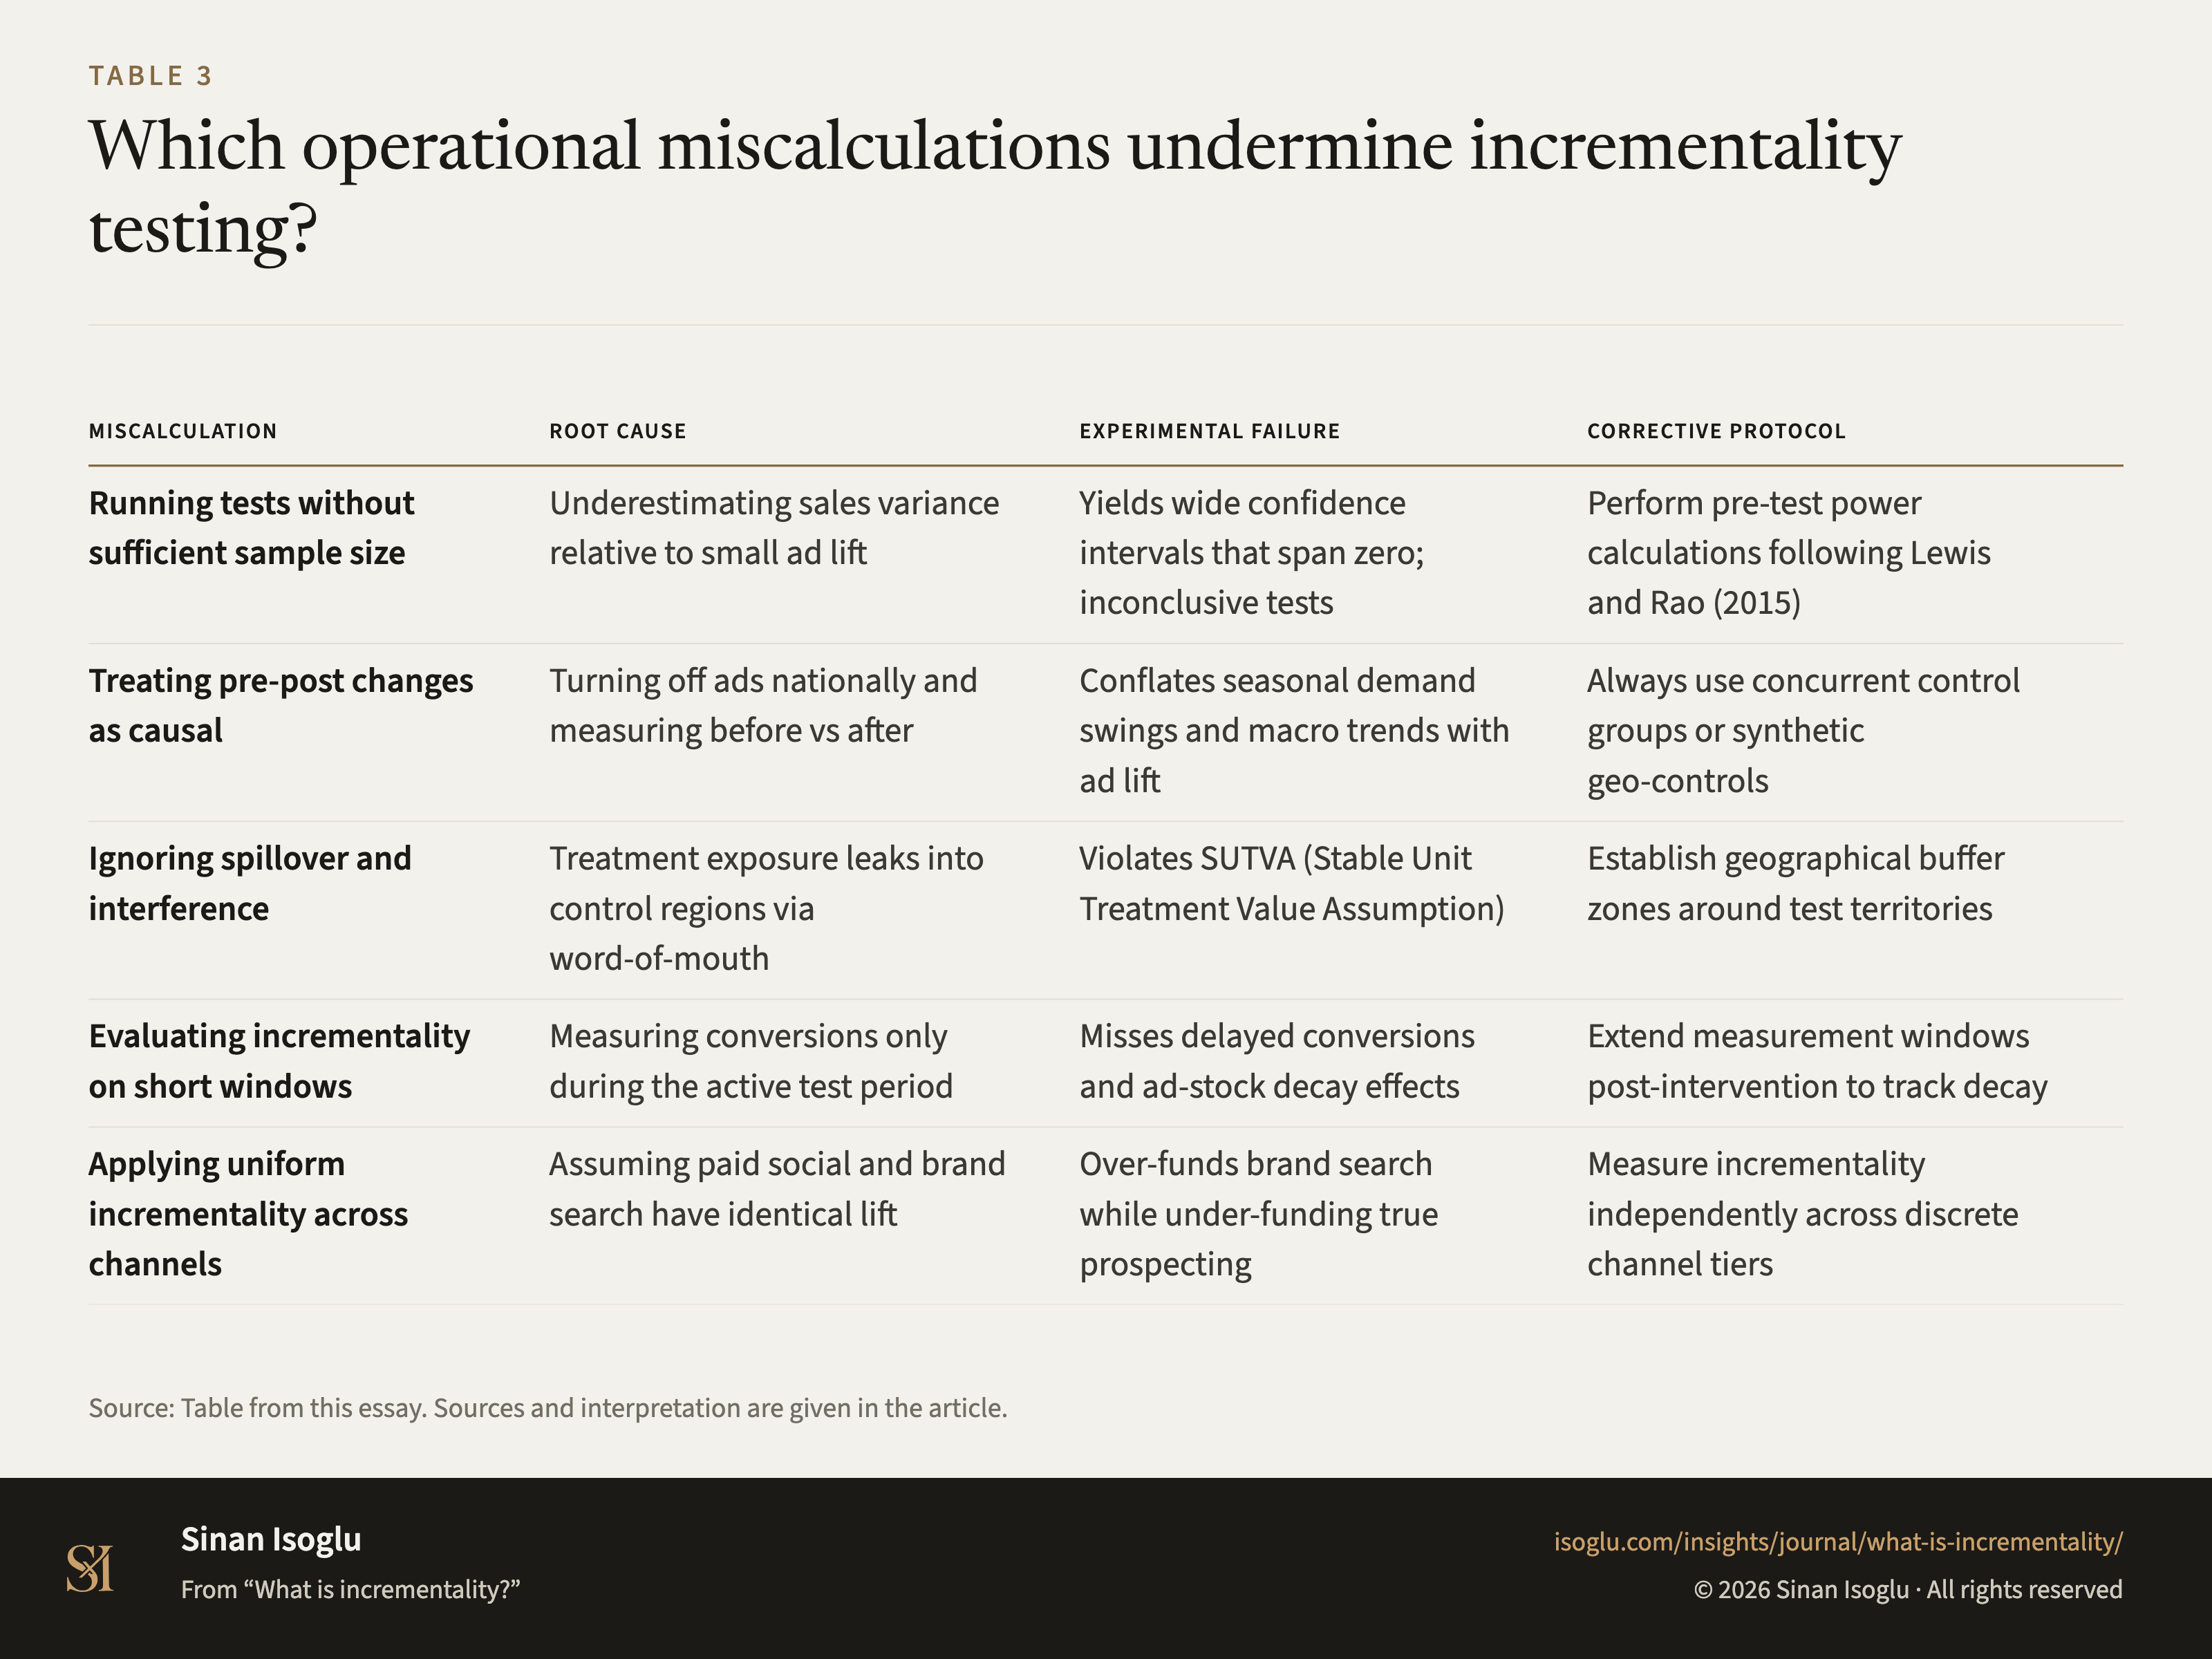
Table 2Table
Which operational miscalculations undermine incrementality testing?
What is incrementality?
Contact
Bring the question you're working on.
Research, a guest lecture, or a commercial question.